

Abstract
Objective
To evaluate positron emission tomography (PET) using 2-fluoro-2-deoxy-D-glucose (FDG) for clinical application in soft tissue sarcomas.
Summary and Background Data
FDG PET is a promising noninvasive method for the preoperative assessment of soft tissue sarcomas and may complement radiologic tomography.
Methods
Data from 50 consecutive patients with 59 masses, either suspicious for primary or locally recurrent soft tissue sarcoma, were prospectively gathered. The semiquantitative FDG uptake (standardized uptake values [SUVs]) was calculated in tumor and normal tissue (muscle). Histopathology of surgical specimens and follow-up data were used as control criteria.
Results
In primary soft tissue sarcomas, PET displayed a sensitivity of 91% and a specificity of 88%. Local recurrence was detected with a sensitivity of 88% and a specificity of 92%. All intermediate-grade and high-grade soft tissue sarcomas (primary and locally recurrent) were visualized with a precise differentiation from muscle. Fifty percent of the low-grade sarcomas showed an FDG uptake equivalent to muscle (false-negative results in one primary and three recurrent soft tissue sarcomas). Benign soft tissue tumors (e.g., lipoma, leiomyoma, ganglion) did not accumulate FDG. Inflammation resulted in an increased FDG uptake. The semiquantitative FDG uptake (SUVs) correlated with tumor grade but not with size and histologic type.
Conclusion
High-grade and intermediate-grade soft tissue sarcomas are amenable to PET imaging, whereas low-grade lesions may not be depicted. SUVs for FDG correlate with tumor grade in soft tissue sarcomas. Benign soft tissue tumors are differentiated from higher-grade soft tissue sarcomas. These data show that FDG-PET can complement preoperative radiologic assessment for soft tissue sarcomas and that FDG-PET is a powerful diagnostic tool for detecting high-grade and intermediate-grade local recurrence.
Since the 1930s, increased carbohydrate metabolism has been recognized as a feature of malignant cells versus normal cells. 1 This knowledge supplies the rationale for positron emission tomography (PET) imaging of malignant tumors using 2-[18F]-fluoro-2-deoxy-D-glucose (FDG). 2 FDG is a glucose analogue that accumulates in cells in proportion to the rate of glucose metabolism. 3 Hexokinase, as the key enzyme of glucose metabolism, phosphorylates FDG. Once phosphorylated, FDG is metabolically trapped preferentially in tumor cells. 2
In brain tumors and other types of carcinomas (e.g., colon and breast), FDG-PET is used as a diagnostic tool. However, the role of FDG-PET in imaging soft tissue sarcomas has not yet been clarified, and thus FDG-PET is not used routinely in this setting. 4–8
Until now, assessment of soft tissue sarcomas has combined clinical examination with radiologic tomography such as magnetic resonance imaging (MRI) and computed tomography (CT). 9 In primary soft tissue sarcomas, radiologic tomography is a precise method of pathoanatomical imaging, whereas biologic information such as tumor aggressiveness, as reflected by tumor grade or tumor necrosis, cannot be evaluated objectively. Therefore, biopsy is a prerequisite in the preoperative evaluation. Biopsy, however, is invasive and in large tumors is not always representative (due to necrosis and varying tumor grade within a lesion). 9 In the detection of local recurrence, radiologic tomography may be limited because of altered fascial planes, fibrosis, scarring, or tissue edema resulting from previous treatment. 10–13 These considerations make FDG-PET imaging valuable in soft tissue sarcomas. This study analyzes the use of qualitative and semiquantitative FDG-PET imaging in patients suspected of having soft tissue sarcomas, focusing on a functional, noninvasive estimation of tumor grade, identification of viable tumor tissue, and differentiation of local recurrence from benign posttherapeutic tissue alterations.
METHODS
Patients
We prospectively gathered data from 50 consecutive patients (24 women, 26 men; ages 16–78 years; median age 54) with 59 masses, seen at the Department of Surgery at the University of Heidelberg from January 1996 to January 1999. All patients were suspected of having a soft tissue sarcoma based on clinical symptoms and basic diagnostics (gadolinium-enhanced MRI [all] and contrast-enhanced CT [34%]). Of these 50 consecutive patients, 3 were excluded from the study either because of the lack of a final diagnosis in a primary mass (1 patient refused biopsy and resection after PET scanning) or because of technical failure (2 patients did not tolerate supine positioning during the 60 minutes of PET imaging). Therefore, data from 19 patients with 19 primary masses and from 28 patients with 37 suspected local recurrences are used for analysis in this study.
No patient had received chemo- or radiotherapy within 6 months before the PET studies. All patients with suspected local recurrence had a documented history of soft tissue sarcoma surgery. Forty-one percent of these patients had received radiotherapy as adjunctive primary treatment (median 58 Gy, range 52–78), and three patients had received chemotherapy (doxorubicin/ifosfamide). The primary histologic type, tumor grade, and International Union Against Cancer (UICC) stages of patients with suspected local recurrence are shown in Table 1. Of 37 suspected local recurrences, radiologic diagnosis was definitive in 24 masses; the remaining 13 lesions could not be specified as local failures nor as benign tissue reactions.
Table 1. PRIMARY MANIFESTATION IN PATIENTS WHO UNDERWENT PET IMAGING FOR SUSPECTED LOCAL FAILURE

The median diameter was 12 cm (range 6–23 cm) for primary masses and 4 cm (range 1–15 cm) for suspected local recurrences. Lesions were located in the extremities (61%), retroperitoneum (22%), abdomen (13%), and trunk (4%). Surgery (biopsy/resection) was performed for all primary masses. In patients with suspected local recurrences, 30 masses were biopsied and 7 were not (refused by the patients). Those refusing biopsy were followed up by clinical and radiologic examinations (median follow-up, 9 months; range 4–27). Specimens were reviewed by one pathologist (GM). Tumors were classified (type and stage) according to the UICC classification system and were graded according to the WHO system. 14,15
Imaging Studies
Informed consent was obtained from all patients before the PET studies. Images were acquired using a PET scanner with two rings of detectors (PC 2048-7 WB, Scanditronix Co., Uppsala, Sweden) or a system with 32 rings in block detector technology (ECAT HR plus, Siemens CTI Co., Knoxville, TN). The evaluation of spatial linearity showed that the maximum displacement from the ideal source position was less than 0.4 mm in the whole field of view. FDG was generated according to the method described by Toorongian et al. 16 The radiochemical purity was verified with high-performance liquid chromatography. Patients fasted overnight and serum glucose levels were measured before PET imaging. After the intravenous injection of 370 to 440 MBq FDG, serial images were obtained during a total acquisition time of 60 minutes. The last images (55–60 minutes postinjection) were used for quantitative analysis. Using an iterative reconstruction program, PET cross-sections were reconstructed with an image matrix of 256 × 256. 17 Images were scatter- and attenuation-corrected. 18 Regions of interest were placed over the lesion to be representative of the most metabolically active area as well as over normal muscle (contralateral side for extremities). The PET images were analyzed using pmod software (provided by a cooperation with the University of Zurich, Switzerland). 19 The semiquantitative tracer uptake (standardized uptake value [SUV]) in tumor and muscle was calculated by the following equation:
The analysis of the PET images was performed together by two nuclear medicine physicians (AD-S, LGS) masked to the radiologic diagnosis.
Statistical Analysis
SAS software (release 6.12, SAS Institute, Inc., Cary, NC) was used for statistical analysis. The difference between tracer accumulation in tumor and muscle was analyzed using the sign-rank test. To compare subgroups of patients with respect to tracer uptake, the Mann-Whitney test was performed. The distribution of tracer uptake according to subgroups was presented by box and whisker plots or dot plots. Statistical significance was assumed at P < .05. For correlation analysis, the Spearman rank correlation coefficient was used.
RESULTS
We found FDG-PET useful in distinguishing primary soft tissue sarcomas from benign soft tissue tumors. For the detection of local failure, FDG-PET was found to complement radiologic diagnostics by providing functional information. Moreover, FDG-PET could define tumor expansion. In the assessment of tumor aggressiveness, FDG-PET could distinguish among tumor grade categories and could identify tumor necrosis. In large soft tissue sarcomas, PET could localize representative areas of viable, metabolically active tumor tissue.
Primary Tumors
Histopathologic examination of 19 specimens revealed 11 soft tissue sarcomas (7 liposarcomas, 2 leiomyosarcomas, 1 synovial sarcoma, 1 fibrosarcoma), 7 benign primary tumors (2 lipomas, 1 leiomyoma, 1 ganglion, 1 neuroepithelioma, 1 ganglioneuroma, 1 hemangioendothelioma), and 1 inflammation. Tumor grade was high in 82% (n = 9) and intermediate and low in 9% (n = 1) each. Ten of 11 soft tissue sarcomas were visualized by FDG-PET, whereas one low-grade liposarcoma was not. Benign primary tumors did not accumulate FDG. Inflammation resulted in a drastically increased uptake, seen in a patient with a primary mass in the axilla 20 years after mastectomy and radiation therapy. Her records documented injections of nonsteroidal antiinflammatories to the shoulder girdle. Incisional biopsy, carried out twice under general anesthesia, revealed a soft tissue inflammation with no evidence of malignancy. In these 19 primary masses, the sensitivity of FDG-PET was found to be 91% and the specificity 88% for detecting soft tissue sarcomas.
Local Recurrence
Pathology reports of 30 specimens showed 24 local recurrences (14 liposarcomas, 3 leiomyosarcomas, 2 malignant fibrous histiocytomas, 2 chondrosarcomas, 1 synovial sarcoma, 1 schwannoma, 1 fibrosarcoma) and 6 benign tissue alterations (granuloma, synovial cyst, and scar tissue). Another seven masses, neither biopsied nor resected, remained clinically and radiologically unremarkable during follow-up. High-grade recurrences were found in 50% (n = 12), intermediate-grade in 21% (n = 5), and low-grade in 29% (n = 7). Taken together (n = 37), local failure was accurately diagnosed by FDG-PET in 21 of 24 local recurrences (sensitivity 88%). Three false-negative diagnoses occurred in two low-grade liposarcomas and a low-grade chondrosarcoma. PET accurately indicated no local failure in 12 of 13 masses that were indeterminable lesions on MRI/CT images (specificity 92%). One false-positive result was obtained due to an acute colonic inflammation (diverticulitis, clinical diagnosis; evaluation for a suspected retroperitoneal liposarcoma recurrence).
Qualitative FDG Uptake
In large soft tissue sarcomas (≥12 cm), inhomogeneous FDG distribution was noticed. Areas of suppressed FDG uptake corresponded with spontaneous tumor necrosis (histopathologic examination, n = 12). Although tumor necrosis was usually located centrally (n = 9), peripheral necrosis was also observed (n = 3). In two instances, PET supplied additional information about the tumor extension that had clinical impact. PET, in contrast to MRI, showed that an inguinal sarcoma recurrence did not involve the testicle. The surgical strategy, based on the PET finding, was primarily to preserve the testicle. Surgery confirmed no involvement of the testicle, and the pathology report documented a complete resection. In another patient (three prior operations), tumor spread exceeding the previous surgical field was indicated by PET. Based on the PET findings, the resection was extended, resulting in clear margins of the specimen. Figure 1 shows a PET image of a high-grade recurrent liposarcoma (lower abdomen) in three-plane reconstruction (sagittal, transverse, and frontal).
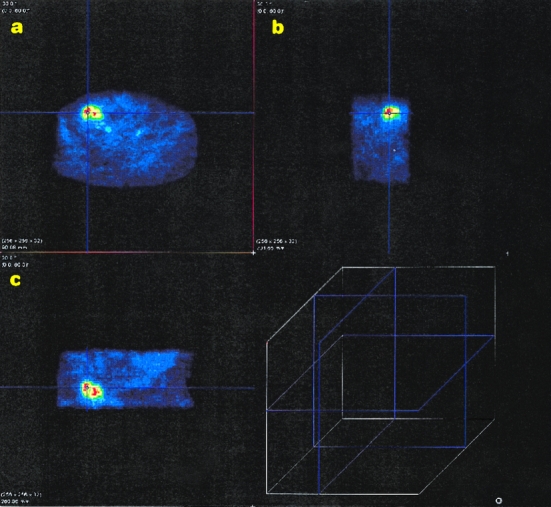
Figure 1. Transverse (A), sagittal (B), and frontal (C) plane of a recurrent high-grade liposarcoma in the lower abdomen reconstructed with the pmod program. Viable tumor tissue is shown in red and yellow; surrounding normal tissue appears blue. The lines running across the tumor are used for the selection of the image plane in the pmod program (the cube shows the different image planes).
Quantitative FDG Uptake
The SUV increased with higher tumor grade (Fig. 2). The median SUV was 1.3 (range 0.37–1.9) for low-grade soft tissue sarcomas, 2.7 (range 1.2–6) for intermediate-grade, and 4.5 (range 1.4–9.1) for high-grade. The mean SUVs in the grade categories were significantly different (P < .001), although a certain overlap was noticed. Other histopathologic parameters such as size (more than or less than 5 cm) or type did not show significant differences (P = .91 and P = .58, respectively). No correlation was found between the size of the soft tissue sarcoma (maximum diameter) in centimeters and the SUV (r = 0.03). In patients with high- and intermediate-grade soft tissue sarcomas, the SUVs in muscle were uniformly lower than in tumor tissue (median 0.7; range 0.31–1.1;P < .001) (Fig. 3). The tumor-to-muscle ratio in high- and intermediate-grade soft tissue sarcomas varied from 2 to 18, with a median 4.8-fold increase in soft tissue sarcomas. Of all low-grade sarcomas, four showed an increased and four an equivalent or decreased uptake compared with muscle (median tumor-to-muscle ratio, 2.3; range 0.8–3.5). Although the SUVs in half of the low-grade soft tissue sarcomas were higher than in muscle, the difference was not significant (median 0.6, range 0.45–0.8;P = .13).

Figure 2. FDG uptake shown for low-, intermediate-, and high-grade soft tissue sarcomas (SUV [standardized uptake value], box and whisker plot: minimum, 25th percentile, median [-], mean [*], 75th percentile, maximum and extreme values outside three interquartile range [⋄]).

Figure 3. Quantitative F-18-deoxyglucose (FDG) uptake for (A) high- and intermediate-grade soft tissue sarcomas compared with healthy muscle and (B) low-grade soft tissue sarcomas compared with healthy muscle (SUV [standardized uptake value], dot-plot).
Primary high- and intermediate-grade soft tissue sarcomas were always distinguished from benign tumors (median SUV in benign tumors, 0.65; range 0.27–1.5;P = .004), whereas one primary low-grade soft tissue sarcoma was not (SUV 0.37) (Fig. 4). Benign noninflammatory tissue alterations showed significantly lower SUVs than higher-grade local recurrences (median SUV for scar, 1.2; range 0.5–2.1; median SUV for local failure, 2.7; range 0.6–9.1;P = .0015). No clear distinction was seen in low-grade soft tissue sarcomas and scar. Inflammation showed a high SUV (median 8.5, range 8–8.9).

Figure 4. Quantitative F-18-deoxyglucose (FDG) uptake in (A) primary soft tissue sarcomas versus primary benign soft tissue tumors and (B) local recurrence versus benign tissue alterations and soft tissue inflammation (SUV [standardized uptake value], box and whisker plot: minimum, 25th percentile, median [-], mean [*], 75th percentile, maximum and extreme values outside three interquartile range [⋄]).
DISCUSSION
This analysis suggests that semiquantitative FDG uptake measurements (SUVs) can be used to distinguish between different tumor grades in soft tissue sarcomas. SUVs in different histologic types of soft tissue sarcomas increase with tumor grade but not with the size of the lesion. No correlation of SUVs was observed with respect to the histologic type of soft tissue sarcomas (e.g., liposarcoma or leiomyosarcoma).
Semiquantitative uptake analysis as expressed by SUVs can be performed together with the reconstruction of PET images (immediately available) and does not require repeated and invasive arterial blood sampling, as is necessary for the evaluation of FDG metabolic rates. Although it was first reported that FDG metabolic rates could be used to differentiate among different tumor grades in soft tissue sarcomas, 20,21 it has been shown recently that the calculation of SUVs in soft tissue sarcomas can supply information similar to that of FDG metabolic rates. 22 Detailed quantitative analysis of tracer kinetics requires the use of a compartment model. To quantify FDG kinetics, different methods have been reported in the literature, such as the three-compartment model 23 or Patlak and Blasberg’s graphic evaluation analysis. 24 The most important issue in patient studies is the correct measurement of the input function, requiring repeated invasive arterial blood sampling or measuring the FDG uptake in a blood vessel. Because soft tissue sarcomas are mostly located in the extremities, only vessels with a diameter of less than 1 cm are distinguished in the field of view. In vessels of these sizes, partial volume effects can impair correct measurement of the input function. For these reasons (partial volume effect in small vessels or repeated invasive arterial blood sampling), we chose calculation of SUV for quantitative evaluation. There is evidence that using SUV, an improved differentiation of benign soft tissue tumors from high-grade sarcomas can be obtained from images acquired at later times. In a study with a 6-hour scanning protocol, SUVs measured 4 hours postinjection achieved the highest differentiation between benign and malignant masses (sensitivity 100%, 29 masses). 25 Whether this method will be useful for clinical application is unclear, because in our series the 1-hour images also achieved a sensitivity of 100% for distinguishing high- and intermediate-grade soft tissue sarcomas from benign tumors.
Our data suggest that the calculation of SUV is a useful method for preoperative and noninvasive assessment of tumor aggressiveness. SUVs analyzed on FDG-PET images may complement histopathologic grading of a small biopsy sample by providing information about the entire lesion. Histopathologic assessment of a small biopsy sample is, especially in large and inhomogeneous primary soft tissue sarcomas, not always representative of the most aggressive region (highest grade). By imaging the whole lesion, PET might identify areas where incisional biopsy will provide tumor tissue that represents the highest tumor grade.
In primary soft tissue sarcomas, we found FDG-PET to differentiate high- and intermediate-grade tumors from normal tissue accurately. In our analysis, one primary low-grade liposarcoma was not visualized, reflecting that low FDG uptake can occur in low-grade primary liposarcomas. 22 Nevertheless, it has been reported that low-grade primary soft tissue sarcomas can also be depicted on FDG-PET images. 26 Therefore, it may be assumed that only a subset of low-grade primary soft tissue sarcomas, rather than all low-grade tumors, cannot be detected. This also appears to be valid for locally recurrent soft tissue sarcomas. Low-grade local recurrences in our series showed either increased or decreased FDG uptake (four lesions were visualized; three were not).
Unlike low-grade soft tissue sarcomas, benign soft tissue tumors uniformly showed no FDG uptake in our series, allowing the differentiation from higher-grade soft tissue sarcomas. This is consistent with the findings of others and may represent a powerful diagnostic tool for the differentiation of primary masses suspicious for soft tissue sarcoma on MRI and CT. 20,21,25
The fact that a subset of low-grade soft tissue sarcomas is not detected by single-tracer FDG-PET raises the question of whether other tracers could supplement FDG. Further, the high FDG uptake in inflammatory tissues, as shown here and reported for abscess and inflammation of various origins or sites (e.g., postoperative, brain abscess, acute enterocolitis), suggests the need to evaluate auxiliary radiotracers. 27–29 For distinguishing inflammation, carbon-11-alpha-aminoisobutyric acid (AIB) has been proposed for clinical evaluation. 27 AIB, a nonmetabolized synthetic analogue of the natural amino acid alanine, reflects the alanine-like amino acid transport. 30 Labeled with carbon-11, it has been applied as a tumor imaging agent in animal models and patients with solid tumors (e.g., adenocarcinoma, malignant melanoma). 27,30 Results have indicated that AIB is suitable for imaging soft tissue sarcomas. 31 Its potential in low-grade soft tissue sarcomas and in the differentiation of inflammation is being evaluated. Besides AIB, O-15-labeled water might also be used as a complementary tracer to improve PET imaging in soft tissue sarcomas. Studies have shown that this tracer accumulates in soft tissue sarcomas. 31 In low-grade soft tissue sarcomas, O-15-labeled water might improve the accuracy of PET imaging (as an adjunct to FDG) because it reflects perfusion rather than metabolism (studies are ongoing). Whether measuring metabolic rates is more accurate for clinical application than semiquantitative imaging in soft tissue sarcomas is unknown. 22,26 Presumably, low-grade primary or locally recurrent soft tissue sarcomas, which do not accumulate FDG, will not be visualized by either method (using FDG as a single tracer). Further, it can be assumed that inflammation will result in a false-positive result independently from the method of quantitative FDG-PET imaging used.
The increase in limb-sparing surgery and the widespread use of high-resolution tomography for early detection of local recurrence have resulted in an increasing number of suspicious findings on follow-up MRI and CT scans. Fascial plane distortion, tissue edema, and fibrosis and scarring from previous surgery (with or without chemotherapy), as well as residual changes from radiotherapy (fibrosis), may resemble a local failure on radiologic tomography. 32,33 Even an experienced radiologist cannot always determine such findings as benign or malignant. CT and MRI have been found to yield many false-positive results in this clinical setting. 10–13,34 To improve the accuracy of the detection of local sarcoma recurrence, FDG-PET has been proposed as adjunct to MRI (sensitivity 83%) and CT (sensitivity 58%). 35
We found FDG-PET to be very sensitive for detecting high- and intermediate-grade local recurrences (all lesions depicted). Moreover, 12 of 13 masses that could not be determined as either local recurrences or benign changes based on radiologic tomography were accurately differentiated by FDG-PET. Our results confirm the observations by others in 17 patients evaluated with quantitative FDG-PET (sensitivity 93%, specificity 94%). 35 In a retrospective analysis using whole-body FDG-PET, a specificity of 94% and a sensitivity of 74% for the detection of local failure (n = 19) were observed. 36 The lower sensitivity found in that study might be explained by the retrospective design, the lower resolution of whole-body PET, and the lack of quantitative measurements.
The pretreatment FDG-PET imaging evaluated in this study showed that primary and locally recurrent soft tissue sarcomas are amenable to PET imaging with respect to tumor grade. The SUVs in soft tissue sarcomas correlated with tumor grade in a diverse group of soft tissue sarcomas. High- and intermediate-grade tumors were uniformly visualized on FDG-PET images. We apply this modality in clinical diagnostics because FDG-PET, complementary to MRI and CT, appears valuable in the pretreatment assessment (soft tissue sarcoma vs. benign soft tissue mass) and the detection of local recurrence (particularly in lesions indeterminable on radiologic tomography) in soft tissue sarcomas.
Acknowledgements
The authors thank G. Irngartinger for continuous support and the staff members of the PET facility for their assistance in preparing the radiopharmaceuticals and performing the imaging studies.
Footnotes
Correspondence: Matthias H.M. Schwarzbach, MD, Dept. of Surgery, University of Heidelberg, Im Neuenheimer Feld 110, 69120 Heidelberg, Germany.
Supported in part by grant no. HE 368/8-1 by the Deutsche Forschungsgemeinschaft and by grant FSP IV no. 11 by the Tumorzentrum Heidelberg-Mannheim.
Accepted for publication September 14, 1999.
References
- 1.Warburg O. The Metabolism of Tumors. New York: Smith; 1931.
- 2.Hawkins RA, Hoh CK, Dahlbom M, et al. PET cancer evaluations with FDG. J Nucl Med 1991; 32:1555–1558. [PubMed] [Google Scholar]
- 3.Som P, Atkins HL, Bandoypadhyay D, et al. A fluorinated glucose analog, 2-fluoro-2-deoxy-D-glucose (F-18): nontoxic tracer for rapid tumor detection. J Nucl Med 1980; 21:670–675. [PubMed] [Google Scholar]
- 4.Barker FG 2nd, Chang SM, Valk PE, et al. 18-Fluorodeoxyglucose uptake and survival of patients with suspected recurrent malignant glioma. Cancer 1997; 79:115–126. [PubMed] [Google Scholar]
- 5.Flanagan FL, Dehdashti F, Ogunbiyi OA, et al. Utility of FDG-PET for investigating unexplained plasma CEA elevation in patients with colorectal cancer. Ann Surg 1998; 227:319–323. [DOI] [PMC free article] [PubMed] [Google Scholar]
- 6.Lai DT, Fulham M, Stephen MS, et al. The role of whole-body positron emission tomography with [18-F]fluorodeoxyglucose in identifying operable colorectal cancer metastases to the liver. Arch Surg 1996; 131:703–707. [DOI] [PubMed] [Google Scholar]
- 7.Smith IC, Ogston KN, Whitford P, et al. Staging of the axilla in breast cancer: accurate in vivo assessment using positron emission tomography with 2-(fluorine-18)-fluoro-2-deoxy-D-glucose. Ann Surg 1998; 228:220–227. [DOI] [PMC free article] [PubMed] [Google Scholar]
- 8.Holder WD Jr, White RL Jr, Zuger JH, et al. Effectiveness of positron emission tomography for the detection of melanoma metastases. Ann Surg 1998; 227:764–771. [DOI] [PMC free article] [PubMed] [Google Scholar]
- 9.Enzinger FM, Weiss SW. Soft Tissue Tumors. 3rd ed. St. Louis, MO: Mosby; 1995. 17–87.
- 10.Hudson TM, Schakel M, Springfield DS. Limitations of computed tomography following excisional biopsy of soft tissue sarcomas. Skeletal Radiol 1985; 13:49–54. [DOI] [PubMed] [Google Scholar]
- 11.Weekes RG, Berquist TH, McLeod RA, Zimmer WD. Magnetic resonance imaging of soft-tissue tumors: comparison with computed tomography. Magn Reson Imaging 1985; 3:345–352. [DOI] [PubMed] [Google Scholar]
- 12.Reuther G, Mutschler W. Detection of local recurrent disease in musculoskeletal tumors: magnetic resonance imaging versus computed tomography. Skeletal Radiol 1990; 19:85–90. [DOI] [PubMed] [Google Scholar]
- 13.Pino G, Conzi GF, Murolo C, et al. Sonographic evaluation of local recurrences of soft tissue sarcomas. J Ultrasound Med 1993; 12:23–26. [DOI] [PubMed] [Google Scholar]
- 14.Weiss SW. WHO Histological Typing of Soft Tissue Tumors. 2nd ed. Berlin: Springer Verlag; 1994. 1–86.
- 15.Hermanek P, Sobin LH, eds. UICC TNM Classification of Malignant Tumors. 4th ed, rev 2. Berlin: Springer; 1992: 92–95.
- 16.Toorongian SA, Mulholland GK, Jewett DM, et al. Routine production of 2-deoxy-2-[18F]fluoro-D-glucose by direct nucleophilic exchange on a quaternary 4-aminopyridinium resin. Nucl Med Biol 1990; 3:273–279. [DOI] [PubMed] [Google Scholar]
- 17.Kontaxakis G, Tzanakos GS, Strauss LG, et al. Characteristics of the local convergence behavior of the iterative ML-EM image reconstruction algorithms. J Nucl Med 1997; 38:202–204. [Google Scholar]
- 18.Schmidlin P, Kübler WK, Doll J. Image processing in whole-body positron emission tomography. In: Schmidt HAE, Csernay L, eds. Nuclearmedizin. Stuttgart: Schattauer; 1987: 84–87.
- 19.Burger C, Buck A. Requirements and implementation of a flexible kinetic modeling tool. J Nucl Med 1997; 38:1818–1823. [PubMed] [Google Scholar]
- 20.Adler LP, Blair HF, Makley JT, et al. Noninvasive grading of musculoskeletal tumors using PET. J Nucl Med 1991; 32:1508–1512. [PubMed] [Google Scholar]
- 21.Griffeth LK, Dehdashti F, McGuire AH, et al. PET evaluation of soft-tissue masses with fluorine-18 fluoro-2-deoxy-D-glucose. Radiology 1992; 182:185–194. [DOI] [PubMed] [Google Scholar]
- 22.Eary JF, Conrad EU, Bruckner JD, et al. Quantitative [F-18]fluorodeoxyglucose positron emission tomography in pretreatment and grading of sarcoma. Clin Cancer Res 1998; 4:1215–1220. [PubMed] [Google Scholar]
- 23.Sokoloff L, Reivich M, Kennedy C, et al. The [14C]deoxyglucose method for the measurement of local cerebral glucose utilization: theory, procedure and normal values in the conscious and anesthetized albino rat. J Neurochem 1977; 28:897–916. [DOI] [PubMed] [Google Scholar]
- 24.Patlak CS, Blasberg RG. Graphical evaluation of blood-to-brain transfer constants from multiple-time uptake data. Generalizations. J Cereb Blood Flow Metabol 1985; 5:584–590. [DOI] [PubMed] [Google Scholar]
- 25.Lodge MA, Lucas JD, Marsden PK, et al. A PET study of 18FDG uptake in soft tissue masses. Eur J Nucl Med 1999; 26:22–30. [DOI] [PubMed] [Google Scholar]
- 26.Nieweg OE, Pruim J, van Ginkel RJ, et al. Fluorine-18-fluorodeoxyglucose PET imaging of soft-tissue sarcoma. J Nucl Med 1996; 37:257–261. [PubMed] [Google Scholar]
- 27.Strauss LG. Fluorine-18 deoxyglucose and false positive results: a major problem in the diagnostics of oncological patients. Eur J Nucl Med 1996; 23:1409–1415. [DOI] [PubMed] [Google Scholar]
- 28.Meyer MA. Diffusely increased colonic F-18 FDG uptake in acute enterocolitis. Clin Nucl Med 1995; 20:434–435. [DOI] [PubMed] [Google Scholar]
- 29.Sasaki M, Ichiya Y, Kuwabara Y, et al. Ringlike uptake of [18F]FDG in brain abscess: a PET study. J Comput Assist Tomogr 1990; 14:486–487. [PubMed] [Google Scholar]
- 30.Schmall B, Conti PS, Bigler RE, et al. Synthesis and quality assurance of [11C] alpha-aminoisobutyric acid (AIB), a potential radiotracer for imaging and amino acid transport studies in normal and malignant tissues. Int J Nucl Med Biol 1984; 11:209–214. [DOI] [PubMed] [Google Scholar]
- 31.Schwarzbach M, Willeke F, Dimitrakopoulou-Strauss A, et al. Functional imaging and detection of local recurrence in soft tissue sarcomas by positron emission tomography. Anticancer Res 1999; 19:1343–1350. [PubMed] [Google Scholar]
- 32.Schwarzbach M, Lehnert T, Willeke F, et al. The results of isolated hyperthermic limb perfusion in a multimodality therapy concept for soft-tissue sarcoma. Chirurg 1996; 67:1237–1243. [DOI] [PubMed] [Google Scholar]
- 33.Willeke F, Eble MJ, Lehnert T, et al. The application of intraoperative radiotherapy in the surgical treatment of retroperitoneal soft tissue sarcoma. Chirurg 1995; 66:899–904. [PubMed] [Google Scholar]
- 34.Arbeit JM, Hilaris BS, Brennan MF. Wound complications in the multimodality treatment of extremity and superficial truncal sarcomas. J Clin Oncol 1987; 5:480–488. [DOI] [PubMed] [Google Scholar]
- 35.Kole AC, Nieweg OE, van Ginkel RJ, et al. Detection of local recurrence of soft-tissue sarcoma with positron emission tomography using [18F]Fluorodeoxyglucose. Ann Surg Oncol 1997; 4:57–63. [DOI] [PubMed] [Google Scholar]
- 36.Lucas JD, O’Doherthy MJ, Wong JC, et al. Evaluation of fluorodeoxyglucose positron emission tomography in the management of soft-tissue sarcomas. J Bone Joint Surg Br 1998; 80:441–447. [DOI] [PubMed] [Google Scholar]