

Abstract
Objective
To describe functional health and health-related quality of life (QOL) before and after transplantation; to compare and contrast outcomes among liver, heart, lung, and kidney transplant patients, and compare these outcomes with selected norms; and to explore whether physiologic performance, demographics, and other clinical variables are predictors of posttransplantation overall subjective QOL.
Summary Background Data
There is increasing demand for outcomes analysis, including health-related QOL, after medical and surgical interventions. Because of the high cost, interest in transplantation outcomes is particularly intense. With technical surgical experience and improved immunosuppression, survival after solid organ transplantation has matured to acceptable levels. More sensitive measures of outcomes are necessary to evaluate further developments in clinical transplantation, including data on objective functional outcome and subjective QOL.
Methods
The Karnofsky Performance Status was assessed objectively for patients before transplantation and up to 4 years after transplantation, and scores were compared by repeated measures analysis of variance. Subjective evaluation of QOL over time was obtained using the Short Form-36 (SF-36) and the Psychosocial Adjustment to Illness Scale (PAIS). These data were analyzed using multivariate and univariate analysis of variance. A summary model of health-related QOL was tested by path analysis.
Results
Tools were administered to 100 liver, 94 heart, 112 kidney, and 65 lung transplant patients. Mean age at transplantation was 48 years; 36% of recipients were female. The Karnofsky Performance Status before transplantation was 37±1 for lung, 38±2 for heart, 53±3 for liver, and 75±1 for kidney recipients. After transplantation, the scores improved to 67±1 at 3 months, 77±1 at 6 months, 82±1 at 12 months, 86±1 at 24 months, 84±2 at 36 months, and 83±3 at 48 months. When patients were stratified by initial performance score as disabled or able, both groups merged in terms of performance by 6 months after liver and heart transplantation; kidney transplant patients maintained their stratification 2 years after transplantation. The SF-36 physical and mental component scales improved after transplantation. The PAIS score improved globally. Path analysis demonstrated a direct effect on the posttransplant Karnofsky score by time after transplantation and diabetes, with trends evident for education and preoperative serum creatinine level. Although neither time after transplantation nor diabetes was directly predictive of a composite QOL score that incorporated all 15 subjective domains, recent Karnofsky score and education level were directly predictive of the QOL composite score.
Conclusions
Different types of transplant patients have a different health-related QOL before transplantation. Performance improved after transplantation for all four types of transplants, but the trajectories were not the same. Subjective QOL measured by the SF-36 and the PAIS also improved after transplantation. Path analysis shows the important predictors of health-related QOL. These data provide clearly defined and widely useful QOL outcome benchmarks for different types of solid organ transplants.
Outcomes after a procedure like transplantation have traditionally measured only operative and long-term survival and complication rates. Cost, quality of life (QOL), and return to work are gaining importance as outcome measures, especially because of the intense resource utilization that transplantation demands. Better technology and therapies have produced longer survival after transplantation, and attention is shifting to the quality of those life years.
Quality of life is multidimensional. Health-related QOL can be divided into physical, psychological, and social domains of health. Each of these three components can be measured in two dimensions: objective assessment of functioning by clinical caregivers, and subjective perception of health by the patient and family members. The patient’s perspective is as important as that of the clinician. 1
Measuring QOL means translating the various domains into quantitative values. Most tools measure QOL domains separately by clustering a few specific questions about each domain. Many tools are available that have been validated in various groups of patients and are applicable to a variety of health statuses, conditions, and diseases. 1
In this study, we applied three well-accepted tools to four different types of transplant patients with several goals: to describe functional health and health-related QOL before and after transplantation; to compare and contrast outcomes among liver, heart, lung, and kidney transplant patients; to compare these outcomes with selected norms; and to explore whether physiologic performance, demographics, and other clinical variables are predictors of posttransplantation overall subjective QOL.
METHODS
Data were collected on 371 patients waiting for or having undergone a liver, heart, kidney, or lung single-organ transplant between 1994 and 2000 at the Vanderbilt University Transplant Center. Data were accumulated concurrently and abstracted retrospectively from patient medical records, from patients themselves, and from the Vanderbilt University Hospital administrative and transplantation outcomes databases. Subjective QOL instruments were sent by mail or hand-delivered at clinic visits to 430 patients for self-administration. Strict confidentiality was ensured. Follow-up calls were made to nonresponders. The final response rate was 86% (371/430).
The Karnofsky Performance Status was evaluated by transplant coordinators before and after surgery, at 3 months, at 6 months, and yearly thereafter, using a scale of 0 to 100 to assess functional rehabilitation of surviving patients. Karnofsky scores from 80 to 100 represent ability to carry out normal work and activity (able); scores from 50 to 70 represent ability to care for most personal needs but with varying amounts of assistance and inability to work (unable); and scores from 0 to 40 defined patients unable to care for themselves and needing chronic inpatient care (disabled). 2,3
Mean postoperative scores were compared with mean preoperative scores to determine the effect of transplantation. Then, serial Karnofsky data over time were analyzed by mixed model repeated measures analysis of variance to determine changes over time in functional performance among different organ transplant groups and patterns of improvement for patients with different levels of baseline functioning. The interaction effect between time and organ group was used to examine whether improvement in Karnofsky score over time differed by type of organ transplantation. Pairwise comparisons with Bonferroni adjustments were used to examine whether the group scores differed at particular time points. Karnofsky scores can be compared to the general population performing at a score of 100. 2,3
The Medical Outcomes Study 36 Item Short Form Health Survey (SF-36) was used to assess the physical, functional, emotional, and social dimensions of QOL before and after transplantation. Patients took the SF-36 at one point in time in their course, providing a cross-sectional sample, and were classified for the purpose of analysis as before transplantation and nominal 6, 12, 24, and 36 months after transplantation. Responses were scored using the computer algorithm that imputed missing values when appropriate, transformed scale scores to a low of 0 to a high of 100, and computed a composite physical function component and mental health function component that is centered at 50 for the general population, with a standard deviation (SD) of 10. 4 Higher scores represent higher functioning. Analysis of each of the eight domains, the physical component summary, and the mental component summary were performed. Posttransplantation values were compared with preoperative values to determine the effect of transplantation. The nominal time classified data were then analyzed for changes over time.
Given the dominance of physical dimensions covered by the SF-36 and the need to provide expanded emphasis on psychosocial domains, we used the Psychosocial Adjustment to Illness Scale (PAIS), a 46-item questionnaire, to assess the functional, emotional, and social dimensions of QOL before and after transplantation. Patients took the PAIS one time at some point in their course from preoperative to 5 years after transplantation, providing a cross-sectional sample, and were classified as pretransplantation, and nominal 6, 12, 24, and 36 months after transplantation. Each item is scored along a 4-point scale: 0 (no disturbance or interference), 1 (mild), 2 (moderate), and 3 (marked disturbance). Scores were calculated for each of seven domains of psychosocial adjustment and totaled to form a global PAIS score. The total score of the PAIS can range from 0 to 138. Higher scores represent poorer functioning and adaptation to life; lower scores represent better adjustment to illness. 5,6
Multivariate and univariate analyses of variance were used to evaluate the main and interaction effects of transplantation, time after transplantation, and organ group on the PAIS global score and on the SF-36 physical and mental component summary scores. SF-36 data were compared with general population norms published for the SF-36. 4 PAIS norms for the general population were not available.
A principal components factor analysis on the eight SF-36 and seven PAIS scales was performed to derive a single weighted composite subjective measure of health-related QOL. 7 Predictors of this single posttransplantation subjective QOL factor score were found using path analysis to model the effects of preoperative clinical measures, demographics, preoperative physical performance (Karnofsky), amount of time since transplantation, and postoperative Karnofsky score most immediate to the measures of subjective QOL (referred to as the saturated model). Variables that were not predictive of the QOL factor score were deleted using standard path analysis indices of model fit for structural equation systems (referred to as the simplified model).
Summary data for all measures are presented throughout as means±standard errors of the mean.
RESULTS
A total of 371 transplant patients were evaluated. There were a 65 lung, 94 heart, 100 liver, and 112 kidney transplant patients. At least 21% to 33% of each group was studied before the transplant to provide baseline data. The mean age was 48±0.7 years; 36% were female. Table 1 lists other demographic (race, education) and baseline clinical measures (serum creatinine, diabetes, and hypertension) before transplantation. One-year survival rates in the kidney, heart, liver, and lung patients were 98%, 89%, 86%, and 80%, respectively, a few percentage points better than and similar to 1-year survival figures from nationally reported data. 8 Thus, this study group of patients is a representative sample of the surviving population of transplant patients.
Table 1. DEMOGRAPHICS AND CLINICAL MEASURES BEFORE TRANSPLANTATION

IDDM, insulin-dependent diabetes mellitus; NIDDM, non–insulin-dependent diabetes mellitus.
Karnofsky Performance Status
The mean Karnofsky score before transplantation of the 279 patients studied longitudinally was 54±1 (Table 2). Overall, 22% of patients were able, 39% were unable, and 39% were disabled. The mean preoperative scores for lung and heart patients (37±1 and 38±2, respectively) were lower than the score for liver transplant patients (53±3), which in turn was lower than the score for kidney recipients (75±1) (P < .001). Corresponding to these differences, 0% to 3% of lung and heart patients were able; 84% of lung and 69% of heart patients were disabled. Future liver recipients were more broadly distributed across the three categories. Future kidney transplant recipients were quite different in their performance status, with 56% able, 44% unable, and none disabled.
Table 2. PRETRANSPLANTATION HEALTH-RELATED QUALITY OF LIFE DATA

PAIS, Psychosocial Adjustment to Illness Scale; SF-36, Short Form-36.
Comparing mean Karnofsky scores after transplantation (Table 3) with Karnofsky scores before transplantation (see Table 2) using paired t tests shows significant improvement for all types of transplant patients (all P < .001). No patients remained disabled after transplantation. The change in Karnofsky score after transplantation may be characterized as a very large effect (i.e., ≥1.2 SD) overall and for the lung, heart, and liver recipients. Kidney recipients demonstrated a moderate effect (0.6 SD). 9
Table 3. POSTTRANSPLANTATION HEALTH-RELATED QUALITY OF LIFE DATA

PAIS, Psychosocial Adjustment to Illness Scale; SF-36, Short Form-36.
Repeated measures analysis of variance demonstrated that the Karnofsky score improved for all patients from baseline, to 67±1 at 3 months, 77±1 at 6 months, 82±1 at 1 year, 86±1 at 2 years, 84±2 at 3 years, and 83±3 at 4 years (P < .001). (normal population = 100). Each organ group showed significant and continued improvement through the 2-year posttransplantation period, but the trajectories of improvement, as indicated by the interaction effect of time by organ (P < .001), were different between the organ groups (Fig. 1). Heart and lung patients had the worst physiologic performance before transplantation and made dramatic improvements after surgery. Heart patients improved rapidly, with most of their gains by 6 months after surgery (76±2); their score was 82±2 at 2 years. Lung patients improved more slowly, with performance leveling after 12 months after surgery; they scored 74±3 at 2 years. Liver patients’ improvement was between that of heart and lung patients, with most of the improvement occurring within the first 12 months after surgery; their score was 94±1 at 2 years. The magnitude of improvement for liver patients was similar to that for heart and lung patients. However, kidney patients made smaller gains in performance after surgery and thus had a much flatter trajectory, scoring 85±2 at 2 years.

Figure 1. Karnofsky Performance Status over time by type of organ transplanted. Graph demonstrates the difference in pretransplant performance status, with future lung and heart patients on average being disabled, liver transplant patients being unable, and kidney recipients being able. All patients improved over time, but their trajectory of improvement differed. All types ended up in the able category .
Stratifying liver and heart patients into those with scores above versus below 40 before surgery demonstrated that by 6 months after transplantation, the Karnofsky scores were similar and remained so thereafter (all P > .29). In contrast, stratifying the kidney recipients into those with scores above or below 70 before surgery revealed that the stratification remained after surgery, up to 2 years (all P < .01) (Fig. 2). Because 86% of the lung patients were disabled, the sample size was too small to conduct a similar analysis.
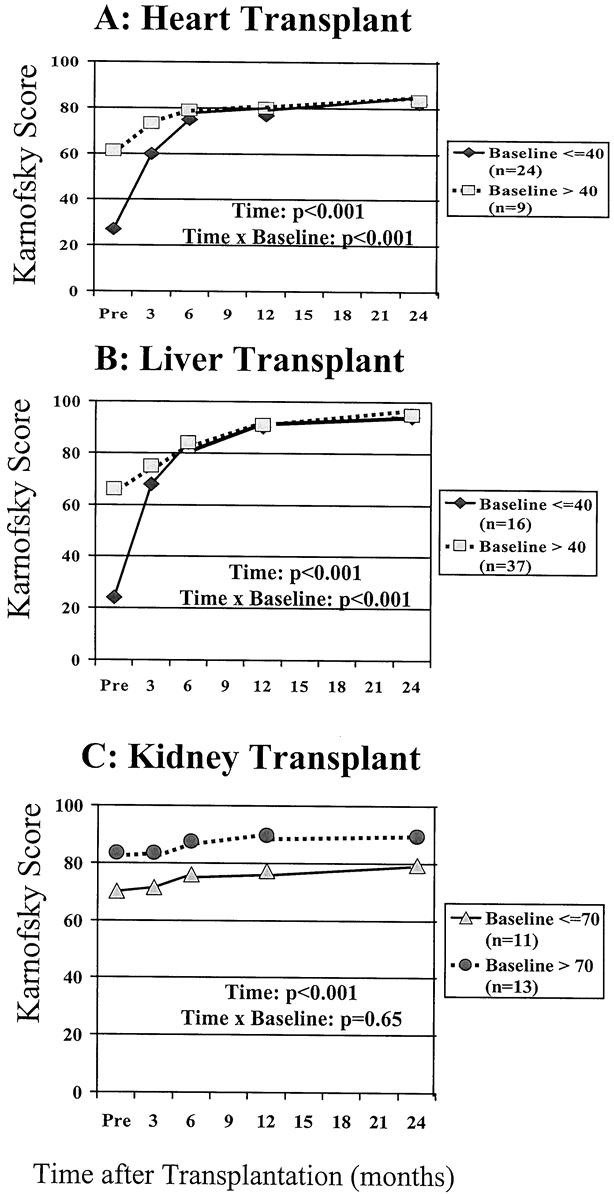
Figure 2. Patterns of improvement for patients stratified by baseline functioning after heart, liver, and kidney transplantation. (A) Whether beginning disabled or not (i.e., baseline functioning below or above a score of 40), heart transplant patients functioned similarly by 6 months after transplantation and thereafter. (B) This was also true for liver transplant recipients. (C) By comparison, stratification of kidney transplant recipients in the able versus unable category (above or below a score of 70) shows that these patients remained stratified up to 2 years after transplantation.
SF-36
Supplementing the objective Karnofsky score were patients’ subjective measures of health-related QOL (SF-36 and PAIS). Table 2 shows the pretransplantation scores and Table 3 the posttransplantation scores, which were at a median of 19 months and a mean of 24 months after transplantation. Comparing the individual domains of SF-36 before and after transplantation, as well as the physical and mental component summaries, shows significant improvement in each scale score except bodily pain and mental health for all patients, and for lung, heart, and liver patients. Kidney transplant patients did not show this consistent pattern of improvement.
The SF-36 and PAIS samples were collected cross-sectionally before surgery (21 lung, 24 heart, 21 liver, and 22 kidney patients) and after surgery, grouped at the 6-month (6 lung, 24 heart, 3 liver, and 34 kidney patients), 12-month (9 lung, 13 heart, 14 liver, and 26 kidney patients), 24-month (9 lung, 8 heart, 25 liver, and 15 kidney patients), and 36-month periods (18 lung, 22 heart, 29 liver, and 12 kidney patients). Table 4 summarizes the results for the SF-36 physical component and mental health component scales. For the SF-36 physical component summary, multivariate analysis of variance demonstrated significant main effects of time after transplantation (P < .001) and organ group (P < .05), and a significant interaction effect of time by organ group (P < .01). These findings were followed by univariate tests demonstrating a significant improvement in relation to pretransplantation SF-36 physical component summary scores at 12 (P < .001), 24 (P < .001), and 36 months (P < .05). The pattern of results for the SF-36 physical component mirrored that found for Karnofsky scores. Heart and lung patients had the worst health status before surgery and improved substantially after surgery (P < .001 and P < .05, respectively). The rate of improvement was quicker for heart patients than for lung patients. Liver patients had only slightly better health status than heart and lung patients before surgery, and the rate of improvement (P < .05) was between that of heart and lung patients. Kidney patients had a better health status before surgery compared with the other organ groups, and their SF-36 physical component did not change after transplantation (P = .70). These differences between organ groups accounted for the significant interaction effect. The effect size of improvement after transplantation in the SF-36 physical component would be considered moderate (>0.5 SD) to large (>0.8 SD) overall and in the lung, heart, and liver recipients. 9
Table 4. SF-36 AND PAIS VS. TIME AFTER TRANSPLANTATION

PAIS, Psychosocial Adjustment to Illness Scale; SF-36, Short Form-36.
Results for the SF-36 mental health component were similar to but less dramatic than those for the SF-36 physical component. Lung and heart patients showed significant improvement in mental health (P < .05). Liver patients showed a trend toward improved mental health (P = .08). Kidney patients showed no change in mental health status (P = .32).
Comparison With Normal Population
The pretransplantation SF-36 results (see Table 2) can be compared to a “normal” general population, which has a mean score for both the physical and mental component of 50 and SD of 10. 4 Before surgery, for all four transplant patient groups, physical and mental component results were significantly worse than normal (except the mental component for renal transplant recipients). Among all organ recipients, the posttransplantation mental component of the SF-36 became the same as that of the normal population, but there was still a deficit in the physical component compared with the normal population. Looking at the SF-36 data over time in Table 4, these statements remain accurate out to 36 months after surgery.
PAIS Results
Remembering that lower scores show improvement, one can see that PAIS scores were almost universally improved after transplantation as well. Table 4 shows improvement in the PAIS global scale during the first 36 months after transplantation (P < .01). Improvement after transplantation was significant among liver patients (P < .05), and a comparable trend was observed among heart and lung patients (P = .08 and P = .06, respectively). Renal patients did not demonstrate a significant change in PAIS global score after transplantation (P = .43). The pattern is thus similar to the Karnofsky and SF-36 data but not as pronounced. Unfortunately, there are no PAIS data in the literature for similar comparisons to a “normal” general population.
Path Analysis
Principal component analysis of the 15 individual domains of the SF-36 (8 domains) and PAIS (7 domains) demonstrated that a “general factor”7 representing health-related QOL was empirically supported. Therefore, we created a single composite score from the 15 domains to provide an overall subjective report of QOL. All individual domains were weighted between 0.51 and 0.81 on the composite measure.
Path analysis evaluated the effect of demographic measures (age at transplantation, gender, and education), baseline functional status (preoperative Karnofsky score), preoperative clinical measures (hypertension, diabetes, and serum creatinine), time after transplantation, and postoperative functional status (the Karnofsky score temporally associated with QOL data) on the health-related QOL composite measure (Fig. 3A). Analyses demonstrated that during the first 30 months after transplantation, there was a significant direct effect of time after transplantation (β = 0.32, P < .001) and severity of diabetes (β = −0.21, P = .01) on postoperative functional status. (The former finding corroborates the earlier longitudinal analysis of Karnofsky data.) The effects of education (β = 0.15, P = .06) and preoperative serum creatinine level (β = −0.17, P = .08) were close to achieving statistical significance but were not included in the simplified model. All other direct effects on postoperative functional status were not significant. The only measures that had significant direct effects on health-related QOL were postoperative functional status (β = 0.22, P = .01) and education (β = 0.22, P = .01). This analysis indicates that time after transplantation and diabetes were predictive of posttransplantation functional status (Karnofsky); time after transplantation was not directly predictive of posttransplant subjective health-related QOL; education level was predictive of health-related QOL; and a contemporaneous measure of functional status (recent Karnofsky) was the only direct, clinically related predictor of health-related QOL after solid organ transplantation. The chi-square goodness of fit of the simplified model demonstrated that the model was fitted to the data (i.e., did not differ significantly from the data; χ2 = 3.2, df = 3, P = .36) and the adjusted goodness-of-fit index (0.96) provided further empirical support for the simplified model (see Fig. 3B).
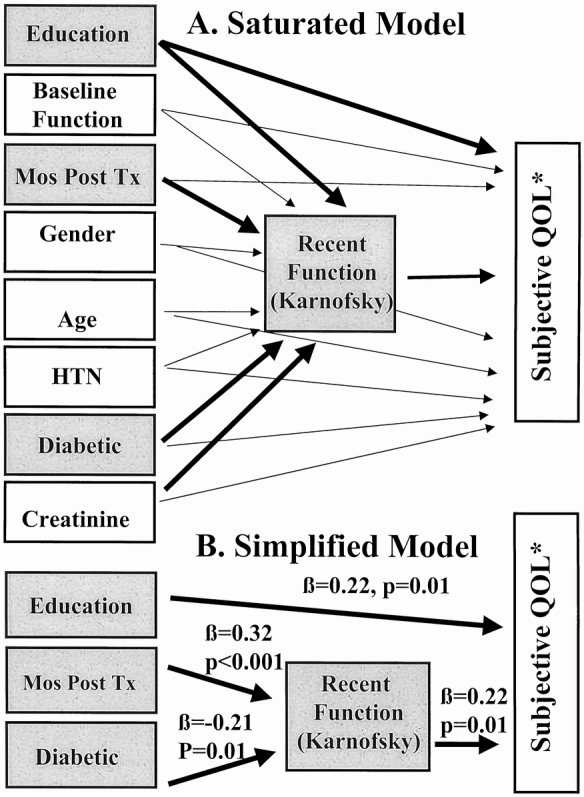
Figure 3. (A) Saturated model. This path analysis modeled the effects of preoperative demographic and clinical measures, Karnofsky performance, time after transplantation, and postoperative Karnofsky performance on the postoperative composite subjective quality of life measure (*) derived from the Short Form-36 and Psychosocial Adjustment to Illness Scale. Bold paths indicate effects that were significant or close to achieving statistical significance (P < .10). The effect of creatinine (P = .08) and education (P = .06) on recent Karnofsky function were dropped from the simplified model, but these trends were noteworthy. (B) Simplified model. Time and severity of diabetes influenced the postoperative Karnofsky performance status significantly; this and educational status predicted reported subjective composite quality of life.
DISCUSSION
We studied four types of solid organ transplant recipients from one center with a large overall sample using three well-validated instruments, one objective and two subjective. The sample was sufficiently large to permit analyses of within-group and between-group effects using standard multivariate and univariate statistical procedures. The pattern of results was similar for all three instruments. This report and previous reports in the literature (from this institution and others) have demonstrated the effects of organ transplantation per se and time after organ transplantation on health-related QOL, as measured by a variety of instruments. Although effects are not uniform across studies, organ groups, or domains, organ transplantation is, in general, associated with improved health-related QOL.
There are reports using the Karnofsky score to evaluate transplant patients, most in liver patients and none including all four solid organs. For example, we published serial Karnofsky data in 50 and then 100 liver recipients; the progression of values was almost identical to that reported here. 10,11 In a large meta-analysis, Bravata et al 12 reported a mean pretransplantation Karnofsky score of 49 in 745 liver transplant patients, a score of 88 at 1 year in 406 patients, and a score of 94 in 216 patients more than 1 year out. These results are the same as reported here for liver transplant patients. Evans et al 13 evaluated the Karnofsky score after heart transplantation in 441 patients and after kidney transplantation in 144 patients. Heart recipients had a Karnofsky score of approximately 85 and kidney recipients 80. Gross et al 14 demonstrated an improvement in Karnofsky score in 54 lung recipients compared with 44 patients awaiting lung transplantation. Jofre et al 15 reported Karnofsky scores in 88 patients with functioning renal allografts before and after transplantation; the score improved from a mean of 66 to 88.
The SF-36 has been widely used in a range of medical conditions, with demonstrated reliability and validity, and there are several excellent reports on one or more types of transplant patients. Painter et al 16 described the level of health-related fitness and QOL in 128 organ transplant recipients who participated in the 1996 U.S. Transplant Games. The sample was obviously highly selected and dominated by kidney recipients (n = 76), but their results showed the potential level of functioning for some patients after transplantation. Scores on the SF-36 were nearly normal for those ages 40 to 50 years. Not surprisingly, the SF-36 scores in all eight domains were significantly higher than those in our patients. A main point was that patients who exercised three or more times per week for 20 minutes or more had a higher peak oxygen uptake and a lower percentage of body fat, and scored higher in most domains of the SF-36.
In 1996, Littlefield et al 17 reported on the administration of several instruments to 55 heart, 149 liver, and 59 lung recipients. They showed that the SF-36 improved the most for lung recipients. They could not find an effect of time after transplantation on any of their measures. We suspect this is based on the way their sample was time-stratified, missing the time effect we have shown that centers on the first year. As in our analysis, age was a limited contributor to outcome in the short term.
Whiting et al 18 published SF-36 data before and after liver transplantation for 84 patients and after kidney transplantation for 141 patients. They showed improvement in most scales, with the exception of bodily pain. They, too, showed significant deficiencies compared with the normal population in the physical scales but not the mental health scale. Their reported pretransplant and posttransplant scale scores were remarkably close to ours for liver and kidney patients.
Bravata et al 12 reported a meta-analysis of seven studies using the SF-36 in 468 liver transplant patients. They had better scores in the social and mental scales than the physical scales. The actual SF-36 scale scores were similar to those we report for liver transplant patients. Overall, they showed a significant improvement in several physical scales in 49 studies using a variety of instruments, but not psychological health.
Rector et al 19 performed a preliminary study comparing SF-36 results in 42 adults awaiting heart transplantation and 143 heart transplant recipients. There was significant improvement in the physical scales but little change in the mental scales. They also showed scores not reaching those of a comparison group of patients with only minor medical problems; all these findings are similar to ours.
The PAIS has been used to evaluate outcomes of coronary artery bypass surgery, 20 hemodialysis, 21 diabetes retinopathy, 22 cancer, 5 bone marrow transplantation, 23 and heart transplantation. 24 In these studies, pretreatment global PAIS scores ranged from 31.3 22 to 58.5, 20 and posttreatment scores ranged from 23 to 34. The posttreatment scores for our organ transplant patients similarly ranged from 24 to 31.
Walden et al 24 studied 19 heart transplant patients. The PAIS global score before surgery was approximately 54, and it improved to approximately 34 at a mean of 30 months after the transplant. We previously showed, in two studies, improvement in certain PAIS domain scale scores and the total score after liver transplantation using bivariate correlations on cross-sectional samples ranging from before to 5 years after transplantation. 10,11
In summary, we have shown that patients receiving different types of transplants start at different levels of health-related QOL, measured three different ways. Lung and heart recipients start out the worst, liver recipients in the middle, and kidney recipients the best, perhaps because of dialysis support. Health-related QOL improves after transplantation by all three measures and continues for at least 1 to 2 years. This improvement occurs most in the physical dimensions. Renal transplant recipients improve the least and retain their preoperative stratification during the first 2 postoperative years. Compared with the normal population, all these patients are much worse by every measure before surgery. Mental functioning is normal after surgery, but there is still a significant physical deficit.
Our modeling shows that education, diabetes, time after transplantation, and recent functional status influence health-related QOL. The serum creatinine level may also be an important factor. The importance of diabetes and education was noted by others. 18 This finding may explain the more limited improvement recorded in our kidney recipients compared with the others, because they had a much higher incidence of diabetes (and presumably more severe diabetes, with its end-organ damage) and elevated serum creatinine levels. Overall, these data provide clearly defined and widely useful health-related QOL benchmarks for patients undergoing different types of solid organ transplantation.
Acknowledgments
The authors thank the following for their contributions to this project: Kathy Brisendine, MSN, RN, Taylor Blair, Pat Coffey, LCSW, Stacy Davis, MD, Terri Donaldson, MSN, RN, E. Wesley Ely, MD, MPH, Andrea Goodwin, MSN, RN, Connie Harrison, MSN, RN, Jeanne Hopkins, RN, Ben Lewis, Yvonne Moneypenny, Patti Olesen, Sarah Swanson, LCSW, David H. Van Buren, MD, Denise Van Buren, LCSW, and Janie Webb, LCSW.
Discussion
Dr. Clyde F. Barker (Philadelphia, Pennsylvania): In the early 1960s, Sir Peter Medawar, a great transplantation biologist, ethicist, and philosopher, was asked whether it was ethical to treat renal failure patients with kidney transplants. At that time, dialysis was not available to most kidney patients. Medawar’s answer was, “That’s very simple. People would rather live than die.”
However, times have changed. Not only are the results of transplantation better, but there are alternative therapies for some organ transplants which will maintain life. Thus, the question is more difficult to answer. The sort of study that we have just heard will help us.
It certainly behooves us to balance the tremendous cost of transplantation versus the benefits. And the benefits include now not only life itself, but the quality of life. And we need to convince both ourselves and the payers that transplantation is preferable to the alternatives. This is especially important in transplants of nonlifesaving organs, namely the kidney and the pancreas. It is important that we be certain that these will improve the quality of life. Therefore, it is somewhat disappointing to me that Dr. Pinson’s study documents so little change in the quality of life of kidney recipients.
I would like to ask Dr. Pinson whether or not he has had a chance to study recipients of pancreas, another nonlifesaving type of transplant. In these patients, the improvement of quality of life might be even less. After all, many insulin-treated diabetics appear to live fairly normal lives. Some have even been well enough to excel in rigorous activities such as professional sports, so their quality of life or their perception of it might not be improved dramatically by a successful transplant, though in transplanting them we must subject them to an operation which has some risk and then requires lifelong immunosuppression.
Dr. Pinson’s methodology is complex, and although I read through his manuscript several times, I am not qualified to critique the sophisticated tools he has used. But I have several questions. First, is it fair to exclude those transplants with failed grafts who are dead and can’t be subjected to analysis by questionnaires? Did Dr. Pinson include some factor to compensate for not being able to evaluate those patients who died?
Secondly, can this very useful exercise and these tools be refined to the extent that they might be used for other purposes? For example, could they be used in organ allocation? If so, would this be ethical? This might be especially useful in comparing the outcome of the nonlifesaving transplants with nontransplant therapy. And would there potentially be other uses, such as evaluation of the results of individual transplant centers?
Finally, I noticed that there is a plateau in these trajectories representing improved quality of life over the first few years after transplantation. I wonder if after 24 months we might actually see a decrease in the quality of life as some of the organs fail or begin to fail. Have you seen any suggestion of such a trend, or do you believe that once a steady state of well-being is reached, it will be maintained?
Presenter Dr. C. Wright Pinson (Nashville, Tennessee): We have an inadequate sample to study pancreas longitudinally. But you are quite right, that would be interesting. There are several studies in the literature that address quality of life in pancreas transplants alone.
The second question that you raise is, did we include some sort of evaluation on the quality of life in patients who do not make it? We have only included the patients who survived. Patients are randomly picked; therefore, there is no reason to feel that we picked only patients with good quality of life. The only one of three tools that could be applied to nonsurviving patients would be the Karnofsky scoring, where a dead patient would receive a score of zero. If we were trying to look at the value of transplantation in a population of patients, it would be appropriate to include them. But to look at purely quality of life in surviving patients, I think the way we have handled it is appropriate.
You asked about the influence that this data might have on potential organ allocation. The Karnofsky data on stratification of patients, showing that liver and heart patients come together by 6 months, would support a willingness to take sicker patients, because it shows that no matter how bad their function is preoperatively, they all have a similar outcome after 6 months, presuming survival.
You talked about use of this data within programs. Very clearly, quality of life outcomes can be used as measures of program function just like survival, complication rates, and graft survival. I think we are just now finding out how sensitive this tool is or is not and how useful it will be for measuring outcomes of one program versus another. I think that it can be used as a management tool internally. Just like we use rejection rates to decide on which immunosuppression regimen we choose, we might use quality of life outcome to determine immunosuppressive regimen or other management choices.
The final point that you brought up was the plateau, and you are quite right—we think that our patients reach a plateau somewhere between 1 and 2 years. We are quite suspicious that there is going to be a downturn thereafter. Our data does not go out far enough in sufficient volumes for us to comment beyond the 2 to 3 years presented here. But I am suspicious that lung patients may turn down as early as 3, 4, or 5 years, that renal recipients may turn down in the 5- to 10-year period, and that liver patients may turn down somewhere around 10 years. But these are very preliminary hypotheses.
Dr. Goran B. Klintmalm (Dallas, Texas): Quality of life has become an important factor for the evaluation of medical and surgical therapies. Transplantation being recognized as expensive and very much in the public—and maybe more in the payers’—eye, we have been eager to hear a justification for the high monetary and emotional cost. Consequently, quality of life studies have been published for some time.
However, this is the first major study that compares the quality of life in the four major organs. It also compares the results to the normal population. What we still lack is a comparison between transplantation and other chronic surgical and medical therapies such as coronary artery bypass, Whipple procedures, nonsurgical disease, et cetera. Having had the opportunity to read the manuscript, I have a few questions for you.
First, and this ties back to Dr. Barker’s question, in this time of extreme donor shortage, do you think that in your findings in the manuscript, we have facts that have relevance to organ allocation? I am talking now about issues such as diabetes, such as even, if you want to bring it forward, educational level on rehabilitation?
Second, we have found that return to work after transplantation is mostly hindered by the reluctance of the employers to hire anyone with an allograft. Do you believe that we can use your data to help change this situation?
Third, the lack of improvement in quality of life following kidney transplantation: could that actually be related to the high incidence of diabetes, which in this particular population is an end-organ disease, in contrast to liver or lung patients where this is only a complicating but not morbidity-imposing disease?
Finally, at Baylor we find that liver recipients are far more likely to return to work after transplantation than kidney recipients. Can your data help us understand why?
Dr. Pinson: It is true there is a body of literature about quality of life after transplantation and that this study’s value is in its comparison between the four different groups using the same tools.
The idea of comparing the results here to other populations besides “normal” is attractive. We are going to leave that work for reports on each of the individual types of transplants. We will report them versus an appropriate population, such as the heart transplant patients versus a group of patients who have heart failure that is well managed and a group of patients undergoing coronary bypass.
The perception of employers is a significant problem in getting patients back to work. I think this paper does help; this particular study helps to demonstrate the capabilities that patients have after transplantation and that they return to a very high level of functioning.
Diabetes, elevated creatinine, and limited education by path analysis negatively influence quality of life after transplantation. Whether you can extend these findings to say that one should change our indications at this time, I doubt. The diabetes in renal recipients is more severe with more end-organ damages than the other recipients, and thus you are probably correct in saying this may limit the posttransplantation improvement in renal recipients. This may influence return to work.
Dr. Francis D. Moore, Sr. (Boston, Massachusetts): First, it is interesting that the liver comes out so well—“who’d ’a thunk it?” In a study we presented at this meeting about 4 years ago, the late survival curves of liver transplants showed an absolutely flat survival curve. In infants operated on for biliary atresia, 100% of those livers were still working well many years later! Contrast that with the fate of the transplanted kidney. Possibly we should pay more attention to chronic organ loss in the kidney. This has sometimes been called “chronic rejection.” However, it may not be a chronic rejection, but a new form of “autoimmunity.”
Of all the commonly transplanted organs, the disordered kidney most frequently suffers from an autoimmune disease. A large fraction of kidney transplants are done for chronic glomerulonephritis, the origin of which may, in some cases, be autoimmune. Consider for a moment late deaths in the identical twin kidney transplants! This is very important proof: they die of the same disease in their transplanted kidney that they had in the original kidney. Does the same apply to late organ loss in allotransplants?
A better understanding of the pathogenesis of glomerulonephritis is going to be essential to achieving late survival of kidney transplants. A national collaborative study done by members of this association on late organ loss in all forms of organ transplantation is an urgent agenda for our next few years. I wonder if such a national study could be initiated by fellows of this Association. We need the basic data on late organ loss over a very large cohort of cases in order to categorize the phenomenology. Are transplants done for autoimmune disease (kidney, liver, heart, lungs, pancreas) more subject to late organ loss? Is this “rejection” or “autoimmunity”? Can we differentiate the two by the study of microchimerism, as suggested by some of Thomas Starzl’s data?
Dr. Pinson: With the excellent early graft survivals that we are achieving, the importance of studying causes of late graft loss will increase.
Footnotes
Correspondence: C. Wright Pinson, MD, MBA, Vanderbilt University Transplant Center, 801 Oxford House, Nashville, TN 37232-4753.
Presented at the 120th Annual Meeting of the American Surgical Association, April 6–8, 2000, The Marriott Hotel, Philadelphia, Pennsylvania.
Supported in part by a grant from Roche Laboratories, Inc.
E-mail: Wright.Pinson@mcmail.Vanderbilt.edu
Accepted for publication April 2000.
References
- 1.Testa MA, Simonson DC. Assessment of quality-of-life outcomes. N Engl J Med 1996; 334: 835–840. [DOI] [PubMed] [Google Scholar]
- 2.Karnofsky DA, Abelmann WH, Craver LF, et al. The use of the nitrogen mustards in the palliative treatment of carcinoma. Cancer 1948; 1: 634–656. [Google Scholar]
- 3.Grieco A, Long C. Investigation of the Karnofsky Performance Status is a measure of quality of life. Health Psychol 1984; 3: 129–142. [DOI] [PubMed] [Google Scholar]
- 4.Ware JE, Jr. SF-36 Health survey: manual and interpretation guide. Boston: The Health Institute, New England Medical Center; 1997.
- 5.Derogatis LR. The psychosocial adjustment of illness scale (PAIS). J Psychometric Res 1986; 30: 77–91. [DOI] [PubMed] [Google Scholar]
- 6.Derogatis LR, Derogatis MF. PAIS & PAIS-SR: administration, scoring & procedures manual, II. Towson, MD: Clinical Psychometric Research, Inc.; 1990.
- 7.Gorsuch RL. Factor Analysis. 2nd ed. London: Lawrence Erlbaum; 1983.
- 8.1996 OPTN/SR AR 1988–1995. United Network for Organ Sharing; DOT/HRSA/DHHS.
- 9.Cohen G. Statistical Power Analysis for the Behavioral Sciences. 2nd ed. 2nd ed. Hillsdale, NJ: Lawrence Erlbaum; 1988.
- 10.Payne JL, McCarty KR, Drougas MD, et al. Outcomes analysis for 50 liver transplant recipients: the Vanderbilt experience. Am Surg 1996; 62: 320–325. [PubMed] [Google Scholar]
- 11.Geevarghese SK, Bradley A, Wright JK, et al. Outcomes analysis in 100 liver transplantation patients. Am J Surg 1998; 175: 348–353. [DOI] [PubMed] [Google Scholar]
- 12.Bravata DM, Olkin I, Barnato AE, et al. Health-related quality of life after liver transplantation: a meta-analysis. Liver Transplant Surg 1999; 5: 318–331. [DOI] [PubMed] [Google Scholar]
- 13.Evans RW, Manninen DL, Maier A, et al. The quality of life of kidney and heart transplant recipients. Transplant Proc 1985; 62: 1579–1582. [Google Scholar]
- 14.Gross CR, Savik K, Bohman RM, Hertz MI. Long-term health status and quality of life outcomes of lung transplant recipients. Chest 1995; 108: 1587–1593. [DOI] [PubMed] [Google Scholar]
- 15.Jofre R, Lopez-Gomez JM, Moreno F, et al. Changes in quality of life after renal transplantation. Am J Kidney Dis 1998; 32: 93–100. [DOI] [PubMed] [Google Scholar]
- 16.Painter PL, Luetkemeier MJ, Moore GE, et al. Health-related fitness and quality of life in organ transplant recipients. Transplant 1997; 64: 1795–1800. [DOI] [PubMed] [Google Scholar]
- 17.Littlefield C, Abbey S, Fiducia D, et al. Quality of life following transplantation of the heart, liver, and lungs. Gen Hosp Psych 1996; 18: 36S–47S. [DOI] [PubMed] [Google Scholar]
- 18.Whiting JF, Nabel J, Gross P, et al. Clinical determinants of health-related quality of life in recipients of solid organ transplants. J Surg Outcomes 1999; 2: 21–26. [Google Scholar]
- 19.Rector TS, Ormaza SM, Kubo SH. Health status of heart transplant recipients versus patients awaiting heart transplantation: a preliminary evaluation of the SF-36 questionnaire. J Heart Lung Transpl 1993; 12: 983–960. [PubMed] [Google Scholar]
- 20.Langeluddecke P, Baird D, Hughes C, et al. A perspective evaluation of the psychosocial effects of coronary artery bypass surgery. J Psychosom Res 1989; 33: 37–45. [DOI] [PubMed] [Google Scholar]
- 21.DeNour AK. Psychosocial adjustment to illness scale (PAIS): a study of chronic hemodialysis patients. J Psychosom Res 1982; 26: 11–22. [DOI] [PubMed] [Google Scholar]
- 22.Wulsin LR, Jacobson AM, Rand LI. Psychosocial adjustment to advanced proliferative diabetic retinopathy. Diabetes Care 1993; 16: 1061–1066. [DOI] [PubMed] [Google Scholar]
- 23.Jenkins PL, Lester H, Alexander J, Whittaker J. A prospective study of psychosocial morbidity in adult bone marrow transplant recipients. Psychosomatics 1994; 35: 361–367. [DOI] [PubMed] [Google Scholar]
- 24.Walden JA, Stevenson LW, Dracup K, et al. Extended comparison of quality of life between stable heart failure patients and heart transplant recipients. J Heart Lung Transpl 1994; 13: 1109–1118. [PubMed] [Google Scholar]