

Abstract
Rationale and Objectives: We seek to establish lung imaging methods which provide for the ability to image the lung under dynamic, non-breath hold conditions while providing “virtual breath hold,” quantifiable volumetric image data sets. We use static, breath hold images as the gold standard for evaluating these virtual breath hold images in both a phantom and sheep.
Materials and Methods: We have developed axial methods for gating image acquisition to multiple points in the respiratory cycle interleaved with incremental table stepping during multidetector-row CT (MDCT) scanning. Datasets are generated over multiple breaths, providing volume images representative of multiple points within a respiratory cycle. To determine the reproducibility and accuracy of the methods , 6 anesthetized sheep were studied by MDCT in non-gated and airway-pressure (Pawy)-gated modes where Pawy was 0, 7 and 15 cmH2O.
Results: No significant differences were found between the coefficient of variation in air volume measured from repeated static scans (1.74±1.78%), gated scans: Inspiratory gated (1.2±0.44%) or expiratory-gated (1.39±0.98%), or between static (1.74±1.78%) and gated (1.39+/-0.98%) scanning at similar Pawy (p>0.1). Measured air volumes were larger from static vs. gated scans by 5.85±3.77% at 7cmH2O and 4.45±3.6% at 15cmHL2O Pawy (p<0.05) consistent with hysteresis. Differences between air volumes at 7 and 15 cmH2O measured from either static or gated scans or that delivered by a supersyringe were insignificant (p<0.05). Visual accuracy of 3D anatomic geometry was achieved, and landmark certainty was within 1mm across respiratory cycles.
Conclusion: A method has been demonstrated which provides for accurate gating to respiratory signals during axial scanning. High resolution volumetric image datasets are achievable while the scanned subject is breathing.Images are quantitatively similar to breath hold images with differences likely explained by known P-V hysteresis effects.
Keywords: quantitative imaging, pulmonary imaging, MDCT, dynamic imaging, respiratory gating
Introduction
The lung is inherently a dynamic system whereby airway and vascular dimensions and regional distributions of blood volume change as a function of over-all lung volume. Similarly, regional lung densities change with lung volume, reflecting regional changes in alveolar expansion which in turn reflect regional ventilation. Furthermore, there are structural and functional alterations which occur in the lung only during dynamic states such as pendelluft [1,2], dynamic airway compression [3], etc. As we ultimately seek to establish x-ray CT as a comprehensive tool for studying both structure and function of the lung, it is important to establish tools and scanning protocols whereby we can standardize the imaging of the lung at specific lung volumes under both dynamic as well as static conditions. CT imaging of the lung is becoming the method of choice for studying the function and structure of the lung. Current multidetector-row computed tomography (MDCT) provides the ability of acquiring up to 64 thin sections with scanner rotation speeds on the order of 0.33sec per revolution. Operated in a spiral mode, these scanners can acquire images of the lung in a breath hold of as short as 5-10 seconds. Early studies have used static [4-6] methods of imaging the lung at well controlled volumes to evaluate regional lung density patterns, while others have used respiratory gated imaging to assess regional ventilation [7,8]. Using a gas that is more radio-dense than air such as xenon, changes in regional lung densities with washin or washout of gas at a fixed lung volume are measured imaging the lung at specific points in the respiratory cycle and at a fixed anatomic location using prospective gating. Alternative dynamic imaging methods [9,10] have been used to demonstrate large scale regional emptying differences under forced expiratory maneuvers. The latter method has significant limitations due to the fact that, when scanning the lung axially during a forced expiratory maneuver, the lung moves through the scanned region. Thus, one does not actually assess a fixed anatomic region. In the method presented here, referred to as “dynamic imaging”, we image the lung at fixed lung volumes during dynamic respiratory processes. Thus, our method captures a virtual breath hold volumetric image which reflects anatomic features unique to dynamic processes.
More recently it has been shown that, if a physiologic event, such as the heart beat, is repeatable then there are retrospective gating methods[11,12] that can be used in conjunction with spiral scanning which allow for the reconstruction of the organ of interest at various points within a representative physiological cycle. Retrospective imaging as applied to the lungs can add considerably to the radiation dose given to the subject. While this dose can be significantly reduced by low dose scanning methods, another alternative for to retrospective gating methods which use spiral scanning is an axial mode of scanning (stepping the table between scan acquisitions) with prospective gating only to those specific points in the respiratory cycle which are of interest. This in turn can be coupled with low dose imaging methods to allow for significant reductions in radiation dose compared with retrospective imaging methods used in conjunction with spiral scanning. The accuracy of static lung volume measurement using CT has been tested previously [4,5]. In this paper, we focus on the comparisons between static vs. virtual breath hold imaging in which the virtual breath hold reflects dynamic processes in the lung. In this paper, we present a series of studies performed using an early 4 slice version of an MDCT scanner to evaluate our ability to accurately acquire volumetric lung images at multiple lung inflation steps in both a dynamic and a static mode of imaging. We compare and contrast these methods in terms of measurements of regional lung density, lung volumes, and localization of anatomical land marks.
Methods
Phantom Study
A phantom was constructed to test the feasibility of dynamic volumetric scanning using an MDCT scanner (4 slice MX8000, Picker International) with sub-second rotation times. The phantom consisted of a hollow plexiglass cylinder equipped with a plexiglass connector which allowed a balloon to be attached on the inside of the cylinder and a means by which the balloon could be volume cycled by use of a standard piston ventilator. The system is shown in Figure 1A. 1-1.5 millimeter diameter zirconium beads (beads were not perfectly round) were glued to the surface of the balloon and placed in circles around the circumference of the balloon and along its sides as shown in Figure 1B. Recoil pressure was established by loosely wrapping a rubber band around the balloon with the balloon situated between flat plexiglass strips that were in turn attached to the center of one end of the cylinder. The plexiglass strips also served to keep the balloon within the center of the cylinder and provided a means whereby, if the balloon was cycled within a predetermined volume range, the balloon remained taut, and the balloon position across cycles was repeatable. A minimum inflation pressure was maintained using a controllable resistor (clamp) on the expiratory port of the ventilator to create increased expiratory flow resistance to keep the balloon inflated at all times. The ventilator rate was set to 17 breaths per minute (bpm), a 1:1 I:E ratio and a tidal volume of 250 ml was used.
Figure 1.

The balloon phantom for evaluating dynamic axial scanning: (A) the complete setup with the ventilator as it was situated in the scanner, and (B) close up of the balloon phantom along with the 1-1.5mm diameter zirconium beads placed on the balloon surface to study the motion-induced blurring.
An electronic timing device with a zero crossing detector functioned as the trigger controller for the scanner. Scan parameters were: 120 kV, 100 mAs, 0.33 sec scan time (half scan). Using the half-scan mode, we were able to scan, step the table and initiate a second scan in0.53 seconds. With each scan, four slices were acquired at a fixed point in the respiratory cycle (end of inspiration (EI)) and the patient table was advanced half the distance covered by the 4 slice scan and a second scan was acquired at a second point (end expiration (EE)) in the respiratory cycle until the balloon was completely covered. The scan sequence is schematically shown in Figure 2. For estimation of the blurring due to motion, the dynamic studies were compared to static scans. The balloon was inflated and maintained at an opening pressure equivalent to the end inspiration mid-scan value in the dynamic case, and the table was stepped to cover the full extent of the balloon.
Figure 2.

Schematic showing the triggering logic for dynamic volumetric MDCT. In this case, 2 triggers per respiratory cycle are generated and 4 slices are acquired per rotation. The table is incremented by the combined thickness of two of the four slices between each scan trigger. Thus, contiguous axial images are acquired over the full z-axis extent of the structure of interest at both end inspiration (EI) and at the beginning of inspiration (BI).
Qualitative verification included visualization of the balloon images using multi-planar reformations (MPR) and verifying the contiguity of the slices in the volumetric image whereby every four slices the same point in the inflation-deflation cycle across many cycles. In addition, volume rendering was used to evaluate the smoothness of the reconstructed surface.
Quantitatively, the markers’ size was estimated from images acquired in the static and prospectively gated modes and the additional blurring (change in measured marker size) caused as a result of motion was evaluated. Marker size was estimated using the full width half maximum (FWHM) method. The means of the estimated size of the markers, acquired from static and gated images, were compared with the paired t-test for statistical significance set at p ≤ 0.05.
The Animal Model
Six male sheep, 32-41 kg, were initially anesthetized with isoflurane, 2-4% during catheter insertions and then maintained on Sodium Pentobarbital (30 mg/kg with 1.5-2.5mg/kg hourly). Respiration was maintained via mechanical ventilation. The protocol was approved by the University of Iowa Institutional Animal Care and Use Committee (IACUC). Catheters were placed in the superior vena cava and aortic root for drug delivery and pressure monitoring respectively via a midline incision in the neck. After a tracheotomy, an endotracheal tube was tightly tied in place via use of umbilical tape so as to allow for careful control of lung volumes without air leak around the tracheal tube. ECG was monitored via extremity leads. Between scans, sheep were ventilated with Vt = 10 ml/kg, end expiratory pressure (PEEP) = 2 cmH2O, peak inspiratory pressure = 20 cmH2O and a breathing rate of 20 bpm (PB760 ventilator, Mallinckrodt - Puritan Bennett, Hazelwood, MO). The animals were studied in the prone position to minimize the effects of atelectasis over the duration of the study. The lungs of the sheep were scanned via a 4 slice MX8000 MDCT scanner (Picker International, Cleveland, Ohio) using both axial and spiral scanning modes. For spiral scans, the lungs were held statically inflated by setting airway pressure (Pawy) to a constant value using an under-water bubbler system, and for axial scans the scanner was activated at each breath using custom software programmed to send trigger signals at fixed points of the respiratory cycle.
The CT Scanning Protocol
The following scanning parameters were common to all scanning protocols and independent of animal size: 120kV, 90mAs, half scan reconstructions, 0.5sec gantry rotation, 512x512 image matrix, 4 slices per acquisition and a standard reconstruction kernel. The specific scan parameters differed based on the mode of scanning (axial or spiral) and type of lung volume (static or dynamic). Spiral scans used a pitch of 1.25, an effective slice thickness of 1.3mm and a slice spacing of 0.65mm. Axial scans, when used for static volume imaging, utilized a slice thickness of 2.5mm, a slice spacing of 2.5mm and a table step of 10mm. However, axial scans for dynamic lung volume imaging were obtained with 2.5mm slice thickness, 2.5mm slice spacing and either 0 or 5mm (width of two slices in a 4 slice scan) table stepping depending on the specific goal as explained below. In both cases, the images were reconstructed with the standard reconstruction kernel.
Experimental Protocol
Three protocols were used that evaluate the accuracy and repeatability of both dynamic and static lung volume measurements and the viability of dynamic volumetric lung imaging as compared to static volumetric lung imaging. These protocols were: repeatability of static imaging, repeatability of dynamic imaging, and a comparison of quantitative measures obtained from static vs. dynamic imaging. Lung segmentation, lung air and tissue volume measures and the histogram analysis were determined using the Iowa Pulmonary Analysis Software Suite (PASS) including the segmentation method devised by Shi et al. [13]. Airway dimensions and motion blurring were measured using a Matlab (The Mathworks Inc., Natick MA) program written for this purpose.
Static Imaging
Data Collection
Sheep were temporarily paralyzed with 2-3 ml of 1mg/ml Pancuronium Bromide before each scan to prevent spontaneous breathing during breath hold. After the end of a recruitment maneuver (three breaths during which the lungs were inflated to peak Pawy of 25cm H2O) the lungs, on expiration, were held at an inflation level equivalent to Pawy = 15 cm H2O using a continuous-flow water bubbler while monitoring Pawy, End-Tidal CO2, and ECG. When the lung was at a targeted inflation level, the scanning commenced in spiral mode to collect datasets covering the full apical-to-basal extent of the lung. After scan completion, the ventilator was reconnected for at least 5-10 minutes to allow the animal to recover from the breath hold maneuver. After the recovery period, the procedure was repeated for a total of five times for each sheep.
Data Analysis
Lungs from each of five volumetric images per animal were automatically segmented. Because some of the sheep had mild to moderate inflammatory processes entering the study (which we have found to be common) manual adjustments to the segmentation were required in some cases where dependent consolidation juxtaposed with the chest wall and to maintain consistency in including/excluding blood vessels and airways across datasets. We compared, for each sheep, air, tissue and total volumes and histogram parameters calculated from the segmented lung images. Lung volume was determined by multiplying the total number of pixels in the segmented region by the dimensions of each pixel. Air and tissue volumes were estimated from the total volume assuming a linear combination of tissue and air densities with pure air represented with a grayscale of –1000 and pure water, representing tissue, with a grayscale of zero [4,5]. In addition, first through fourth order statistical estimates are used to describe the calculated histogram. Repeatability is reported as the mean and standard deviation of the coefficient of variation for all the animals for all the parameters.
Dynamic Imaging
Data Collection
While ventilating the animal, repeatability of dynamic imaging was tested by gating the scanner at two inflation levels per breathing cycle, near the beginning (BI) and at the end (EI) of inspiration, over 10 consecutive breaths. Pawy corresponding to these trigger levels were 7 and 15 cmH2O respectively. This was done at three anatomic locations: apex, carina and base levels. Four contiguous slices were acquired for each trigger. Note also that these dynamic images were acquired such that the targeted mouth pressure occurred in the middle of the each slice acquisition to minimize the difference between dynamic and static scans. To test repeatability of the dynamic imaging we chose to scan at only fixed anatomic locations rather than acquire a full volumetric data set multiple times. This allowed us to have time for the repeated measures at the restricted locations and still have time for the remainder of the study without risking a change in the physiologic status of the animal during the course of the study. We did gather a full volumetric image dynamically and statically at two inflation pressures for comparison of the two techniques as described in the section titled “Dynamic vs. Static Imaging” below.
Data Analysis
After separating the BI and EI image sets, each set of four slices per breath per animal was automatically segmented and manual verification was performed to assure data consistency. The repeatability of lung volume measurement across the 10 breaths at BI or EI for the three anatomic levels was calculated with a coefficient of variation. Similarity between measured air volumes was compared between the two inflation levels. Finally, the repeatability of lung air volume measurements obtained for the five static scans (15cmH2O Pawy) obtained in the previous section were compared with only the EI dynamic scans (15 cmH2O Pawy) by averaging the coefficient of variations obtained for the EI dynamic scans at all three anatomic levels. Statistical significance was measured using a two-tailed paired t-test with p ≤ 0.05 considered significant. Repeatability of anatomic landmark locations between breaths for EI scans were also measured and reported as mean and standard deviation in pixels in x, y directions and in millimeters in the z direction (in and out of image plane). Anatomic landmarks (airway and blood vessel branching points) were selected such that they could be verified within the 4 slices at each breath.
Dynamic vs. Static Imaging
Data Collection
For this segment of the study, each sheep was scanned 5 times. The first scan was acquired at functional residual capacity (FRC: 0cmH2O Pawy) in a spiral scanning mode. The sheep was then scanned dynamically (gated axial mode) at a Pawy of 7 and 15 cmH2O separately. Lastly, using a graduated super syringe, sheep lungs were inflated to Pawy of 25 cmH2O and on deflation held at Pawy of 7 or 15 cmH2O. While maintaining the lung inflation level with a stopcock, the lungs were scanned in axial mode.
Data Analysis
As in the previous protocols, all images were automatically segmented and manually verified. From the segmented images, lung tissue and air volume measurements were recorded as well as lung voxel histogram parameters. The accuracy of lung volume measurements using a breath hold was tested. The difference in measured volume from static images between the FRC scan and both the 7 and 15cmH2O Pawy scans were compared to the volume needed to inflate the lungs from FRC to the respective airway pressures using a super syringe (BTPS-adjusted) as shown in Equation 1,
where x is either 7 or 15 cmH2O. In addition, lung air volume measurement was compared between the 7 and 15 cmH2O static and dynamic scans. For verification of the segmentation and measurement methods, reproducibility of lung tissue measurements from all the scans were also compared with the notion that tissue cannot be lost or gained (except for small shifts in blood volumes with changes in Pawy). Statistical significance was determined using a single factor ANOVA test (Microsoft Excel, Redmond, WA) with p ≤ 0.05 for significance across all images acquired at different lung volumes and with different imaging methods. Due to motion during the non-breath hold dynamic scans and the finite scan time, airway edges become more blurred than the usual blurring caused by the finite scanner point spread function. Quantitatively, the effect of dynamic scanning was measured as the change, if any, in airway dimensions when measured on corresponding static and dynamic images using FWHM method. Measured airways were randomly selected yet matched in both static and dynamic images. The results for the apex, carina, base and total lung regions were compared using paired t-test with a significance level of p ≤ 0.05.
Results
Phantom Studies
Given the ventilator and scanner parameters, the goal of being able to volumetrically and dynamically image a moving object was realized. Figure 3 shows a surface rendering of the balloon images using the scanner software. Visually, the rendered surfaces at two inflation pressures were displayed simultaneously and were found to be smooth, demonstrating that each four consecutive slices from successive cycles lined up well with the neighboring four slices. This indicated that the inflation, monitoring and triggering mechanisms were repeatable and implemented appropriately.
Figure 3.
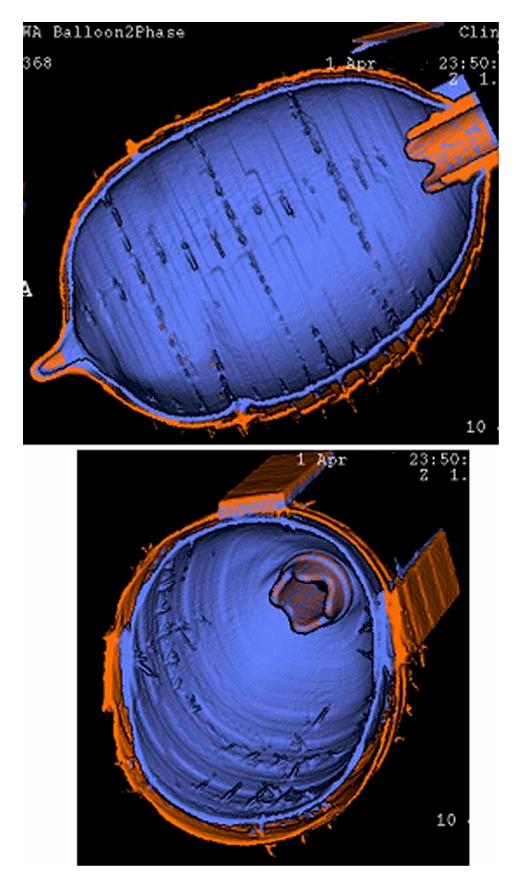
Surface rendered images of the balloon phantom acquired with MDCT at 2 different trigger values of the balloon inflation cycle with each volume represented as a different color (blue vs. orange) surface. Every four slices used to make up the axial extent of the balloon volume were acquired at a different balloon inflation cycle. Note that, while each balloon cycle shows up as rings in the shaded surface display, the balloon edges were remarkable well aligned.
Quantitatively, the blurring of the beads had a mean measured size (± standard deviation) in the static and prospectively gated cases of 2.39±0.39mm and 2.8±0.47mm respectively. This demonstrates a 17% blurring due to motion associated with the gated imaging protocol. The differences in measured diameters were found to be statistically significant using the paired t-test with p<0.05.
Animal Studies
Visual Assessment of Derived Volumetric Data:
Figure 3 and Figure 7 show a visual verification of the smoothness of the reconstructed coronal and sagittal views of the separated images of the balloon and of the sheep lungs, respectively. Figure 7 shows mid sagittal (lower row) and coronal (upper row) images from volumetric data sets obtained via the dynamic imaging protocol with the animal scanned at 7 (left column) and 15 (right column) cmH2O Pawy. These are thickened slabs displayed using a maximum intensity projection method with the maximum intensity adjusted for the depth of the brightest voxel within the slice. These slabs are 9mm thick. Of note is the fact that every 4 rows of voxels within these images (top to bottom of the image) come from different respiratory cycles. Note the strikingly accurate alignment of all anatomic structures. If a single four slice gated acquisition were to have been acquired at variable points in the respiratory cycle relative to prior or subsequent gates, or if the respiratory cycles were not repeatable, slice geometry from one acquisition to the next would not smoothly fit together and would be apparent when selecting a slice out of the volume in the coronal or sagittal orientation, or when displaying the segmented lung volume in a shaded surface format.
Figure 7.

Thickened coronal (upper row) and sagittal (lower row) sections selected from volumetric images obtained using the dynamic imaging protocol with gating at 7 (left) and 15 (right) cmH2O Pawy. Thickened slab views are generated using a maximum intensity projection method with an adjustment of individual pixel brightness based upon the depth of the brightest voxel along a given projection path (depth-weighted maximum intensity projections). The slab thickness shown here was 9mm. Of note here is the fact that each four lines in the coronal or sagittal images come from transverse images obtained across different breaths. Note that all of the anatomic features appear un-broken, demonstrating the high degree of repeatability of imaging and physiologic control across respiratory cycles.
Static Imaging
Table 1 shows repeatability results of static scanning represented by the coefficient of variation (CV) of measurement parameters. The values reported are averages of 6 sheep. For each sheep the averages are of 5 independent readings of the respective parameter. The mean breath hold length across all animals for such scans was 35.0 ± 1.59 sec. The table shows that the parameters are very repeatable for volume measurement and first order statistics of the histogram. CV for Second and higher order statistics are slightly larger. These higher order measures are likely more sensitive to small changes in true physiology occurring between the 5 scans.
Table 1.
Histogram measures repeatability of images acquired in the static mode.
| Parameter | CV%§ |
|---|---|
| Volume Parameters | |
| Air Volume | 1.74 ± 1.78% |
| Tissue Volume | 1.00 ± 0.40% |
| Total Volume | 1.21 ± 1.27% |
| Histogram Parameters | |
| Mean | 0.62 ± 0.53% |
| Median | 0.48 ± 0.39% |
| Variance | 2.45 ± 1.94% |
| Std Deviation | 1.22 ± 0.97% |
| Avg Deviation | 2.14 ± 2.00% |
| Skewness | 3.16 ± 3.86% |
| Kurtosis | 7.43 ± 9.15% |
| FWHM | 3.01 ± 3.00% |
The CV values are reported as percent (average ± standard deviation) of the respective parameter for N = 6.
Dynamic Imaging
Density-based measures: Table 2 shows the repeatability represented as the CV of measurement parameters for scans at both BI and EI and across all anatomic levels. The reported values are the means of results for 6 sheep with the exception of the skewness in the apex at the BI scan where the number is from 5 sheep. The excluded dataset was for an animal with a collapsed upper lobe due to blockage of the accessory bronchus by the endotracheal tube. Similar to the static images, air and tissue volume measurements are very repeatable with higher order parameters showing slightly larger variability. Although it is to be expected that air volumes measured from BI and EI scans are significantly different, however, the difference in mean air volume repeatability across all anatomical levels was found to be statistically insignificant (p = 0.635) at BI (1.2 ± 0.44%) and EI (1.39 ± 0.98%).
Table 2.
Histogram measures repeatability of images acquired in the dynamic mode.
| CV of BI scans (%)§ |
CV of EI scans (%)§ |
|||||
|---|---|---|---|---|---|---|
| Parameter | Apex | Carina | Base | Apex | Carina | Base |
| Volume Parameters | ||||||
| Air Volume | 1.6 ± 0.7 | 1.1 ±0.9 | 90.9 ± 0.6 | 2.0 ± 2.6 | 1.5 ± 2.4 | 0.6 ± 0.6 |
| Tissue Volume | 1.2 ± 0.5 | 1.9 ± 0.9 | 0.4 ± 0.2 | 2.2 ± 2.1 | 2.4 ± 2.8 | 0.6 ± 0.2 |
| Total Volume | 1.3 ± 0.6 | 1.3 ± 0.9 | 0.6 ± 0.4 | 2.0 ± 2.5 | 1.7 ± 2.5 | 0.5 ± 0.4 |
| Histogram Parameters | ||||||
| Mean | 0.5 ± 0.1 | 0.4 ± 0.2 | 0.4 ± 0.3 | 0.3 ± 0.1 | 0.4 ± 0.3 | 0.3 ± 0.2 |
| Median | 0.3 ± 0.1 | 0.3 ± 0.1 | 0.4 ± 0.3 | 0.3 ± 0.1 | 0.2 ± 0.1 | 0.3 ± 0.2 |
| Variance | 5.3 ± 3.6 | 3.1 ± 1.9 | 1.7 ± 1.7 | 4.6 ± 2.5 | 4.4 ± 2.4 | 1.5 ± 1.1 |
| Std Deviation | 3.8 ± 4.1 | 1.6 ± 1.0 | 0.9 ± 0.8 | 2.3 ± 1.2 | 2.2 ± 1.1 | 0.7 ± 0.6 |
| Avg Deviation | 2.3 ± 1.2 | 1.6 ± 0.7 | 1.0 ± 0.7 | 2.1 ± 0.7 | 2.2 ± 1.4 | 0.9 ± 0.6 |
| Skewness | 7.9 ± 5.8 | 4.3 ± 4.0 | 1.4 ± 0.7 | 5.4 ± 3.7 | 2.4 ± 1.4 | 1.0 ± 0.2 |
| Kurtosis | 7.2 ± 3.7 | 3.7 ± 1.3 | 2.7 ± 1.5 | 5.3 ± 1.7 | 5.1 ± 2.6 | 1.8 ± 0.5 |
| FWHM | 4.8 ± 2.0 | 4.7 ± 2.8 | 3.3 ± 2.1 | 5.5 ± 1.8 | 5.1 ± 3.7 | 3.6 ± 1.7 |
The CV values are reported as percent average (standard ± deviation) of the respective parameter for N = 6.
Boldednumbers are for N = 5. In this case, 1 measurement was completely out of range due to endotracheal tube problem (see text).
Anatomic-based measures: Results in Table 3 shows the repeatability of localizing anatomic landmarks at EI within the three levels scanned. In the carina and basal regions, 10 landmarks were compared for each sheep over the 10 breaths for each of the two regions. In the apical region, in three out of the 6 sheep, only 9 landmarks could be reliably identified across all 10 breaths 10 were found in the remaining 3 sheep. In-plane, the anatomic landmarks were within less than two pixels (a pixel was 0.44-0.5mm, dependent upon the reconstructed field of view) while in the z-direction it was within half the 2.5mm slice thickness.
Table 3.
Anatomic landmark localization repeatability at EI scans from dynamic scans.
| Region | (x, y) (mean ± SD) in pixels | z¤ |
|---|---|---|
| Apex | (1.78±0.61, 2.35±0.63) | within 1.25mm |
| Carina | (1.52±0.22, 1.92±0.46) | within 1.25mm |
| Base | (1.33±0.41, 1.93±0.54) | within 1.25mm |
This value is in mm since it is in terms of slice thickness (2.5 mm)
Static vs. Dynamic
Figure 4 shows the mean air volume measured from images acquired in axial mode using both static and dynamic protocols and acquired at 7 and 15 cmH2O airway pressure. The results show that air volumes measured from static and dynamic scans were significantly different (p = 0.006 for 7 cmH2O and p = 0.017 for 15 cmH2O, N = 6). The air volumes measured via static scans were always higher than those measured under dynamic conditions. These mean differences were 87.7ml and 79.5ml at Pawy of 7cmH2O and 15cmH2O respectively. As a percentage of the mean measured air volume, the difference was 5.85 ± 3.77 % (mean ± SD) and 4.45 ± 3.60% respectively.
Figure 4.

Difference in image-based lung air volume assessed at either 7 or 15cmH2O Pawy under static vs. dynamic conditions. Similar symbols serve to designate individual animals studied under this protocol. Mean values at each airway pressure for each condition are shown as stars. At both 7 and 15 cmH2O airway pressures the lung air content was significantly less under the dynamic vs. static scanning condition.
As discussed in Equation 1 above, we evaluated the amount of air, via a supersyringe, needed to bring the lung to either 7 or 15 cmH2O Pawy and compared these values to the image-based differences between FRC images and images obtained at one of the two airway pressures. The syringe-delivered BTPS-adjusted air volume was insignificantly different (p = 0.48 for 7 cmH2O and 0.36 for 15 cmH2O) from image-based measures of air volumes for both static and dynamic conditions. However, excluding an unexplained outlier in which the syringe-based measure underestimated the image-based measures by a considerable amount; leaving 5 studies in the analysis, the differences became significant (p = 0.0096 for 7 cmH2O and 0.0035 for 15 cmH2O) with a mean difference in air volume of 93.6 ml and 137.1 ml using static images and 164.9 ml and 203.1 ml using the dynamic images for 7 and 15 cmH2O respectively with the syringe-based measures always exceeding the image-based measures. These differences correspond to 6.5 and 7.9% in the static case and 11.95 and 12.1% in the dynamic case of total air volumes respectively. In retrospect, it seems likely that there were a combination of events serving to cause the image-based measures to underestimate the syringe measures including small air leaks (differences were greater at higher static pressures) and hysteresis effects in the dynamic studies.
Figure 5 shows a comparison of the difference in measured air volume between images acquired at Pawy of 7 and 15 cmH2O and the difference in air volume delivered by the syringe to achieve the same Pawy values. There were no significant differences (p = 0.61) between any two values shown using paired t-test. While, as seen in Figure 5, there are some considerable differences between syringe-delivered volumes and image-based volumes for individual sheep, these differences were similar for both static and dynamic maneuvers in a given sheep. This indicates to us that there was likely an air leak in the one sheep where image-based difference measures were smaller than syringe-based measures such that the image-based measures were under estimating the syringe volume at the higher pressure because of an increased leak at the higher pressure. Other sources of error come from the fact that the syringe was only calibrated in 50ml increments. Depending upon how the syringe was being read, it could have been possible to read the increments inaccurately. Again, what is striking is that for a given animal, the static and dynamic measures are consistently offset from the syringe measures.
Figure 5.

Image-based air volume difference between 7 and 15 cmH2O airway pressure for dynamic (squares) and static (triangles) as compared with difference in air volume required to achieve the same airway pressures via air delivered to the lungs using a calibrated super syringe. There were no statistical differences between either imaging methods compared with the calibrated syringe-based measurements.
Figure 6 shows the correlation between measured air volume from images acquired using both the static and dynamic protocols at the same Pawy (7 and 15cmH2O). There is a highly significant correlation (p < 0.001) between the two sets of measurements (slope = 0.95; R2 =0.96). To compare repeatability of air volume measurements between static scans and dynamic scans (discussed above), we compared the static scanning repeatability (Pawy = 15cmcH2O) with the combined repeatability of the dynamic scans as assessed at the three anatomic levels for EI (Pawy= 15cmH2O). There was no statistically significant difference (p = 0.68) in the coefficient of variation of the air volume measurements obtained scanning either statically (1.74 ± 1.78%) or dynamically (1.39 ± 0.98%). Thus, while there were systematic differences in absolute air content measures when using static vs. dynamic protocols, each protocol provides highly repeatable measures.
Figure 6.

F6Correlation between measured air volumes from images acquired using static and dynamic axial imaging modes with airway pressure at the time of scanning being 7 or 15 cmH2O.
Table 4 shows the mean and standard deviation of the measured tissue volumes averaged for scans at similar Pawy across all the subjects. There was no significant difference in the measured tissue volume at any pressure or from any imaging technique (p = 0.97, dF = 4 between groups and 29 within groups). However, the measured tissue volume from FRC scans was larger than volume measured from the rest of the scans without reaching statistical significance. Tissue volume measurements were found to be reproducible, hence verifying the segmentation and measurement steps. The over all coefficient of variation (CV) was 2.36 ± 1.9% (mean ± SD) for all the scans (FRC, 2 static scans and 2 dynamic scans).
Table 4.
Tissue volume measured from different images acquired in axial scanning mode, at different airway pressures and using static and dynamic techniques.
| Method / Imaged Volume | Tissue Volume (ml)† |
|---|---|
| Static FRC | 727.60 ± 152.4 |
| Static Pawy = 7 cmH2O | 679.91 ± 114.3 |
| Static Pawy = 15 cmH2O | 687.89 ± 108.7 |
| Dynamic Pawy = 7 cmH2O | 685.87 ± 103.9 |
| Dynamic Pawy = 15 cmH2O | 687.44 ± 106.4 |
Mean and standard deviation across all subjects (N = 6)
The difference between the measurements made of matched airways taken from images acquired with the two scanning modes were found to be statistically insignificant (p > 0.1) for each region (apex, carina and base) and for the total lung region
Discussion
A new system for physiologic monitoring and triggering associated with CT scanning of the lung is presented and validated whereby the lung can be volumetrically imaged not only statically but also dynamically. The repeatability of lung volume and histogram parameters measurements from MDCT scanning using breath-hold (static) and non-breath-hold (dynamic) methods were evaluated and the results show that successful implementation of the scanning protocols. Furthermore, the measurement methods themselves were assessed through a demonstration of the repeatability of the derived metrics. Qualitative and quantitative measures of the effects of motion artifacts associated with dynamic scanning were assessed.
The new system provides capabilities that are very useful in perfusion and ventilation studies [14]. In perfusion scanning [15], one must hold lung volume fixed at a reliable level while axial scanning is triggered to a fixed point of multiple cardiac cycles. We have shown here that we are able to scan at reliably held lung volumes. On the other hand, for ventilation studies [7,8], xenon gas is re-breathed and axial scanning is gated to a fixed point in multiple respiratory cycles to allow the assessment of gas washin or washout. Again, we have shown that we are able to reliably gate the CT scanner to fixed points in a respiratory cycle. It has been of further interest to determine the effect of imaging during inspiration vs. expiration during these xenon studies [16]. The methods we present here allow one to trigger the scanner at multiple points within a respiratory cycle over multiple respiratory cycles. PhysMon (as explained in the appendix) has been shown to successfully interface to the CT scanner for such applications. This reduces wasted xenon gas and lowers the cost of such experiments and minimizes physiological differences between the scans.
Air volume measurements were found to be reproducible in both dynamic and static scanning protocols. There were no statistically significant differences between the repeatability of volume measurements using static or dynamic scanning. In the case of dynamic scanning, there were no differences in reproducibility irrespective of the trigger level or the lung volume. Therefore, one can deduce that air volume measurements can be done repeatedly regardless of the method used or the volume at which the lung is scanned. This allows the use of non-breath-hold techniques whenever a breath hold may be difficult or problematic to achieve in a given subject. For example, in some cancer patients, average breath holding times have been found to be 12-16 seconds [17] which required multiple scans in order to cover the whole lung. This becomes less problematic as scanners gain more detector rows and z-axis coverage. There is considerable interest in the amount of motion a given region of lung undergoes during tidal breathing as radiation therapy seeks to minimize the margins surrounding the target regions. [18,19]. The methods presented here can provide a gating signal for both scanning as well as treatment delivery such that the two are matched (planning and delivery). Furthermore, the dynamic sequences presented here are able to provide the range of motion a given region undergoes during respiration such that these patterns of motion can be taken into consideration during treatment planning. Furthermore, we have provided a method for tracking lung volumes at multiple points in a respiratory cycle while also providing volumetric image data sets. The problematic nature of the region of interest moving through the field of view, as associated with studies presented by Stern et al [10] and Brown et al [9] is avoided by the dynamic volumetric imaging methods presented.
Average air volume measured from the static lung volume protocol was larger than that measured from the dynamic lung volume protocol. This is not unexpected and is consistent with the hysteresis effect seen with the pressure-volume curves. Static images were acquired after a recruitment maneuver in which the lungs were inflated to 25cmH2O before they were held at 15cmH2O on expiration. In contrast, the dynamic images were acquired without additional recruitment maneuvers and on the inflation limb of the pressure-volume curve as the airway pressure reached the target value. The measured volume differences are similar to the expected differences between static and dynamic volumes commonly observed due to hysteresis in dynamic pressure-volume studies. Furthermore, and in retrospect, some of the difference could also be explained because of the lack of recruitment maneuvers prior to dynamic scanning but the presence of recruitment maneuvers prior to static scanning. Recruitment maneuvers, if they open up atelectatic regions, would be expected to yield higher lung volumes for a given airway pressure. Finally, partial volume effects associated with motion during scanning could cause some underestimation of air volume in the lung due to the smearing of tissue equivalent structures across voxels. Nevertheless, the differences were only about 5%.
The repeatability of histogram parameter measurements from static scans was very strong for all measures and particularly strong for first order parameters (mean and median). The strength of the repeatability diminished slightly with the parameter order with kurtosis being the least repeatable parameter. Kurtosis represents the sharpness of the peak of the histogram curve. This indicates that the distribution of the grayscale values is on the broader side which, in part, can be caused by differences in the inclusion or exclusion of blood vessels in the segmentation or the presences of atelectasis, fluid collection or inflammation in the segmented lung. In this regard, one of the sheep had a portion of consolidated lung. The consolidation causes the lung to have significantly higher regional CT values and therefore lessens the sharpness of the histogram curve. Excluding this case, the mean CV for kurtosis across animals drops from 7.43 ± 9.15% to 4.19 ± 5.06%. Similarly, for all other histogram parameters the mean CV becomes smaller although not to the same extent; the higher the order of the parameter the greater the change.
In the case of the dynamic protocol, the repeatability of the histogram parameters was found to be good. Repeatability was slightly less at the apical and carinal regions compared with basal regions. This could be attributable to cardiogenic variability since we did not simultaneously gate to both respiratory and cardiac events. Cardiogenic variability will be magnified by the fact that we only measured four slices at any given region in the dynamic repeatability protocol [20]. Again, as in static mode, repeatability of higher order parameters were less since they are likely more sensitive to physiologic variability and small variations in segmentation results whereby central portions of the vascular tree are included in one segmentation result and not in another.
Lung segmentation and air and tissue volume measurement methods are found to be reproducible. Tissue volume measurement had a mean CV of 2.36 ± 1.9%. This measurement has a high level of repeatability considering that the measurements were made using 5 different scans (FRC, 2 static and 2 dynamic scans) at three different volumes (FRC, 7 and 15 cmH2O) and using three different acquisition methods (spiral, non-gated axial and gated axial scanning). The slightly higher non-significant tissue volume at FRC could be explained by shifts in blood volume due to breath hold at FRC after a recruitment to TLC as suggested by Beck et al. [21] and Krayer et al. [22].
The difference in air volume measurement when compared to the delivered air volume (BTPS-adjusted) using a super syringe was significant. The average difference shows that except for one animal, the syringe volume corrected for body temperature and pressure was always higher than that measured from the CT scans. The average difference was about 6.5% in the case of 7 cmH2O and about 8% in the case of the 15 cmH2O mouth pressure. A number of reasons might be behind such a difference. The most likely explanation was that there was a small, undetected leak in the system which was initially attributed to stress relaxation. In addition, the BTPS correction may not account fully for the mixing that happened when the syringe was used to inflate the lungs to 25 cmH2O before the final inflation level (7 or 15 cmH2O). Another factor is the change in gas volume in the lungs during the scanning due to the difference in VO2 and VCO2 volumes at the beginning and end of the scan. Other studies have found a closer correlation between delivered air volume in a syringe and measured air volume via CT [4,5,23]. Images reconstructed from computed tomographic scanning normally suffer from some blurring related to the type of reconstruction filter used. However, breathing motion and cardiac motion are usually more significant causes of blurring. In this study, acquired images were either gated to the respiratory cycle (dynamic scans) or non-gated (static spiral or non-gated axial scans) and there was no attempt to gate to the cardiac cycle. The effect of blurring becomes more obvious when histogram means for the dynamic vs. static images are compared. The comparison shows that the dynamic and static histogram means were significantly different (p < 0.05) with the means of the dynamic images being higher indicating greater partial volume effects on air filled areas of the lung. In addition, the blood volume present in the imaged regions could be different between the two conditions [22].
The variability of anatomic landmark localization was small, suggesting that dynamic scanning generates anatomically reproducible results. In-plane mean error was within two pixels while in the z-direction it was more due to the slice thickness. In this study slice thickness for dynamic images was 2.5 mm generating a mean localization error in the z-direction of 1.25 mm. Thinner slices easily achievable by state-of-the-art scanners would result in a better estimation of this error. Furthermore, the lack of significant difference in estimating airway diameters from static or dynamic scans indicates that dynamic scanning is a viable scanning technique with little degradation in the information obtained from the images.
In conclusion, the newly developed system for dynamic volumetric imaging and for monitoring and controlling lung volumes proved to be useful in volumetric imaging. These methods in turn are critical to the success of functional imaging such as perfusion or ventilation CT. The accuracy and repeatability of air and tissue volume measurements were found to be comparable suggesting that dynamic imaging can be used whenever static imaging is not possible or when questions are being asked in which measurements of interest depend upon the lung being studied under dynamic conditions. These results are obtained from anesthetized and mechanically ventilated animals. A next step is to translate these methodologies to the study of spontaneously breathing humans.
Figure 8.

A screen shot of “PhysMon,” the physiologic monitoring and triggering system used to monitor physiologic conditions of animals and trigger the MDCT scanner at predefined events. Signals from top to bottom are: airway pressure, ventilator signal (inspiration/expiration), trigger pulses (one for inspiration and one for expiration of each breath), x-ray on indicator (two for each respiratory cycle), end tidal CO2, and ECG (with considerable noise of no importance to this study).
Footnotes
Support:This study is supported in part by an NIH RO1-HL-064368.(a Bioengineering Research Partnership), and RO1-HL-060158
REFERENCES
- 1.Safonoff I, Emmanuel GE. The effect of Pendelluft and dead space on nitrogen clearance: mathematical and experimental models and their application to the study of the distribution of ventilation. J Clin Invest. 1967;46:1683–1693. doi: 10.1172/JCI105659. [DOI] [PMC free article] [PubMed] [Google Scholar]
- 2.Engel LA. Gas mixing within the acinus of the lung. J Appl Physiol. 1983;54:609–618. doi: 10.1152/jappl.1983.54.3.609. [DOI] [PubMed] [Google Scholar]
- 3.Campbell AH. Terminology for excessive dynamic compression of the airways, tracheobronchial collapse, and related conditions. Am Rev Respir Dis. 1968;97:460–462. doi: 10.1164/arrd.1968.97.3.460. [DOI] [PubMed] [Google Scholar]
- 4.Hoffman EA. Effect of body orientation on regional lung expansion: a computed tomographic approach. J Appl Physiol. 1985;59:468–480. doi: 10.1152/jappl.1985.59.2.468. [DOI] [PubMed] [Google Scholar]
- 5.Hoffman EA, Sinak LJ, Robb RA, et al. Noninvasive quantitative imaging of shape and volume of lungs. J Appl Physiol. 1983;54:1414–1421. doi: 10.1152/jappl.1983.54.5.1414. [DOI] [PubMed] [Google Scholar]
- 6.Kalender WA, Rienmuller R, Seissler W, et al. Measurement of pulmonary parenchymal attenuation: use of spirometric gating with quantitative CT. Radiology. 1990;175:265–268. doi: 10.1148/radiology.175.1.2315492. [DOI] [PubMed] [Google Scholar]
- 7.Tajik JK, Chon D, Won C, et al. Subsecond multisection CT of regional pulmonary ventilation. Acad Radiol. 2002;9:130–146. doi: 10.1016/s1076-6332(03)80163-0. [DOI] [PubMed] [Google Scholar]
- 8.Chon D, Simon BA, Beck KC, et al. Differences in regional wash-in and wash-out time constants for xenon-CT ventilation studies. Respir Physiol Neurobiol. 2005 doi: 10.1016/j.resp.2005.06.003. [DOI] [PubMed] [Google Scholar]
- 9.Brown MS, Goldin JG, McNitt-Gray MF, et al. Knowledge-based segmentation of thoracic computed tomography images for assessment of split lung function. Med Phys. 2000;27:592–598. doi: 10.1118/1.598898. [DOI] [PubMed] [Google Scholar]
- 10.Stern EJ, Webb WR. Dynamic imaging of lung morphology with ultrafast high-resolution computed tomography. J Thorac Imaging. 1993;8:273–282. doi: 10.1097/00005382-199323000-00003. [DOI] [PubMed] [Google Scholar]
- 11.Kachelriess M, Kalender WA. Electrocardiogram-correlated image reconstruction from subsecond spiral computed tomography scans of the heart [In Process Citation] Med Phys. 1998;25:2417–2431. doi: 10.1118/1.598453. [DOI] [PubMed] [Google Scholar]
- 12.Ford EC, Mageras GS, Yorke E, et al. Respiration-correlated spiral CT: a method of measuring respiratory-induced anatomic motion for radiation treatment planning. Med Phys. 2003;30:88–97. doi: 10.1118/1.1531177. [DOI] [PubMed] [Google Scholar]
- 13.Shi L, Hoffman EA, Reinhardt JM. SPIE Medical Imaging Physiology and Function from Multidimensional Images. San Diego, CA: 2004. Segmentation of the Ovine Lung in 3D CT Images; p. 5369. [Google Scholar]
- 14.Hoffman EA, McLennan G. Assessment of pulmonary structure-function relationships and clinical outcomes measures: Quantitative volumetric CT of the lung. Academic Radiology. 1997;4:758–776. doi: 10.1016/s1076-6332(97)80080-3. [DOI] [PubMed] [Google Scholar]
- 15.Won C, Chon D, Tajik J, et al. CT-based assessment of regional pulmonary microvascular blood flow parameters. J Appl Physiol. 2003;94:2483–2493. doi: 10.1152/japplphysiol.00688.2002. [DOI] [PubMed] [Google Scholar]
- 16.Chon D, Beck K, Shikata H, et al. Xenon gas flow patterns evaluated by high speed multirow detector CT. Progress in Biomedical Optics and Imaging 2004. 2004;5:89–101. [Google Scholar]
- 17.Hanley J, Debois MM, Mah D, et al. Deep inspiration breath-hold technique for lung tumors: the potential value of target immobilization and reduced lung density in dose escalation. Int J Radiat Oncol Biol Phys. 1999;45:603–611. doi: 10.1016/s0360-3016(99)00154-6. [DOI] [PubMed] [Google Scholar]
- 18.Tsunashima Y, Sakae T, Shioyama Y, et al. Correlation between the respiratory waveform measured using a respiratory sensor and 3D tumor motion in gated radiotherapy. Int J Radiat Oncol Biol Phys. 2004;60:951–958. doi: 10.1016/j.ijrobp.2004.06.026. [DOI] [PubMed] [Google Scholar]
- 19.Ohara K, Okumura T, Akisada M, et al. Irradiation synchronized with respiration gate. Int J Radiat Oncol Biol Phys. 1989;17:853–857. doi: 10.1016/0360-3016(89)90078-3. [DOI] [PubMed] [Google Scholar]
- 20.Reinhardt JM, Hoffman EA. Quantitative pulmonary imaging: Spatial and temporal considerations in high-resolution CT. Academic Radiology. 1998;5:539–546. doi: 10.1016/s1076-6332(98)80205-5. [DOI] [PubMed] [Google Scholar]
- 21.Beck KC, Lai-Fook SJ. Pulmonary blood flow vs. gas volume at various perfusion pressures in rabbit lung. Journal of Applied Physiology. 1985;58:2004–2010. doi: 10.1152/jappl.1985.58.6.2004. [DOI] [PubMed] [Google Scholar]
- 22.Krayer S, Rehder K, Beck KC, et al. Quantification of thoracic volumes by three-dimensional imaging. Journal of Applied Physiology. 1987;62:591–598. doi: 10.1152/jappl.1987.62.2.591. [DOI] [PubMed] [Google Scholar]
- 23.Mullan BF, Galvin JR, Zabner J, et al. Evaluation of in vivo total and regional air content and distribution in primate lungs with high-resolution CT. Acad Radiol. 1997;4:674–679. doi: 10.1016/s1076-6332(97)80138-9. [DOI] [PubMed] [Google Scholar]