Abstract
Context: Thermal responses of average-sized male subjects (mass of approximately 70 kg) may not accurately reflect the rate of heat storage in larger athletes with greater muscle mass.
Objective: To determine if core temperature (Tc) is different in National Football League linemen and backs and if Tc is related to percentage of dehydration or sweat rate.
Design: We measured Tc and sweat rate in professional football players during preseason twice-daily practices.
Setting: Preseason training camp.
Patients or Other Participants: Eight linemen (age = 26.6 ± 2.1 years, height = 191.8 ± 4.5 cm, mass = 134.8 ± 10.7 kg, body surface area = 2.61 ± 0.12 m2) and 6 backs (age = 27.0 ± 4.2 years, height = 185.0 ± 6.3 cm, mass = 95.6 ± 11.1 kg, body surface area = 2.19 ± 0.16 m2).
Main Outcome Measure(s): We measured Tc using ingestible sensors. Resting Tc was recorded in the mornings of data collection with players dressed in shorts and then every 15 minutes during 2-hour practices in full pads or shells. Mass was recorded before and after practices for determining the percentage of dehydration. In 8 of the 14 subjects (4 linemen, 4 backs), sweat rate was calculated using the change in mass adjusted for fluid intake and urine production.
Results: Height, mass, and body surface area were greater in linemen than in backs. We noted a linear trend over time for Tc in both groups. Maximal Tc was higher in linemen (38.65 ± 0.48°C) than in backs (38.44 ± 0.32°C), but linemen were less dehydrated than backs (−0.94 ± 0.6% versus – 1.3 ± 0.7%). Sweat rate was 2.11 ± 0.77 L/h and correlated significantly with body surface area (r = 0.77, P < .05). Maximal Tc was not correlated with either percentage of dehydration or sweat rate.
Conclusions: Maximal Tc was not associated with percentage of dehydration or sweat rate. Linemen were less dehydrated but demonstrated higher Tc than backs during practice. Maximal Tc was generally achieved during live scrimmaging.
Keywords: sweat rate, thermoregulation, heat storage, fluid regulation
Heat illnesses and deaths due to heat stroke have been documented in football players at the high school, college, and professional levels of competition.1 Physical characteristics such as total body mass, lean muscle mass, percentage of body fat, body surface area, and surface area-to-mass ratio affect thermoregulation. Aerobic fitness, acclimatization, clothing and equipment worn, and environmental considerations can contribute to the incidence of heat illness.2 Additionally, dehydration (determined by how quickly fluids are lost via sweating combined with inadequate fluid intake) is considered one of the primary precursors to heat-related disorders.2,3 Although sweat rates vary widely from one athlete to another, the average-sized male athlete generally sweats at a rate of between 0.75 and 1.75 L/h.4,5 Football players, however, sweat at higher rates than smaller distance runners.6 Most sports medicine professionals believe the incidence of heat illness can be reduced with proper hydration, an idea strongly supported by the National Athletic Trainers' Association position statements on fluid replacement2 and exertional heat illness.3
Several investigators7–10 have studied thermoregulation experimentally in subjects exercising in football equipment, but competitive football players were subjects in only one of the studies.10 Thermal responses of average-sized male subjects (mass of approximately 70 kg) may not accurately reflect the rate of heat storage in larger athletes with greater muscle mass. Using ingestible temperature sensors that allow accurate measurements of body temperature during activity, we documented core temperatures in collegiate football players and cross-country athletes while they participated in their respective preseason practices.11 We noticed that the highest core temperatures recorded in football players tended to occur in the interior linemen. Additionally, we were unable to find a correlation between the highest core temperature reached and the athlete's level of hydration.11
Professional teams in the National Football League (NFL) begin preseason training camp earlier than college teams. Their 2-a-day sessions generally start at the end of July and continue for 4 or more weeks, when it is typically hot and humid in many parts of the United States. To date, we are unaware of published field research related to core temperature, sweat rates, and hydration status in football players other than our own, and these studies involved collegiate players.6,11–14 Therefore, the purpose of this field study was 2-fold: (1) to measure the rise in core temperature during practice in professional football players and compare the core temperatures of larger interior lineman to those of backs and receivers, and (2) to determine if the highest core temperatures reached (Tcmax) were related either to the players' level of dehydration or their sweat rate.
METHODS
Subjects
Participants in the study were 8 interior linemen, consisting of 2 offensive tackles, 1 center, 1 guard, 2 defensive ends, and 2 defensive tackles, and 6 backs, consisting of 1 wide receiver, 1 running back, 2 corner backs, 1 tight end, and 1 linebacker (Table). All subjects were NFL first-team or second-team veteran players on 1 NFL team who were apprised of the minimal risks involved with the study and signed consent forms. The university's institutional review board approved the study.
Subjects' Physical Characteristics.
Procedures
Core Temperature Measurements
Subjects ingested a temperature sensor (HQ Inc, Palmetto, FL) at 11:00 pm on the first evening of preseason training camp, before data collection on days 2 and 3. These sensors are capable of transmitting accurate core temperature (Tc) readings (± 0.1°C) to a handheld recorder.15 Resting Tc was recorded in an air-conditioned area 1 hour before morning practice. Tc was then recorded in each player approximately every 15 minutes during 2 hours of football practice in full equipment. Tc was also measured during the afternoon practice (with the team dressed in shells) and during the next morning practice in those players who retained their sensors. Body mass was recorded before and after all practices to the nearest 0.23 kg (Detecto Scale, Webb City, MO) for determining percentage of dehydration (%DHY). Weight measures paralleled both Tc and sweat rate measures. Practices began at 8:45 am and 2:45 pm and consisted of 3 distinct periods, including individual drills and 7-on-7 team and live scrimmages. On data collection days, the highest wet bulb and dry bulb temperatures were 22.8°C and 25°C, 20.6°C and 29.2°C, and 18.5°C and 19.4°C during the morning, afternoon, and next morning practices, respectively.
Sweat-Rate Measurements
In addition to the Tc data collection, a subset of 8 first-team veteran players participated in data collection that allowed us to determine each individual's sweat rate. Physical characteristics of this group were age = 27.1 ± 3.4 years, height = 189.2 ± 7.9 cm, mass = 114.9 ± 26 kg, body surface area (BSA) = 2.4 ± 0.3 m2, and BSA-to-mass ratio = 0.0214 ± 0.0023 m2/kg. This group included 3 offensive linemen, 1 defensive lineman, 1 tight end, 1 wide receiver, and 2 corner backs. The sweat rate data were collected on the sixth and 10th days of training camp, when environmental conditions were similar. On day 6, mean wet bulb and dry bulb temperatures (3 readings recorded at the beginning of practice, mid practice, and immediately postpractice) were 21.5°C and 23.7°C and 24.7°C and 28.2°C for the morning and afternoon practices, respectively. On day 10, mean wet bulb and dry bulb readings during practices were 20.1°C and 20.1°C in the morning and 23.2°C and 30.1°C in the afternoon, respectively. Sweat rate was calculated using the change in mass adjusted for fluid intake and urine production. Specifically, the following protocol was followed: before practice, the players voided the contents of their bladders and recorded body weight (dressed in dry shorts or a towel) to the nearest 0.23 kg under the supervision of a research assistant. From the time body weight was recorded before practice to the postpractice body weight measurement (with players dressed as for the prepractice measurement), they drank only from their own premeasured, prelabeled containers of water and carbohydrate-and-electrolyte drink. Each football player had a personal fluid replacement attendant who was responsible for providing fluids of choice during practice. The players were instructed to drink only from their containers and not to let any fluid drop to the ground. During practice, the players could use the on-field water pumpers to cool themselves but did not drink from them. Individual urine containers were available on the field; however, none of the players urinated during practice. After practice, the players returned to the locker room to shower and towel dry. They emptied their bladders completely and recorded postexercise body weights, again under the supervision of a research assistant. Each player's postpractice urine volume was accurately measured and recorded. The amount of fluid remaining in each bottle was measured and subtracted from the starting volume to calculate fluid consumed during each practice. The following formula was used to calculate sweat rate: (Prepractice body mass − postpractice body mass− urine produced + fluids consumed) ÷ time of practice2 This formula does not account for insensible fluid losses, which were considered minimal. Sweat rate was calculated for each of the 8 players in both morning and afternoon practices. The mean sweat rate for each player was used in the statistical analysis.
Hydration Protocol
The intrusive hydration program used by this NFL sports medicine staff consists of the following regimen: (1) cold water is offered to each player between repetitions during practice, and carbohydrate-and-electrolyte drinks are provided on request, (2) cold bottled fluids (water, carbohydrate-and-electrolyte drinks, high-carbohydrate drinks) are kept in ice chests and offered to players as they exit the field after practice, and (3) bottled water and carbohydrate-and-electrolyte drinks are stocked in coolers in the locker rooms for consumption before and after practice.
Statistical Analysis
We analyzed changes in Tc over time using a repeated-measures general linear model (version 11.0; SPSS Inc, Chicago, IL). Group differences (linemen versus backs) in Tc and %DHY were analyzed using independent t tests. We calculated Pearson product moment correlations to assess the relationships between Tc and %DHY and between Tc and mass and, in the subset of 8 players, between Tc and sweat rate and BSA and sweat rate. The α level was set a priori at P < .05.
RESULTS
Height, mass, and BSA were all higher in linemen than in backs, and the BSA-to-mass ratio was lower in linemen. No differences were noted in wet bulb temperatures between the 2 morning or 2 afternoon practices when the sweat rate data were collected. The wet bulb readings were higher during the afternoon of Tc data collection than during the second morning. Results are reported as mean ± SD.
Core Temperature in Linemen Versus Backs
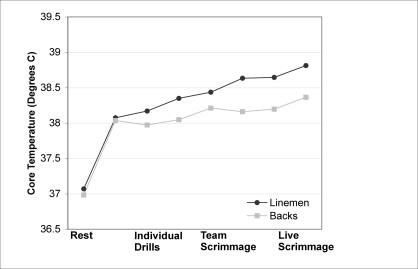
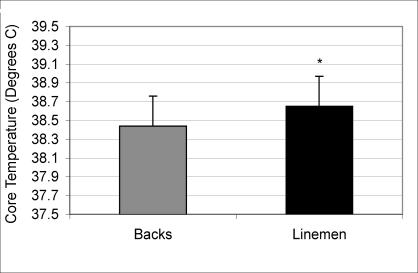
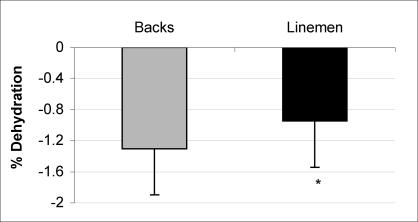
A significant linear trend over time was found for Tc in both groups, P < .0001 (Figure 1). During the morning practice, Tc rose from 37.07 ± 0.13°C to 38.81 ± 0.48°C in linemen and from 36.99 ± 0.09°C to 38.36 ± 0.44°C in backs. When the 2 highest instances of Tc recorded in each subject were compared, Tcmax was higher in linemen (38.65 ± 0.48°C, range = 37.47 to 39.29°C) than in backs (38.44 ± 0.32°C, range = 37.81 to 39.08°C) (P < .05, Figure 2). However, as measured by change in mass during practice, the linemen were less dehydrated than the backs (−0.94 ± 0.6% versus −1.3 ± 0.7%) (P < .05, Figure 3).
Figure 1. Core temperature over time for backs and linemen. P < .001.
Figure 2. Maximal core temperatures in backs and linemen. P < .05. *;thIndicates significant difference.
Figure 3. Percentage of dehydration in backs and linemen. P < .05. *;thIndicates significant difference.
Correlations Between Core Temperature and Percentage of Dehydration and Core Temperature and Mass
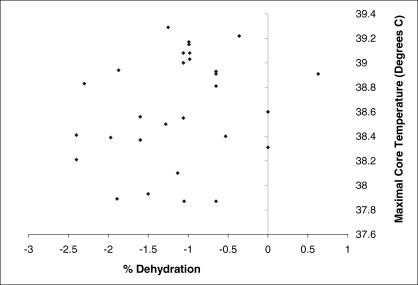
To increase statistical power, we calculated the Tcmax and %DHY correlations using n = 30 (all 14 players in the morning practice, 12 players who retained their sensors for the afternoon practice, and 4 players who retained their sensors for the next morning practice). As depicted in Figure 4, no correlations were found for Tcmax and %DHY (r = 0.24, P = .204). The %DHY for this group was −1.11 ± 0.7, ranging from a weight gain of 0.63% in one player to −2.4 %DHY in 2 players. A small (r = 0.44) but significant correlation was found for Tcmax and mass (P = 0.02).
Figure 4. Percentage of dehydration plotted against maximal core temperature. r = .24, P = .204.
Correlations Between Core Temperature and Sweat Rate and Sweat Rate and Body Surface Area
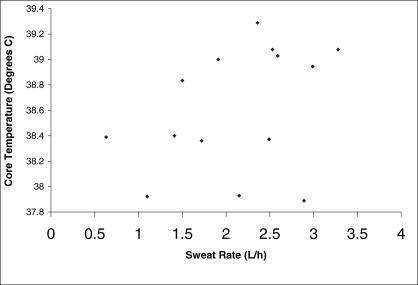
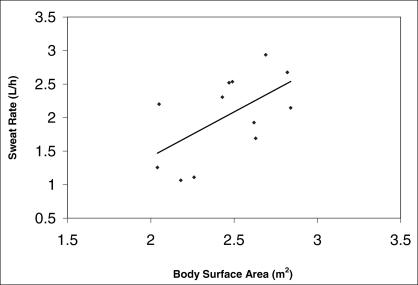
Correlations between Tcmax and the players' average sweat rate were calculated using n = 14, combining the morning (n = 8) and afternoon (n = 6) Tc data. We were unable to detect a correlation between Tcmax and sweat rate (r = 0.36, P = .19) (Figure 5). Sweat rate was 2.11 ± 0.77 L/h and %DHY was −1.4 ± 0.49%, ranging from −0.98 to −2.3%. As depicted in Figure 6, sweat rate and BSA were significantly correlated (r = 0.77, P < .05).
Figure 5. Sweat rate plotted against maximal core temperature. r = .36, P = .19.
Figure 6. Body surface area plotted against sweat rate. r = .77, P < .05.
DISCUSSION
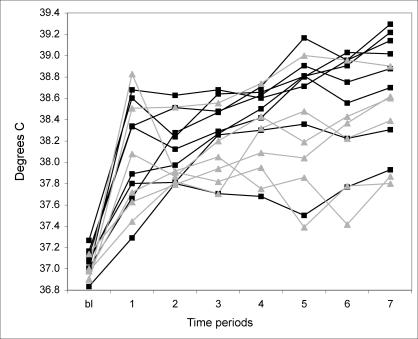
We were successful in documenting the Tc responses in professional football players about every 15 minutes and found a linear trend over time in Tc indicating gradual heat storage (see Figure 1). As depicted in Figure 7, this trend was more apparent in the linemen. The change in Tc in the backs was greater in response to bouts of exercise and rest. This finding was similar to that of a previous study11 in collegiate football players in whom Tc increased after periods of activity and decreased after periods of rest. This more gradual heat storage in the linemen may partially explain our finding that Tcmax was higher than in the backs.
Figure 7. Core temperature over time. Gray lines indicate linemen. Black lines indicate backs. bl indicates baseline.
Plausible explanations for greater heat storage and higher Tcmax in linemen include a larger body mass and lower BSA-to-mass ratio. Additionally, linemen have a lower aerobic fitness level than backs as measured by both V̇o2max10 and a timed 1.5-mile (2.41-km) run.16 It is also possible that exercise intensity or the duration of exercise during individual drills was different between the groups or that distances run (feet in the linemen versus yards in the backs) affected evaporative heat losses differently. A larger mass, higher percentage of body fat, greater BSA, and lower BSA-to-mass ratio in linemen than backs have been documented by others.10,17 Higher body mass increases metabolic rate and, therefore, heat production, resulting in greater heat storage.10,18,19 The lower BSA-to-mass ratio in larger football players diminishes heat dissipation via dry avenues such as conduction, convection, and radiation compared with smaller players.10,19 Wailgum and Paolone10 studied collegiate football players in an experimental investigation of heat tolerance during anaerobic exercise in environmental conditions of 35°C and 80% relative humidity. They reported higher rectal temperature and skin temperature and greater heat storage in the linemen compared with the backs. Epstein et al19 reported greater metabolic heat production, lower work efficiency, and higher rectal temperatures in larger subjects, and the mass differences between their groups were minimal compared with the differences between our linemen and backs. They studied 3 groups: heat intolerant (mass = 77.8 ± 6.2 kg, BSA-to-mass ratio = 0.0247 ± 0.0007 m2/kg), normal thermoregulatory response (mass = 65.2 ± 2.6 kg, BSA-to-mass ratio = 0.0271 ± 0.0005 m2/ kg), and control (mass = 67.5 ± 1.7 kg, BSA-to-mass ratio = 0.0272 ± 0.0004 m2/kg). They concluded that the lower BSA-to-mass ratio was the greatest contributor to the higher rectal temperatures found in their larger, heat-intolerant subjects. In addition, other researchers18 have concluded that lighter runners have a distinct thermoregulatory advantage over runners with greater mass who produce and store more heat at the same running speed.18 Our finding of greater heat storage and higher Tcmax in the larger linemen (mass = 134.8 ± 10.7 kg, BSA-to-mass ratio = 0.0194 ± 0.0007 m2/kg) than in the backs (mass = 95.6 ±11.1 kg, BSA-to-mass ratio = 0.0230 ± 0.0011 m2/kg) supports the results of these studies.10,18,19
We were unable to accurately measure exercise intensity in the players, making it difficult to comment on the possibility that work rate, work duration, or work-to-rest ratios may have been different between the groups. During certain time periods, for example, the backs and receivers were involved with the rest of the team running 7-on-7 plays, while the linemen were participating in 1-on-1 drills. The differences in work rate and the running distances covered by the linemen compared with the backs could at least partially explain the higher Tcmax in the linemen. Generally, backs run greater distances per play, frequently more than 10 yd (9.14 m) and often longer, whereas the linemen rarely run more than that distance per play. Because running speeds were higher in the backs, wind velocity and, therefore, evaporative cooling would also be greater. Adams et al20 reported that during exercise in environmental conditions of 35°C, an airflow velocity greater than 3 m/s resulted in lower skin and rectal temperatures in subjects than wind speeds of less than 2 m/s. This airflow concept as it relates to positional differences that affect running duration and, therefore, running velocity per play is interesting and requires further investigation in football players.
Importantly, certified athletic trainers need to recognize that core temperatures above 38.9°C are not unusual. Three years of recording body temperatures in collegiate and professional football players during practices and games (approximately 60 players in 156 player-exposures) led us to believe that core body temperatures in football players of between 38.9 and 40°C (102°F to 104°F) are normal when environmental conditions are warm or hot and humid.11–14,21,22 This has recently been documented by others.23,24
We were not surprised to find a lack of correlation between level of hydration and Tcmax in our players. The backs, who had lower Tcmax, were actually more dehydrated after practices than the linemen, although the differences in hydration level were small. On 5 occasions, players reached a Tcmax greater than or equal to 39.0°C (102.2°F), (range, 39.08°C to 39.29°C); however, their %DHY was −1.04 ± 0.01%, ranging from −0.98 to −1.25%. Additionally, the 3 players who were most dehydrated had relatively low Tcmax (−2.3%DHY and 38.8°C, −2.4%DHY and 38.4°C, and −2.4%DHY and 38.2°C). Previous field studies11,13 involving collegiate players also failed to reveal a significant relationship between Tc and level of hydration as measured by body weight loss or urine specific gravity. In these studies, Tc was recorded using the identical core temperature telemetry system (CorTemp; HQ Inc), and the mean body weight losses were greater in the collegiate players, ranging from 2.25 ± 0.9% to 2.9 ± 1.5%.
Despite reports of a direct relationship between hydration status and Tc,25–27 the inability to detect a correlation in field studies should not be viewed as unusual, particularly at mild to moderate levels of dehydration. Even in carefully controlled experimental studies, researchers have found no differences in the maximal Tc reached at exhaustion in subjects wearing protective clothing and dehydrated −2.3% compared with when they were euhydrated.28 Additionally, subjects hypohydrated by 3.5% to 4% before exercise in the heat did not have different Tc responses compared with trials when they were euhydrated, as long as fluids were available ad libitum during the exercise bouts.29
We offer 2 explanations for our finding that Tcmax was not related to the players' level of hydration. First, at the modest levels of dehydration experienced by our subjects (<2.5%), it seems reasonable to suggest that the changes in core body temperature were more related to another factor, presumably exercise intensity. This is supported by previous findings11 that Tc in football players increases and decreases in response to periods of activity and rest. Second, experimental protocols, methods, and subsequent data used for statistical analysis are likely different between field studies6,11–14,21–24 and the experimental investigations that report a direct relationship between Tc and hydration status.25–27 These former authors sought to document the effect of graded levels of hydration on core temperature during exercise,25–27 and the data support the conclusion that during continuous exercise in warm and humid or hot conditions, the change in core temperature is greater when subjects are hypohydrated or progressively dehydrated than when they are euhydrated.25,26 In a classic study25 in which subjects were dehydrated on separate occasions to between 1% and 4% (and maintained at that level of hypohydration during the exercise bout), Montain and Coyle25 reported a significant linear relationship between the change in esophageal temperature during 2 hours of continuous exercise and state of hydration. Data from this and other studies indicate that the rise in Tc is small at low levels of dehydration and increases as body weight loss increases.25–27 The subjects in these studies weighed approximately 70 to 80 kg, and the work bouts involved moderate-intensity continuous exercise, which often does not elicit excessively high core temperatures. Importantly, experimental investigators must adhere to safety protocols, which generally preclude subjects from continuing to exercise with core temperatures higher than or equal to 39.5°C. Because these exercise protocols are quite different from the type of work football players perform during practice, we cannot ascertain from these studies how high core temperature could rise at a given level of hydration, particularly in athletes with large muscle mass performing high-intensity, intermittent exercise in the heat. Importantly, however, in these experimental studies, the change in Tc varies considerably from one subject to another at any level of hydration. In one study,25 the variability in Tc among subjects ranged from approximately 0.1°C to 0.8°C at 1% body weight loss and from 0.6°C to 1.4°C at 3% body weight loss. In another study,27 the Tc differences between subjects were nearly 1.0°C at a given level of hydration.
As with field studies, it should be recognized that experimental investigations have different but inherent limitations, especially with regard to generalizing results to real-life situations. Consequently, they do not necessarily support the premise that minimizing dehydration will actually prevent hyperthermia in football players during practices.2,3 Data from our study, other recent field studies in football players,11,12,14,22 and a previous field report in marathon runners30 suggest that level of hydration may not give an accurate indication of which athletes will reach the highest core temperatures. In fact, several of our players with the highest core temperatures were the least dehydrated and vice versa. We believe this finding is extremely important to the clinician providing on-field care to football players. Although we believe that fluid replacement and recording weight loss during practices are critical in football players, our field data do not support the common dogma that the heaviest sweaters or most dehydrated players are at the greatest risk for developing high core temperatures.2,3
The sweat rate of 2.11 ± 0.77 L/h in our NFL players was nearly identical to the sweat rate reported in collegiate players (2.14 ± 0.53 L/h) practicing in similar environmental conditions.6 This was not unexpected because BSA is an important factor in determining the rate at which humans sweat.31 This finding was further supported by the positive correlation (r = 0.77) between BSA and sweat rate in the professional football players we studied. The physical characteristics of the subgroup of professional players (height = 189.2 ± 7.9 cm, mass = 114.9 ± 26 kg, BSA = 2.4 ± 0.3 m2) who participated in the sweat rate data collection were indistinguishable from the collegiate players (height = 188 ± 4.8 cm, mass = 116.63 ± 16.3, BSA = 2.4 ± 0.16 m2) who participated in the previous study.6 In that study, sweat rates were higher (greater than 2 L/h) in football athletes than in smaller runners who sweated at a rate of 1.77 L/h in identical environmental conditions.6 This was expected given the body size differences. Body surface area in the football players was significantly greater (2.4 ± 0.16 m2) than in the runners (1.87 ± 0.16 m2).6 Sweat rates as high as 3.9 L/h have been documented in a 139-kg lineman during a full, padded practice in hot conditions. This football player consistently lost more than 10 L per day (range, 10.9 to 14.8 L), which likely contributed to his chronic state of dehydration during preseason twice-a-day training.12 Data from our current study support conclusions that football players sweat at high rates and, therefore, must be vigilant with regard to both fluid and sodium replacement,6,12,13 as we recently documented a significant decline in blood sodium on the third and fifth days of preseason training in professional football players.32
The hydration protocol employed by this team appeared to be successful in ensuring that the players were appropriately hydrated during practices. The 2 subjects with the greatest weight loss were only −2.4% dehydrated. A body weight loss of less than 3% is considered minimal dehydration.2
CONCLUSIONS
Interior linemen playing in the NFL reached higher maximal core temperatures during football practice than smaller backs and receivers. The highest core temperatures in all subjects were generally obtained at the end of practice during live scrimmaging. At the modest levels of dehydration our football players experienced, body weight loss was not associated with core temperature. Linemen had higher core temperatures but were less dehydrated than backs, although neither of these significant differences were likely clinically relevant. However, although an intrusive hydration protocol can be successful in minimizing dehydration in football players during practice, athletic trainers should be aware that core temperature is not necessarily associated with either percentage of dehydration or sweat rate in these athletes.
Acknowledgments
We thank the 14 players and the Philadelphia Eagles coaching staff and organization for allowing us to do this investigation. We also thank Bill Fowkes; Chris Peduzzi, MA, ATC; Tom Hunkley, PT, ATC; and Rob Roche, MS, ATC, for assisting with the data collection.
REFERENCES
- Mueller FO. Catastrophic sports injuries: who is at risk? Curr Sports Med Rep. 2003;2:57–58. doi: 10.1249/00149619-200304000-00001. [DOI] [PubMed] [Google Scholar]
- Casa DJ, Armstrong LE, Hillman SK. National Athletic Trainers' Association position statement: fluid replacement for athletes. J Athl Train. 2000;35:212–224. et al. [PMC free article] [PubMed] [Google Scholar]
- Binkley HM, Beckett J, Casa DJ, Kleiner DM, Plummer PE. National Athletic Trainers' Association position statement: exertional heat illnesses. J Athl Train. 2002;37:329–343. [PMC free article] [PubMed] [Google Scholar]
- Broad EM, Burke LM, Cox GR, Heeley P, Riley M. Body weight changes and voluntary fluid intakes during training and competition sessions in team sports. Int J Sport Nutr. 1996;6:307–320. doi: 10.1123/ijsn.6.3.307. [DOI] [PubMed] [Google Scholar]
- Millard-Stafford M, Sparling PB, Rosskopf LB, Snow TK, DiCarlo LJ, Hinson BT. Fluid intake in male and female runners during a 40-km run in the heat. J Sports Sci. 1995;13:257–263. doi: 10.1080/02640419508732235. [DOI] [PubMed] [Google Scholar]
- Fowkes Godek S, Bartolozzi AR, Godek JJ. Sweat rates and fluid turnover in American football players compared with runners in a hot and humid environment. Br J Sports Med. 2005;39:205–211. doi: 10.1136/bjsm.2004.011767. [DOI] [PMC free article] [PubMed] [Google Scholar]
- Fox EL, Mathews DK, Kaufman WS, Bowers RW. Effects of football equipment on thermal balance and energy cost during exercise. Res Q. 1966;37:332–339. [PubMed] [Google Scholar]
- Kulka TJ, Kenney WL. Heat balance limits in football uniforms. Physician Sportsmed. 2002;30:29–39. doi: 10.3810/psm.2002.07.377. (7) [DOI] [PubMed] [Google Scholar]
- Mathews DK, Fox EL, Tanzi D. Physiological responses during exercise and recovery in a football uniform. J Appl Physiol. 1969;26:611–615. doi: 10.1152/jappl.1969.26.5.611. [DOI] [PubMed] [Google Scholar]
- Wailgum TD, Paolone AM. Heat tolerance of college football lineman and backs. Physician Sportsmed. 1984;12:81–86. (5) [Google Scholar]
- Fowkes Godek S, Godek JJ, Bartolozzi AR. Thermal responses in football and cross-country athletes during their respective practices in a hot environment. J Athl Train. 2004;39:235–240. [PMC free article] [PubMed] [Google Scholar]
- Fowkes Godek S, Bartolozzi AR. Sweat rate, fluid turnover, hydration status and core temperature in an American football player during pre-season training: a case study. Athl Ther Today. 2004;9:64–70. (4) [Google Scholar]
- Fowkes Godek S, Godek JJ, Bartolozzi AR. Hydration status in college football players during consecutive days of twice-a-day preseason practices. Am J Sports Med. 2005;33:843–851. doi: 10.1177/0363546504270999. [DOI] [PubMed] [Google Scholar]
- Godek JJ, Fowkes Godek S. Core temperature and dehydration status in Division II collegiate football players during two different NCAA mandated pre-season practice schedules [abstract] J Athl Train. 2004;39:S-59. (suppl) [Google Scholar]
- O'Brien C, Hoyt RW, Buller MJ, Castellani JW, Young AJ. Telemetry pill measurement of core temperature in humans during active heating and cooling. Med Sci Sports Exerc. 1998;30:468–472. doi: 10.1097/00005768-199803000-00020. [DOI] [PubMed] [Google Scholar]
- Barker M, Wyatt TJ, Johnson RL. Performance factors, psychological assessment, physical characteristics, and football playing ability. J Strength Cond Res. 1993;7:224–233. et al. [Google Scholar]
- Pincivero DM, Bompa TO. A physiological review of American football. Sports Med. 1997;23:247–260. doi: 10.2165/00007256-199723040-00004. [DOI] [PubMed] [Google Scholar]
- Marino FE, Mbambo Z, Kortekaas E. Advantages of smaller body mass during distance running in warm, humid environments. Pflugers Arch. 2000;441:359–367. doi: 10.1007/s004240000432. et al. [DOI] [PubMed] [Google Scholar]
- Epstein Y, Shapiro Y, Brill S. Role of surface area-to-mass ratio and work efficiency in heat intolerance. J Appl Physiol. 1983;54:831–836. doi: 10.1152/jappl.1983.54.3.831. [DOI] [PubMed] [Google Scholar]
- Adams WC, Mack GW, Langhans GW, Nadel ER. Effects of varied air velocity on sweating and evaporative rates during exercise. J Appl Physiol. 1992;73:2668–2674. doi: 10.1152/jappl.1992.73.6.2668. [DOI] [PubMed] [Google Scholar]
- Burkholder R, Fowkes Godek S, Sugarman E, Peduzzi C. The relationship between core temperature, percent dehydration and sweat rates in NFL players during preseason practices [abstract] J Athl Train. 2004;39:S-57. (suppl) [Google Scholar]
- Bartolozzi AR, Fowkes Godek S. Core temperature in professional football players during practice: a comparison between NFL linemen and backs [abstract] Med Sci Sports Exerc. 2004;36:S48. [Google Scholar]
- Stofan JR, Zachwieja JJ, Horswill CA, Murray RM, Eichner ER. Core temperature response during two-a-day practices in NCAA Division-1 college football [abstract] Med Sci Sports Exerc. 2004;36:S48. [Google Scholar]
- Casa DJ, Armstrong LE, Watson G. Heat acclimatization of football players during initial summer practice sessions [abstract] Med Sci Sports Exerc. 2004;36:S48. et al. [Google Scholar]
- Montain SJ, Coyle EF. Influence of graded dehydration on hyperthermia and cardiovascular drift during exercise. J Appl Physiol. 1992;73:1340–1350. doi: 10.1152/jappl.1992.73.4.1340. [DOI] [PubMed] [Google Scholar]
- Sawka MN, Young AJ, Francesconi RP, Muza SR, Pandolf KB. Thermoregulatory and blood responses during exercise at graded hypohydration levels. J Appl Physiol. 1985;59:1394–1401. doi: 10.1152/jappl.1985.59.5.1394. [DOI] [PubMed] [Google Scholar]
- Montain SJ, Sawka MN, Latzka WA, Valeri CR. Thermal and cardiovascular strain from hypohydration: influence of exercise intensity. Int J Sports Med. 1998;19:87–91. doi: 10.1055/s-2007-971887. [DOI] [PubMed] [Google Scholar]
- McLellan TM, Cheung SS, Latzka WA, Sawka MN, Pandolf KB, Withey WR. Effects of dehydration, hypohydration, and hyperhydration on tolerance during uncompensable heat stress. Can J Appl Physiol. 1999;24:349–361. doi: 10.1139/h99-027. [DOI] [PubMed] [Google Scholar]
- Armstrong LE, Maresh CM, Gabaree CV. Thermal and circulatory responses during exercise: effects of hypohydration, dehydration, and water intake. J Appl Physiol. 1997;82:2028–2035. doi: 10.1152/jappl.1997.82.6.2028. et al. [DOI] [PubMed] [Google Scholar]
- Wyndham CH, Strydom NB. The danger of an inadequate water intake during marathon running. S Afr Med J. 1969;43:893–896. [PubMed] [Google Scholar]
- Havenith G, Luttikholt VG, Vrijkotte TG. The relative influence o f body characteristics on humid heat stress response. Eur J Appl Occup Physiol. 1995;70:270–279. doi: 10.1007/BF00238575. [DOI] [PubMed] [Google Scholar]
- Fowkes Godek S, Bartolozzi AR, Kelly M. Changes in blood electrolytes and plasma volume in NFL football players during pre-season training [abstract] Med Sci Sports Exerc. 2004;36:S48. [Google Scholar]


