Abstract
Objective
To review a single center’s experience and outcome with living donor transplants.
Summary Background Data
Outcome after living donor transplants is better than after cadaver donor transplants. Since the inception of the authors’ program, they have performed 2,540 living donor transplants. For the most recent cohort of recipients, improvements in patient care and immunosuppressive protocols have improved outcome. In this review, the authors analyzed outcome in relation to protocol.
Methods
The authors studied patient and graft survival by decade. For those transplanted in the 1990s, the impact of immunosuppressive protocol, donor source, diabetes, and preemptive transplantation was analyzed. The incidence of rejection, posttransplant steroid-related complications, and return to work was determined. Finally, multivariate analysis was used to study risk factors for worse 1-year graft survival and, for those with graft function at 1 year, to study risk factors for worse long-term survival.
Results
For each decade since 1960, outcome has improved after living donor transplants. Compared with patients transplanted in the 1960s, those transplanted in the 1990s have better 8-year actuarial patient and graft survival rates. Death with function and chronic rejection have continued to be a major cause of graft loss, whereas acute rejection has become a rare cause of graft loss. Cardiovascular deaths have become a more predominant cause of patient death; infection has decreased. Donor source (e.g., ideally HLA-identical sibling) continues to be important. For living donor transplants, rejection and graft survival rates are related to donor source. The authors show that patients who had preemptive transplants or less than 1 year of dialysis have better 5-year graft survival and more frequently return to full-time employment. Readmission and complications remain problems; of patients transplanted in the 1990s, only 36% never required readmission. Similarly, steroid-related complications remain common. The authors’ multivariate analysis shows that the major risk factor for worse 1-year graft survival was delayed graft function. For recipients with 1-year graft survival, risk factors for worse long-term outcome were pretransplant smoking, pretransplant peripheral vascular disease, pretransplant dialysis for more than 1 year, one or more acute rejection episodes, and donor age older than 55.
Conclusions
These data show that the outcome of living donor transplants has continued to improve. However, for living donors, donor source affects outcome. The authors also identify other major risk factors affecting both short- and long-term outcome.
The first successful kidney transplants in humans were from identical twin living donors. 1,2 Although transplanted before the development of chemical immunosuppression, many of these identical twin grafts had long-term survival. With recognition of the immunosuppressive effects of prednisone and azathioprine, the use of nontwin donors became possible. 3,4 Considerable controversy soon followed as to whether it was ethical to use living donors for kidney transplantation. 5–8 Proponents of the use of living donors noted that the short- and long-term patient and graft survival rates were better after living (vs. cadaver) donor transplants. Opponents worried that living donor nephrectomy was a major operation with potential risk to the donor; they believed that these risks did not justify the benefits to the recipient. Our program has always advocated the use of living donors. We recognized the risks to the donor but decided that a fully informed potential donor could choose whether to accept these risks.
In the last decade, as a result of improvements in patient care, optimization of immunosuppressive protocols, and the introduction of new immunosuppressive agents, outcome for both living and cadaver donor recipients has markedly improved. Despite this improvement, for the patient considering a transplant, the single prospective decision that most positively affects long-term outcome continues to be to have a living donor transplant.
We herein describe our entire living donor experience. Between January 1, 1963, and December 31, 1998, we performed 2,540 living donor kidney transplants at the University of Minnesota. Immunosuppressive protocols have evolved over time, and since 1983, our protocols have been cyclosporine-based. Dosing and blood levels have been optimized. We emphasize the improvement in outcome as protocols have evolved, the results that can be expected with cyclosporine- and azathioprine-based immunosuppression, and the risk factors for worse long-term outcome.
METHODS
Since the inception of our transplant program, all patients electing to undergo a kidney transplant have been encouraged to have a living donor transplant. Before 1997, eligible donors underwent initial medical screening and then ABO blood typing, HLA typing, and cross-matching. Once this information was complete, one potential donor (in general, the best match) was selected to undergo evaluation. Since 1997, prospective HLA matching has been done only when faced with multiple ABO-compatible donors, at least one of whom is the potential recipient’s sibling. All siblings are typed to determine whether they are HLA-identical with the potential recipient. In the absence of potential sibling donors, tissue typing is currently done at the time of transplant (i.e., it is not a factor in donor selection).
Recipient Selection
Our criteria for accepting a transplant candidate have changed. In the 1960s, patients with diabetes were excluded because it was anticipated that the results would be dismal. However, in the late 1960s, we began performing transplants for patients with renal failure resulting from type 1 diabetes. 9 In the 1970s, patients older than 50 were considered to be at high risk, especially for a cadaver kidney transplant. Currently, however, patients in their 60s and 70s are accepted for transplants. 10
A detailed evaluation of transplant candidates is performed; the major goals are to ensure that the recipient will tolerate surgery, has vasculature that will enable anastomoses, and has no disease (e.g., malignancy, infection) that would acutely be worsened by immunosuppression. 11 Pretransplant cardiac evaluation has become more extensive over the years, subsequent to our noting that death with function was becoming an increasingly common cause of graft loss, particularly for patients with end-stage renal disease resulting from diabetes. Algorithms for the evaluation of diabetic potential recipients have been developed. 12,13 More recently, with increased transplantation of older recipients (older than 55 years), similar algorithms are being developed for older nondiabetic potential recipients. 14
Donor and Recipient Evaluation
Donor evaluation has been described in detail. 11 In brief, the donor should have good health with minimum anesthesia risks (American Society of Anesthesia class I or II risk), no transmissible infection or tumor, and two well-functioning kidneys. A detailed psychosocial evaluation is done selectively based on the initial interview.
Recipient Preparation
Recipient preparation and immunosuppressive protocols have evolved. Early in our series, patients with renal failure had transfusions when necessary. Subsequently, transfusions were avoided because of fear of inducing anti-HLA antibodies. In 1978, with recognition that recipients having pretransplant blood transfusions had better long-term graft survival, 15 we initiated a policy of deliberate pretransplant random donor blood transfusions for all non-HLA-identical recipients. We continue to encourage (but do not insist on) pretransplant random donor transfusions.
Before 1980, all recipients underwent a pretransplant bilateral nephrectomy and splenectomy. This practice was stopped when a prospective randomized study showed no benefit in long-term graft survival for recipients who had a splenectomy. 16 Since that study, routine pretransplant splenectomy has not been done, and pretransplant nephrectomy has been done only for specific indications (e.g., infection, uncontrolled hypertension).
Timing of Transplant
Whenever possible, transplants have been done before initiation of dialysis. Our philosophy has been that there is no need for the recipient to incur the costs and complications of dialysis access surgery and of dialysis itself. We time the transplant according to the impairment in the potential recipient’s quality of life. Usually, quality of life is impaired by end-stage renal disease long before dialysis is necessary. Thus, when quality of life is affected to the point of justifying the risks of surgery and immunosuppression, we proceed with the transplant. In addition, for living donor transplants, timing also depends on the donor’s availability.
Routine Immunosuppressive Protocols
Before 1967, recipients received prednisone and azathioprine for immunosuppression. Between 1967 and 1980, most received a 2-week course of Minnesota antilymphocyte globulin (MALG) plus prednisone and azathioprine. Between 1980 and 1983, we did a prospective randomized study of the cyclosporine, prednisone, and azathioprine regimen versus MALG, prednisone, and azathioprine. 17 After completion of the study, all subsequent recipients received triple therapy consisting of prednisone, azathioprine, and cyclosporine. Pediatric recipients, living unrelated donor recipients, and recipients with delayed graft function (DGF) also received antibody (MALG or Atgam).
More recently, mycophenolate mofetil (MMF) (instead of azathioprine) and tacrolimus (instead of cyclosporine) have been used in selected patients. In addition, throughout the years, selected recipients have been eligible, and have consented, to participate in several prospective randomized trials of new immunosuppressive agents.
For recipients receiving cyclosporine-based immunosuppression, the cyclosporine was started 2 days after the transplant (5 mg/kg with Sandimmune, 4 mg/kg with Neoral) and was continued at 4 mg/kg twice daily. Initially, for recipients doing well, we did not attempt to maintain predefined long-term cyclosporine levels. Levels were pushed up, however, after a biopsy-proven rejection episode. Beginning in 1988, the cyclosporine dose was adjusted to maintain a trough level of more than 100 ng/mL by high-performance liquid chromatography for the first 3 months.
Our subsequent retrospective analyses showed that the acute rejection (AR) rate in the first 6 months was lower for recipients with cyclosporine levels of 150 ng/mL or more (vs. <150 ng/mL) for the first 3 months, 16,17 and that the chronic rejection (CR) rate was lower for recipients with cyclosporine levels of 100 ng/mL or more (vs. <100 ng/mL) at 1 year after the transplant. 18,19 Thus, more recently, our protocol has been to maintain cyclosporine levels at more than 150 ng/mL for the first 3 months after the transplant, then at 125 to 150 ng/mL between 6 and 12 months after the transplant, and more than 100 ng/mL thereafter.
At the time of transplant, prednisone (1 mg/kg per day tapered to 0.15 mg/kg per day) and azathioprine (5 mg/kg per day, rapidly tapered to 2.5 mg/kg per day) were started. For HLA-identical recipients, prednisone was started at 0.5 mg/kg per day.
For living donor recipients with DGF, the cyclosporine was discontinued and antibody started (in the past, MALG or Atgam; currently thymoglobulin). Cyclosporine was restarted when the serum creatinine level began to decrease; the antibody was stopped when cyclosporine trough levels were therapeutic.
For both pediatric recipients and living unrelated donor recipients, a course of antibody (either MALG or Atgam) was given at the time of transplant. For pediatric recipients, a full course (10–14 days) of antibody was given; cyclosporine was not started until there was evidence of good renal function. For living unrelated donor recipients, a short course of antibody was given (5–7 days); cyclosporine was started before the transplant (as with living related donor recipients) and continued in the immediate postoperative period as long as renal function was good. More recently, some living unrelated donor recipients with excellent initial renal function have not received antibody.
Rejection Episodes
Recipients with 25% or greater change in the serum creatinine level were evaluated for possible AR. Evaluation consisted of history and physical examination, repeat serum creatinine level measurements, cyclosporine blood level measurement, and review of other recent medication changes. If a probable cause of the elevated creatinine level was identified, it was treated and the serum creatinine level repeated. If a cause was not identified, the recipient underwent ultrasonography to rule out lymphocele or ureteral stenosis; if neither was identified, a percutaneous allograft biopsy was done. If lymphocele or ureteral stenosis was identified, it was treated (percutaneous drainage, nephrostomy) and the serum creatinine level was measured again. If the serum creatinine level did not decrease, a percutaneous allograft biopsy was done.
Biopsy-proven AR episodes were treated with methylprednisolone (500 mg/day × 3) or with recycling of the prednisone taper. Steroid-resistant rejection was treated with antibody (MALG or OKT3). An important change in our protocol came with the recognition that, in our series, AR was a major risk factor for biopsy-proven CR. 20,21 We noted that although the risk of developing CR increased for patients with a single AR episode, it markedly increased for those with more than one AR episode. Therefore, when recipients break through their immunosuppressive protocol and have an AR episode, we currently treat the episode and change the maintenance immunosuppression. For example, for recipients receiving prednisone, azathioprine, and cyclosporine with good cyclosporine levels, we would treat the AR episode and switch the recipient from azathioprine to MMF.
CR was diagnosed by biopsy or at nephrectomy. Historically, some grafts with slow deterioration of function culminating in return to dialysis were defined as being lost to CR.
Infection Prophylaxis
All recipients received long-term single-strength Bactrim (trimethoprim/sulfamethoxazole). An important development in our program was the recognition of the importance of cytomegalovirus disease 22 and the development of cytomegalovirus prophylaxis. Initially, we used acyclovir for all recipients. After our randomized prospective trial of immediate acyclovir versus ganciclovir, 23 we began giving all recipients 5 to 7 days of intravenous ganciclovir.
Currently, we are studying whether a prolonged course of ganciclovir alone is better than 1 week of ganciclovir and long-term acyclovir. All recipients take clotrimazole troche (10 mg) four times a day for 4 to 6 months after the transplant.
Data Collection
Recipient data are maintained on a microcomputer database. Before 1984, basic demographics were entered for all patients. Since 1984, detailed information on pre- and postoperative risk factors, employment, and quality of life has been entered.
Data collection is done by coordinators who make rounds on the inpatient service and review the outpatient charts. In addition, recipients transplanted since 1984 are annually sent a questionnaire asking about admissions to other hospitals, any outpatient diagnoses made at other centers, quality of life, and employment.
Data Analysis
We analyzed patient and graft survival rates for living versus cadaver donor recipients. We subdivided data by decade and, for patients transplanted in the 1990s, by immunosuppressive protocol. Because we previously described our precyclosporine experience in detail, we herein present detailed data on outcome for cyclosporine-treated patients. To study recent trends, we compared outcome for patients transplanted in 1990 to 1995 versus 1996 to 1998. In addition, we studied the impact of donor source (HLA-identical vs. 1-haplo-match vs. 0-haplo-match vs. living unrelated donor), diabetes, and preemptive transplants (vs. those transplanted after initiation of dialysis). Using multivariate analysis, we studied risk factors for decreased short- and long-term outcome. We analyzed risk factors affecting 1-year graft survival and then, for recipients whose grafts were functioning at 1 year, risk factors affecting long-term graft survival. Variables considered in the analysis were donor source (HLA-identical vs. 1-haplo-match vs. 0-haplo-match vs. living unrelated donor), donor age (older than 55 vs. 10–55), diabetes (yes vs. no), pretransplant cardiac problems (yes vs. no), pretransplant peripheral vascular disease (yes vs. no), pretransplant smoking (yes vs. no), pretransplant dialysis (>1 year vs. <1 year vs. none), DGF (yes vs. no), AR (yes vs. no), and cyclosporine nephrotoxicity in the first year (diagnosed by percutaneous allograft biopsy) (yes vs. no).
Actuarial patient and graft survival rates were calculated by Kaplan-Meier methods, and the Gehan test was used for statistical comparisons. 24 Graft survival rates were calculated with and without death with function considered a graft loss. 25 Other comparisons were analyzed using the Student t test, Wilcoxon rank sum test, and chi-square or Fisher exact test.
RESULTS
Between January 1, 1963, and December 31, 1998, we performed 2,540 living donor transplants at the University of Minnesota. The number of transplants and the specific donor source are shown by decade in Table 1. The major difference between donor sources was the increased use of living unrelated donors late (vs. early) in our series.
Table 1. DONOR SOURCE BY DECADE
Of the 2,540 transplants, 2,307 were primary transplants, including 30 simultaneous pancreas and kidney transplants and 233 retransplants (201 second, 27 third, 3 fourth, 2 fifth). Table 2 shows the demographics for all primary living donor kidney recipients transplanted before versus after January 1, 1990. Average recipient age has increased significantly, and an increased proportion of recipients are 55 or older. In addition, fewer patients are classified as having chronic glomerulonephritis or pyelonephritis; a higher percentage of recipients have IgA nephropathy or polycystic kidney disease.
Table 2. DEMOGRAPHICS
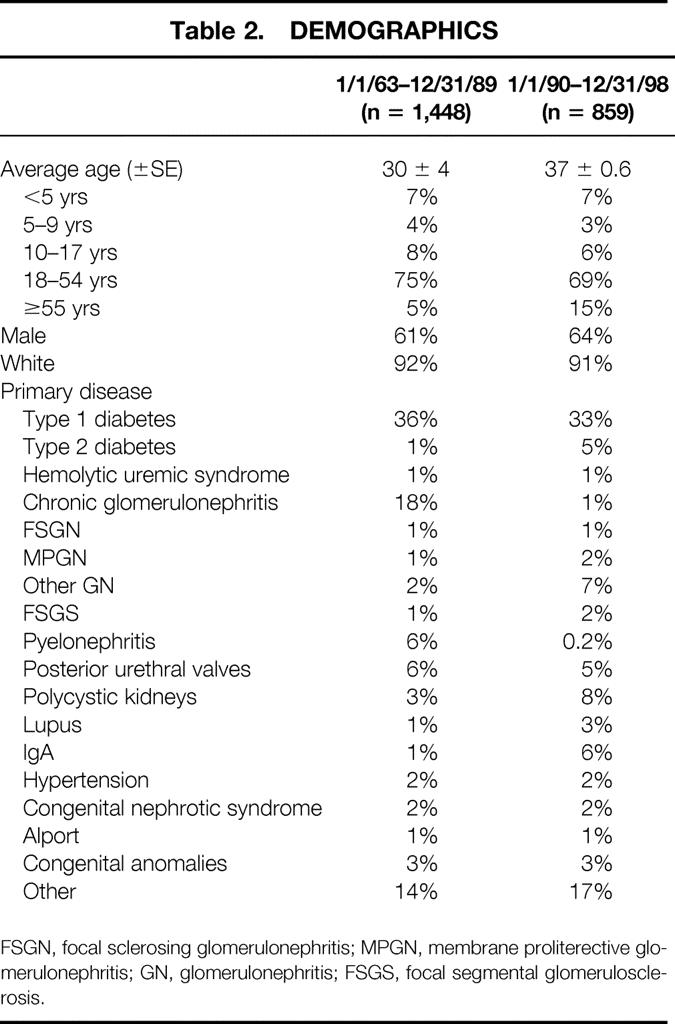
FSGN, focal sclerosing glomerulonephritis; MPGN, membrane proliterective glomerulonephritis; GN, glomerulonephritis; FSGS, focal segmental glomerulosclerosis.
Primary Transplant Results
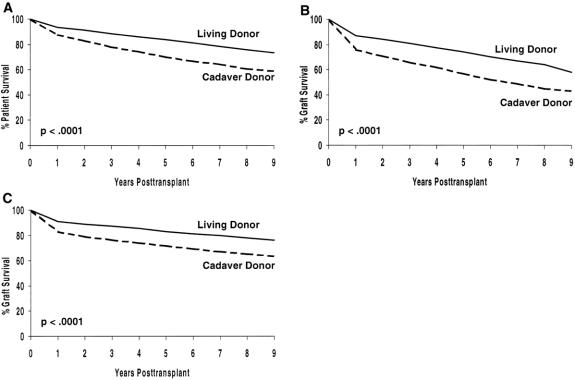
Actuarial patient survival rates for all living versus cadaver donor primary transplants, actuarial graft survival rates, and death-censored graft survival rates are shown in Figure 1. For each, outcome is significantly better for living donor recipients (P < .001).
Figure 1. Actuarial patient and graft survival rates for primary living donor transplants at the University of Minnesota: (A) patient survival, (B) graft survival, (C) death-censored graft survival.
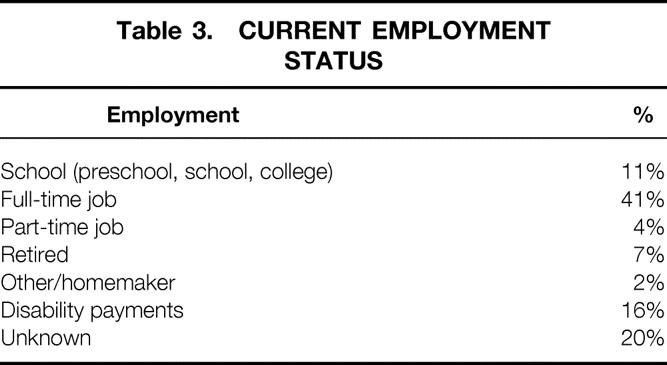
Currently, 1,278 (55%) primary living donor recipients are alive with graft function. Employment status for this cohort is shown in Table 3. Of the 1,278 recipients, 56% are known to be in school or working full- or part-time; 16% are receiving disability payments.
Table 3. CURRENT EMPLOYMENT STATUS
Impact of Decade Transplanted
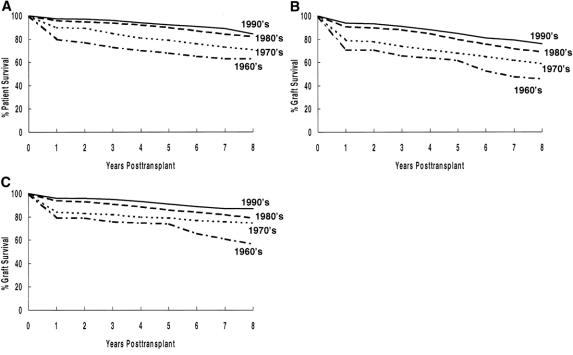
Actuarial patient survival rates by decade for primary living donor transplant recipients are shown in Figure 2 A. There was an incremental improvement for recipients transplanted in the 1970s (vs. the 1960s) and for recipients transplanted in the 1980s (vs. the 1970s), with a slight improvement in the 1990s (vs. the 1980s). Overall, the 8-year actuarial patient survival rate has improved from 63% for recipients transplanted in the 1960s to 89% for those transplanted in the 1990s.
Figure 2. Actuarial patient and graft survival rates by decade for primary living donor transplants: (A) patient survival, (B) graft survival, (C) death-censored graft survival.
The actuarial graft survival rate has shown an incremental improvement by decade (see Fig. 2 B). Overall, the 8-year graft survival rate has improved from 50% for recipients transplanted in the 1960s to 80% for those transplanted in the 1990s.
Death-censored graft survival rates have also improved in each decade (see Fig. 2 C). Overall, the 8-year death-censored graft survival rate has improved from 62% for recipients transplanted in the 1960s to 87% for those transplanted in the 1990s.
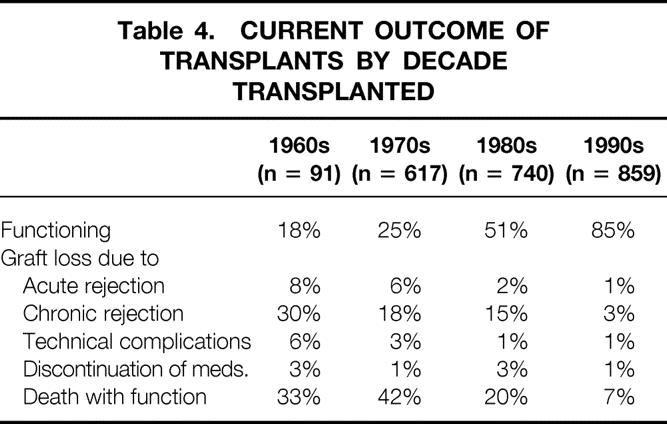
Of primary grafts transplanted in the 1960s, 18% are currently functioning versus 25% of those transplanted in the 1970s, 51% of those transplanted in the 1980s, and 85% of those transplanted in the 1990s (Table 4).
Table 4. CURRENT OUTCOME OF TRANSPLANTS BY DECADE TRANSPLANTED
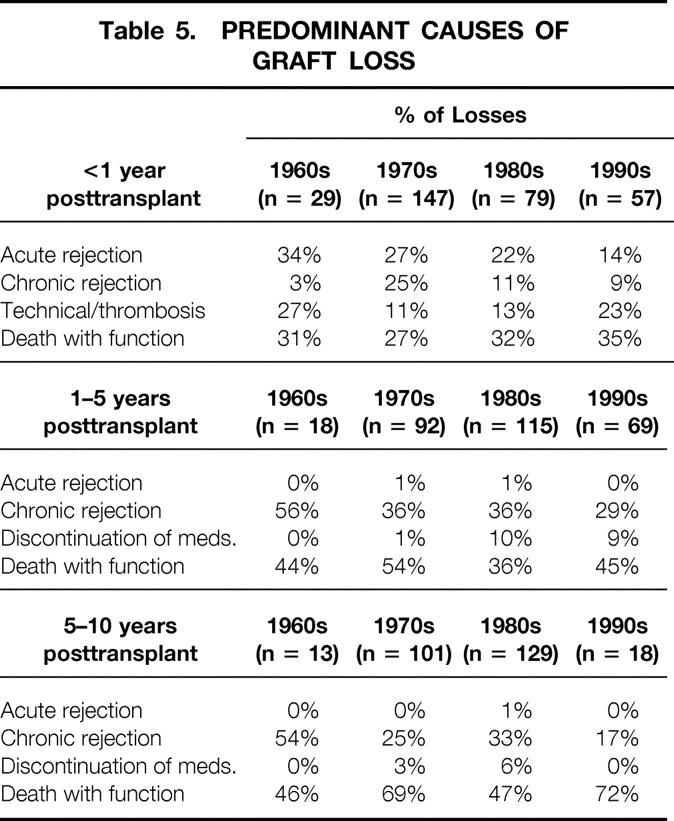
The causes of early graft loss have changed over time (Table 5). In the 1960s, 34% of graft losses in the first year were due to AR; by the 1990s, this figure was only 14%. In addition, recipients transplanted in the 1990s have fewer grafts lost to CR at 1 to 5 years and 5 to 10 years after the transplant than do recipients transplanted in previous decades. Death with function is a major cause of graft loss in each decade.
Table 5. PREDOMINANT CAUSES OF GRAFT LOSS
The causes of patient death have also changed over time (Table 6). The incidence of infection as a cause of death, both early and late after the transplant, has decreased. Cardiovascular causes are more common. Sudden death at home, often in older or diabetic recipients, has become an important cause of both early and late deaths. Such recipients, without an autopsy performed, are presumed to have died of cardiovascular causes. The incidence of death from malignancy less than 1 year after the transplant and 1 to 5 years after the transplant has also increased. This increase may be due to our transplanting an older cohort of patients or to the use of a more powerful immunosuppressive regimen.
Table 6. PREDOMINANT CAUSES OF DEATH
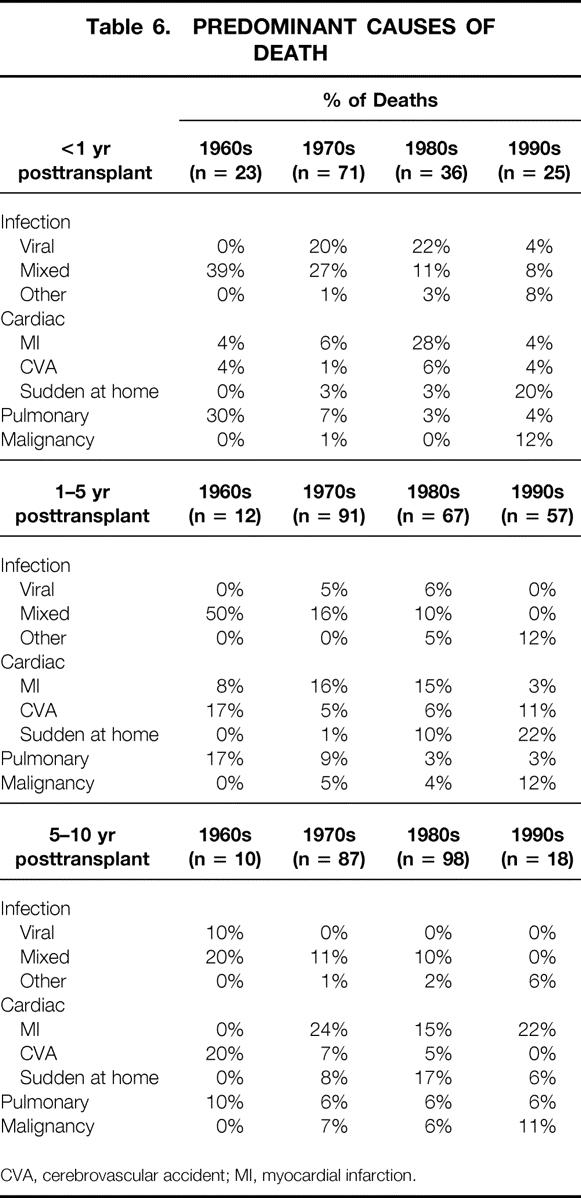
CVA, cerebrovascular accident; MI, myocardial infarction.
Impact of Donor Source for Cyclosporine-Immunosuppressed Recipients
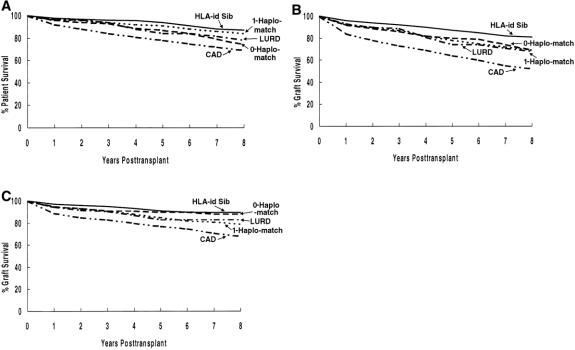
For cyclosporine-immunosuppressed primary living donor recipients, all living donor subgroups have significantly better actuarial patient survival rates than cadaver donor recipients (P < .001) (Fig. 3 A). Of the living donor recipients, HLA-identical or 1-haplo-match recipients have better survival rates than 0-haplo-match recipients or those with kidneys from living unrelated donors (P < .01).
Figure 3. Actuarial patient and graft survival rates by donor source for cyclosporine-immunosuppressed primary living donor transplants: (A) patient survival, (B) graft survival, (C) death-censored graft survival.
All living donor subgroups have significantly better actuarial graft survival rates than cadaver recipients (P < .001) (see Fig. 3 B). Of the living donor recipients, HLA-identical recipients had the best outcome (P < .01 vs. other groups). Graft survival rates at 8 years were similar for 0-haplo-match, 1-haplo-match, and living unrelated donor recipients.
Death-censored graft survival rates are significantly better for living donor (vs. cadaver donor) recipients (P < .001) (see Fig. 3 C). Of the living donor recipients, HLA-identical and 0-haplo-match recipients have slightly better survival rates (P < .05).
Donor source has a significant impact on time to first AR episode (Fig. 4 A). HLA-identical recipients have significantly lower AR rates; at 12 months after the transplant, 93% have never had AR. Both 1-haplo-match and living unrelated donor recipients have significantly less AR than cadaver donor recipients and 0-haplo-match recipients. The rate of AR did not differ between 0-haplo-match recipients and cadaver donor recipients.
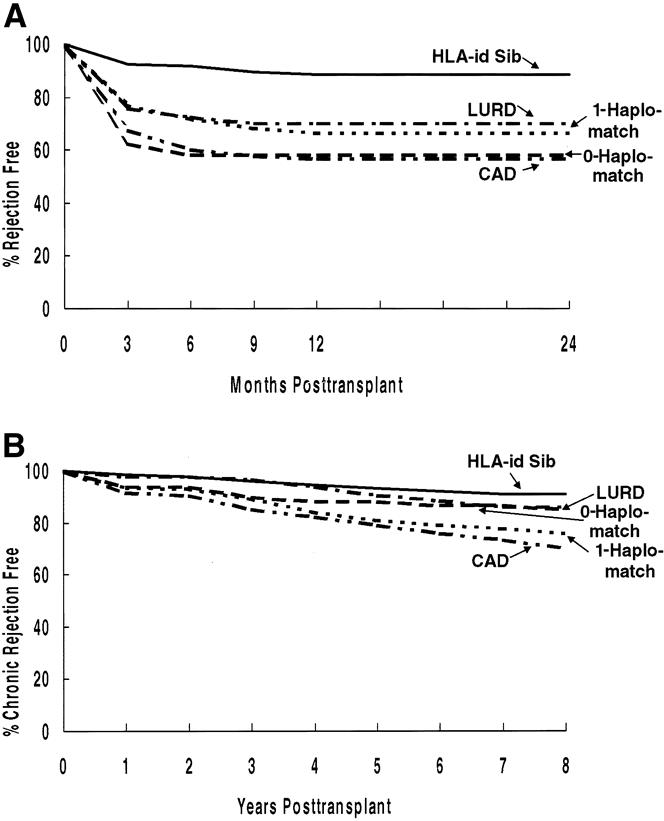
Figure 4. Impact of donor source on (A) the rate of acute rejection in the first 24 months and (B) the rate of chronic rejection.
All living donor subgroups have less CR than cadaver donor recipients (see Fig. 4 B). Of the living donor recipients, the lowest rate of CR is after HLA-identical transplants.
Outcome for Recipients Transplanted in the 1990s
Patient and Graft Survival Rates
We studied the impact of changes in our immunosuppressive protocol in the mid-1990s. Because our retrospective analyses showed an impact of cyclosporine levels on the incidence of rejection, 18,19 we began, in the mid-1990s, to aggressively maintain higher cyclosporine levels (150–200 ng/mL by high-performance liquid chromatography) for the first 3 months after the transplant.
We compared patient and graft survival rates (Fig. 5) for primary living donor recipients transplanted between January 1, 1990, and December 31, 1995 (n = 517) versus those transplanted between January 1, 1996, and December 31, 1998 (n = 342). Although patient survival rates between groups is not different, the 24-month actuarial graft survival rate is significantly better in the latter cohort.
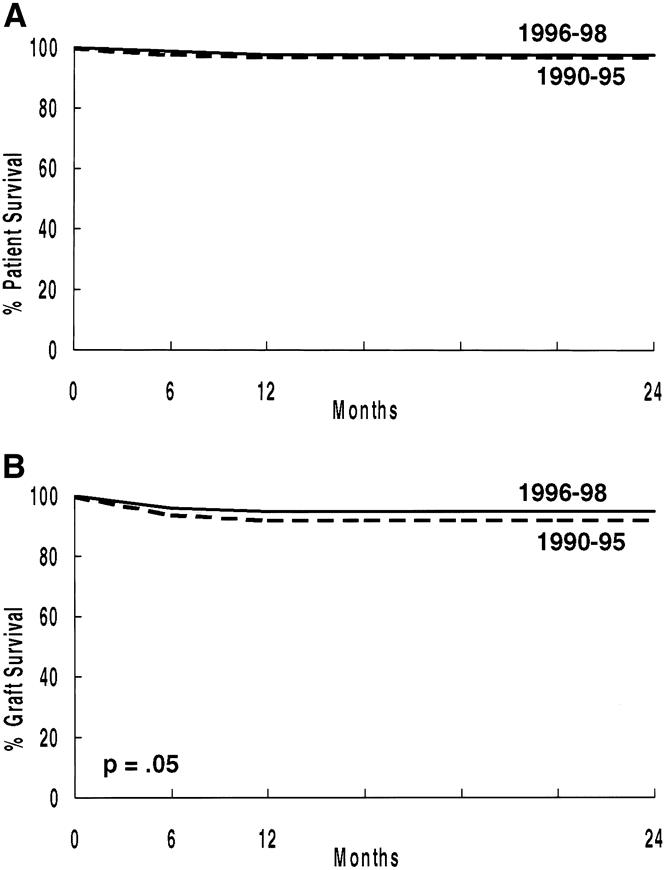
Figure 5. Actuarial patient (A) and graft (B) survival rates (primary living donor transplants, 1/1/90 to 12/31/95 vs. 1/1/96 to 12/31/98).
Preemptive Transplants
We compared outcome for primary transplant recipients having preemptive transplants versus those receiving more than 1 year pretransplant dialysis versus those receiving less than 1 year pretransplant dialysis. Actuarial patient survival rates were worse for those receiving dialysis for more than 1 year before the transplant versus those receiving dialysis for less than 1 year (P = .01) and versus those undergoing preemptive transplants (P = .01). There was no difference between those receiving dialysis for less than 1 year versus those undergoing preemptive transplants. The 5-year patient survival rate was 93% for those undergoing preemptive transplants, 95% for those receiving less than 1 year of pretransplant dialysis, and 81% for those receiving more than 1 year of pretransplant dialysis.
We noted a significant difference in actuarial graft survival rates between those having preemptive transplants versus more than 1 year of pretransplant dialysis (P = .05). There was a borderline difference between those having less than 1 year versus more than 1 year of pretransplant dialysis (P = .07). Of importance, death-censored graft survival rates did not differ between groups (P > .1).
Rejection
Recipients transplanted between January 1, 1996, and December 31, 1998, have a significantly lower rate of both AR (P < .0005) and CR (P < .02) (Fig. 6).
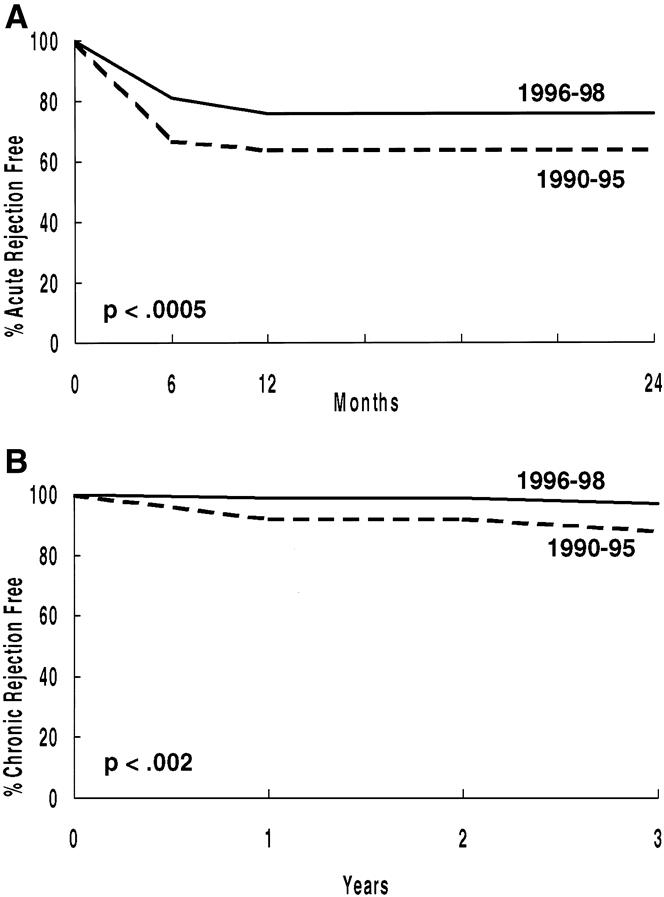
Figure 6. Percentage free of acute (A) and chronic (B) rejection (primary living donor transplant recipients, 1/1/90 to 12/31/95 vs. 1/1/96 to 12/31/98).
The change in our immunosuppressive protocol in the mid-1990s affected each living donor subgroup. When compared with those transplanted between January 1, 1990, and December 31, 1995, each subgroup (HLA-identical, 1-haplo-match, 0-haplo-match, living unrelated donor) transplanted between January 1, 1996, and December 31, 1998, had improved patient graft survival rates (data not shown) and a lower AR rate (Table 7).
Table 7. REJECTION-FREE SURVIVAL, BY DONOR SOURCE
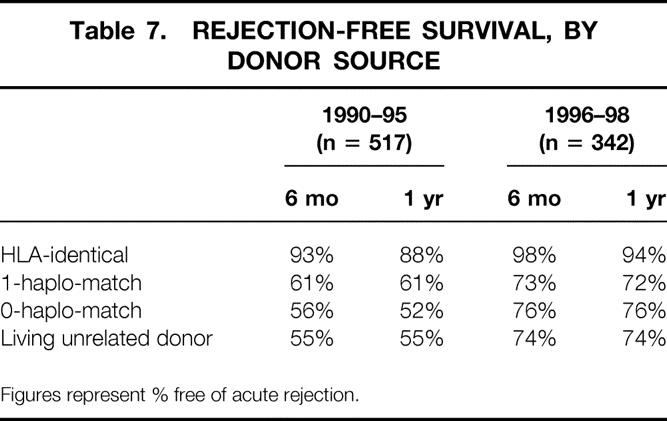
Figures represent % free of acute rejection.
Although the AR rate within the first 6 months after the transplant was lower after 1995, a clear difference persisted depending on donor source (Table 8). HLA-identical recipients had the lowest rate: 3.1%. However, the AR rate was also extremely low (6.7%) for child-to-parent transplants. This low rate may be explained by the age of these recipients; their mean (±SE) age was 60 ± 1 years, significantly older than any other group. For non-HLA-identical sibling transplants, the AR rate was lower for 1-haplo-match recipients (15.7%) than for 0-haplo-match recipients (22.2%). The highest AR rates were in parent-to-child recipients and living unrelated donor recipients.
Table 8. RECIPIENTS WITH ≥1 ACUTE REJECTION EPISODE WITHIN 6 MONTHS POSTTRANSPLANT
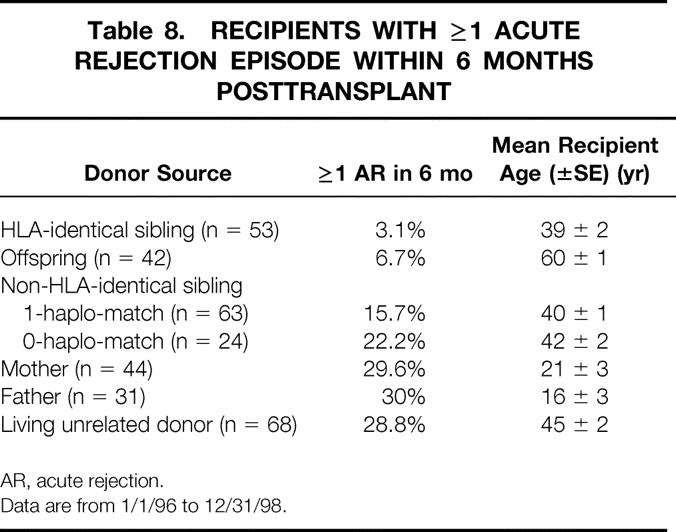
AR, acute rejection.
Data are from 1/1/96 to 12/31/98.
Readmissions
Because of the increased success of solitary pancreas transplants, our program has evolved from routinely doing simultaneous pancreas and kidney transplants for all diabetic patients who want a pancreas transplant to doing simultaneous pancreas and kidney transplants only for those without a living kidney donor. For those with a living kidney donor, we do a living donor kidney transplant followed by a cadaver pancreas transplant. Thus, readmission for a pancreas transplant has become common.
Of our primary transplant recipients in the 1990s, 852 never received a pancreas transplant (either at the time of or after the kidney transplant). Of these, 306 (36%) never required readmission; 183 (21%) had one readmission; 150 (18%), two readmissions; 94 (11%), three readmissions; and 139 (16%), four or more readmissions. The average (±SE) number of readmissions was 1.9 ± 0.1. The average number of total readmission days was 12.4 ± 0.7.
The most common causes of a first readmission were an elevated serum creatinine level (admitted for evaluation) (n = 153), noncytomegalovirus infection (n = 111), drug toxicity or hypertension (n = 90), and cytomegalovirus infection (n = 47).
Complications
Differentiating posttransplant complications from expected complications in the age-adjusted general population is difficult. However, some posttransplant complications have previously been shown to be related to immunosuppression. In our population, at each year from 1 to 6 years after the transplant, 66% to 76% of primary recipients required antihypertensive medications. Posttransplant diabetes occurred in 37 (6.5%) recipients. Of these, 11 were treated with diet or oral medications and 26 with insulin. Of the 26 treated with insulin, 10 were able to discontinue the insulin after 2 weeks to 36 months (median 7 months). Of note, posttransplant diabetes was rare for recipients younger than 30 years old at the time of transplant.
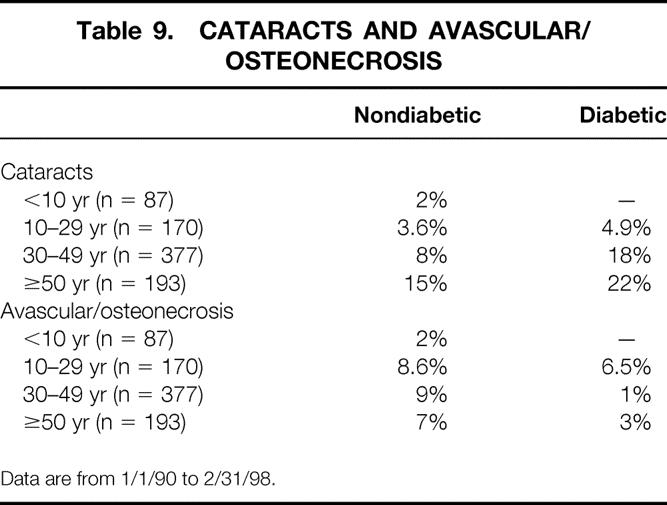
The incidence of two steroid-related complications, cataracts and avascular necrosis, by recipient age and presence or absence of diabetes is shown in Table 9. The incidence of cataracts, in both diabetic and nondiabetic recipients, increased in older recipients. Avascular necrosis occurred in 7% to 9% of nondiabetic recipients 10 years or older; the incidence was lower in diabetic recipients. Of those with avascular necrosis, 47% eventually developed bilateral joint disease. Treatment of the avascular necrosis on the primary side consisted of total hip replacement in 35% and core decompression in 10%. Of those with a hip replacement on one side, 33% required bilateral hip replacements.
Table 9. CATARACTS AND AVASCULAR/OSTEONECROSIS
Data are from 1/1/90 to 2/31/98.
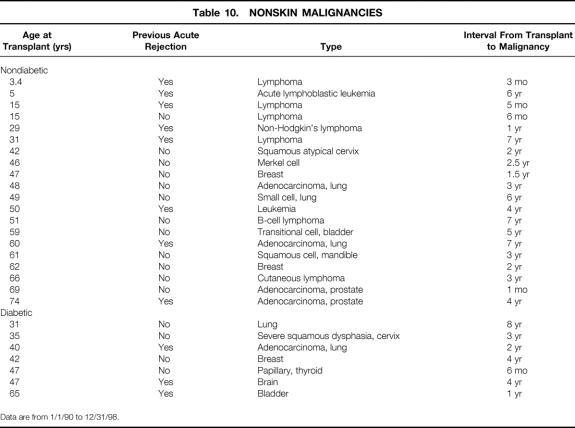
Thirty recipients (3%) were diagnosed with nonskin malignancies after the transplant (Table 10); of these, 23 (4%) were nondiabetic and 7 (1.9%) diabetic. One recipient diagnosed with prostate cancer 1 month after the transplant likely had the malignancy before the transplant. All recipients younger than 30 with tumors had either a lymphoma or leukemia.
Table 10. NONSKIN MALIGNANCIES
Data are from 1/1/90 to 12/31/98.
Employment
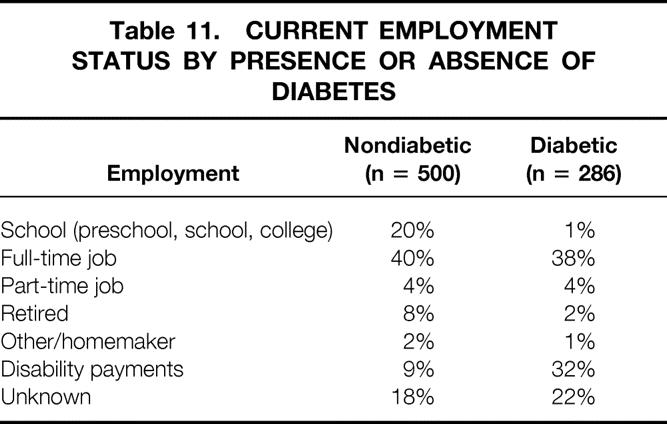
Employment status of primary living donor recipients since 1990, alive with graft function, is shown in Table 11 by presence or absence of diabetes. In total, 13% are going to school, 38% are working full-time, 4% are working part-time, 7% are retired, and 17% receive disability payments. About 20% did not return their annual employment questionnaire. A higher percentage of nondiabetic recipients are still going to school, because diabetes is a rare cause of end-stage renal disease in school-age children. In addition, a higher percentage of diabetic recipients receive disability payments. However, a similar percentage of diabetic and nondiabetic recipients are working full- or part-time.
Table 11. CURRENT EMPLOYMENT STATUS BY PRESENCE OR ABSENCE OF DIABETES
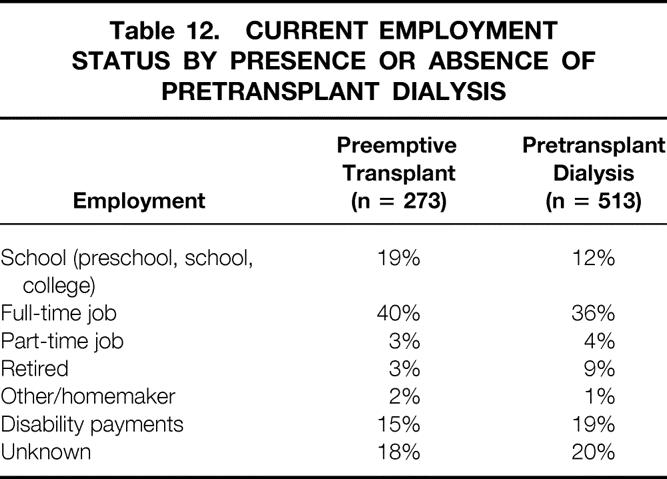
We found no significant differences in employment status between those having a preemptive transplant versus those receiving pretransplant dialysis (Table 12). We then grouped recipients having pretransplant dialysis by the duration of dialysis. Of those who had dialysis for more than 1 year before the transplant, only 24% are currently working.
Table 12. CURRENT EMPLOYMENT STATUS BY PRESENCE OR ABSENCE OF PRETRANSPLANT DIALYSIS
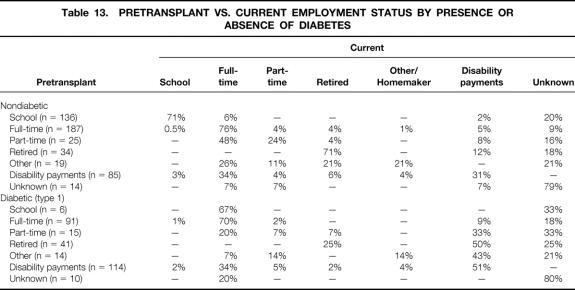
Current employment status, by pretransplant employment status, is shown for nondiabetic and diabetic recipients in Table 13. Of those working full-time before the transplant, 76% of nondiabetic and 70% of diabetic recipients are still working full-time. Of those working part-time before the transplant, 72% of nondiabetic recipients and 27% of diabetic recipients are still working full- or part-time. Of those receiving disability payments before the transplant, 34% of both diabetic and nondiabetic recipients are now working full-time.
Table 13. PRETRANSPLANT VS. CURRENT EMPLOYMENT STATUS BY PRESENCE OR ABSENCE OF DIABETES
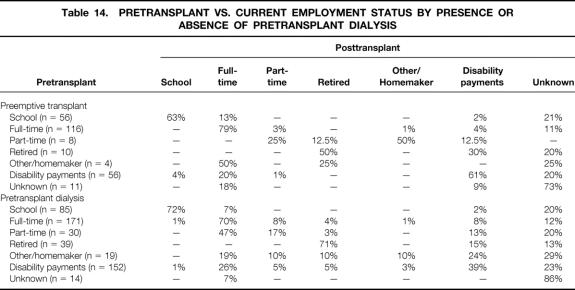
Pretransplant versus current employment status by presence or absence of pretransplant dialysis is shown in Table 14. Of those having a preemptive transplant who worked full-time before the transplant, 79% are currently working full-time; of those having pretransplant dialysis who worked full-time before the transplant, 70% are currently working. For both groups, 20% or more of those receiving disability payments before the transplant are currently working full-time.
Table 14. PRETRANSPLANT VS. CURRENT EMPLOYMENT STATUS BY PRESENCE OR ABSENCE OF PRETRANSPLANT DIALYSIS
Risk Factors Affecting Short- and Long-Term Graft Survival
Our multivariate analysis showed that the only risk factor for decreased 1-year graft survival was DGF (relative risk [RR] = 9.5, P = .0001). There was a suggestion that one or more AR episodes affected survival (RR = 1.5, P = .07).
For recipients with 1-year graft survival, risk factors for worse long-term survival were pretransplant smoking (RR = 2.1, P = .0001), pretransplant peripheral vascular disease (RR = 1.7, P = .01), pretransplant dialysis for more than 1 year (vs. preemptive transplant) (RR = 1.6, P < .02), one or more AR episodes (RR = 3.4, P = .0001), and donor age more than 55 (RR = 1.6, P = .03).
DISCUSSION
The outcome for kidney transplant recipients has markedly improved in the past four decades. This improvement has occurred despite expansion of the criteria for acceptance as a transplant candidate (e.g., older age) and a change in the donor population to include unrelated donors.
This improved outcome is due to a multitude of reasons. First, immunosuppressive protocols have improved. Not only are new agents available, but also there has been time to learn their judicious use. As a consequence, the incidence of AR episodes has markedly decreased; graft loss to AR has become rare. Second, the importance of infection in general, and of cytomegalovirus infection in particular, has been recognized. Protocols have been developed to decrease the incidence of cytomegalovirus infection, and for recipients developing infections, more effective treatment regimens have emerged. Third, recipients are not as sick when admitted for a transplant. Dialysis techniques have improved over time; the use of erythropoietin has allowed candidates to remain healthier. In addition, screening regimens for transplant candidates have improved. For example, we now recognize that cardiovascular disease was often responsible for early posttransplant deaths in recipients with good renal function, a recognition that has led to more thorough screening (including angiography). 24 Candidates whose evaluation uncovers treatable disease now undergo pretransplant treatment. As a consequence, patient survival rates have improved.
The outcome has significantly improved for both cadaver and living donor recipients, but living donor recipients continue to have better long-term patient and graft survival rates (vs. cadaver donor recipients). This better outcome was originally attributed to genetic matching: in the past, almost all living donors were relatives. However, many recent studies have noted that living unrelated donor recipients have outcomes similar to those of non-HLA-identical living related donor recipients. 26,27 Thus, the major advantages of living donor transplants are likely due to the process itself: the ability to evaluate the donor fully, the opportunity to schedule surgery electively when both donor and recipient are in optimal condition, and the minimal ischemic time such that DGF is relatively rare. In fact, the subset of cadaver donor recipients with excellent immediate posttransplant function have outcomes similar to living donor recipients. 28
We believe that our results are what can be expected with optimization of cyclosporine, azathioprine, and prednisone immunosuppression. When cyclosporine was introduced, long-term nephrotoxicity was a considerable concern, so we and others developed immunosuppressive protocols that limited the cyclosporine dose. During the past two decades, we have learned that low cyclosporine trough levels in the first few months are associated with an increased incidence of AR episodes, and that AR is a major risk factor for biopsy-proven CR. Therefore, we have incrementally increased targeted cyclosporine trough levels. In the mid-1990s, our retrospective studies showed that recipients with cyclosporine trough levels of more than 150 ng/mL (by high-performance liquid chromatography) for the first 3 months had a lower incidence of AR in the first 6 months than those with levels of less than 150 ng/mL. 18,19 Since then, we have aimed to keep levels at more than 150 ng/mL for the first 3 months. Nonetheless, depending on donor type, up to 29.6% of recipients still have one or more AR episodes in the first 6 months. We have used cyclosporine trough levels, easily obtained for both inpatients and outpatients, to optimize the cyclosporine dose. Others have argued that use of the area under the curve (of cyclosporine level vs. time) or a 2-hour postdose measurement is a better method to optimize the dose. 29–31
Importantly, our incidence of AR depends on the donor source and, to some extent, on recipient age. With cyclosporine, azathioprine, and prednisone immunosuppression, only 3.1% of HLA-identical recipients and 6.7% of child-to-parent recipients had AR in the first 6 months. Other donor categories were associated with an AR rate of 15% or more in the first 6 months after the transplant. Based on these analyses, we have recently changed our immunosuppressive protocol (except for HLA-identical or child-to-parent recipients) from cyclosporine, azathioprine, and prednisone to cyclosporine, MMF, and prednisone. 32
Of living donor recipients in our entire series who currently have functioning grafts, only 16% are known to be receiving disability payments (employment status is unknown for 20%). For those transplanted in the 1990s, 9% of nondiabetic and 32% of diabetic recipients are receiving disability payments. Previous studies have shown that for patients with end-stage renal disease, the ability to work full- or part-time is significantly more common and that quality of life is significantly better after a successful transplant (vs. dialysis).
In addition to the ongoing evaluation of our immunosuppressive protocols, discussion continues at our institution regarding transplant candidate selection. Clearly, if only ideal candidates are transplanted, the long-term outcome will be better. This fact is of increasing significance with our aging end-stage renal disease population; more patients have comorbidity. Complicating the issue, long-term dialysis is associated with acceleration of cardiovascular disease. Because center-specific transplant results are currently being published for government, insurance company, and public scrutiny, there is subtle pressure not to transplant high-risk candidates. However, for each individual, the potential outcome, in terms of survival and quality of life, may be far superior with a transplant than dialysis. Our policy has been to discuss the treatment alternatives with each transplant candidate and all potential donors. If a high-risk candidate has a potential donor who understands the recipient’s risks (including possibly decreased life expectancy) and who still wishes to donate, we proceed with the transplant. We believe that the ethical argument in these situations is somewhat different than with cadaver donors, where allocation and utility issues are also important.
Although much progress has been made, continued improvement is still necessary. Recipients still die as a consequence of end-stage renal disease, transplantation, and immunosuppression. For example, although our incidence of posttransplant lymphoproliferative disease in living donor recipients is low (<0.01%), deaths resulting from posttransplant lymphoproliferative disease are clearly transplant-related. In addition, recipients continue to have significant complications. Our recipients transplanted in the 1990s have required 1.9 ± 0.1 readmissions, for which they have spent an average of 12.4 ± 0.7 days in the hospital. Only 36% have not required at least one readmission. Immunosuppression-related complications such as cytomegalovirus disease, cataracts, osteonecrosis, and hypertension continue to affect a significant proportion of the population. Veenstra et al 33 recently estimated that steroid-related complications cost recipients an average of $5,300 over a 10-year period. One advantage for patients transplanted today is the increased number of immunosuppressive agents. Recipients experiencing side effects with one agent can often be switched to another equally powerful agent that has a different side effect profile.
Our multivariate analysis revealed several risk factors for worse short- and long-term outcome. Such information is important in developing protocols for the care of future transplant recipients. The only statistically significant risk factor for decreased 1-year graft survival was DGF (P < .0001). Although DGF is less common after living (vs. cadaver) transplants, its consequences are severe. Every effort should be made during the donor operation to ensure excellent diuresis before clamping the donor vessels. For recipients with DGF, immunosuppressive protocols should be tailored to prevent AR. The combination of AR and DGF is particularly devastating. 34
For recipients with at least 1-year graft survival, we noted several significant risk factors for worse long-term outcome. Those with pretransplant cardiac or peripheral vascular disease and those who smoked before the transplant had worse graft survival. Cosio et al 35 recently showed a dramatic decrease in posttransplant patient survival rates in recipients who smoked before the transplant. What can be done to improve the outcome for such recipients? First, those with pretransplant cardiac or peripheral vascular disease should be aggressively screened to identify any treatable cardiac lesions. If lesions are identified, they should be treated before the transplant. Such an approach has decreased the posttransplant death rate in diabetic transplant recipients. Second, for candidates waiting for a transplant, hyperlipidemia and hypertension should be aggressively managed. Third, if there is a long interval (>1 year) between initial evaluation and the transplant, candidates should undergo reevaluation. 12 Finally, all transplant candidates should be strongly encouraged to stop smoking.
Recipients having more than 1 year of pretransplant dialysis had worse long-term graft survival rates and were less likely to be working after the transplant than those having preemptive transplants or those with less than 1 year of pretransplant dialysis. One possibility is that “sick” patients required longer pretransplant evaluation or had to wait longer before a potential living donor volunteered. Alternatively, prolonged dialysis or an increased duration of end-stage renal disease had a significant negative effect. Obviously, one potential advantage of a living donor transplant is the opportunity to do it preemptively. For transplant candidates with living donors, the transplant should be done as soon as possible.
Donor age older than 55 was an additional risk factor in this analysis. Our previous analysis showed that for living donor transplants, increased donor age was not a risk. 36 However, based on our current analysis, donor age should be considered when there is more than one potential donor.
The biggest risk for worse long-term outcome was for recipients having one or more AR episode (RR = 3.4, P < .0001). Clearly, immunosuppressive protocols need to be designed to minimize the incidence of AR while still minimizing recipient complications. Our previous analysis showed the importance of monitoring adequate cyclosporine blood levels (≥150 ng/mL in the first 3 months after the transplant).
Receiving a living (vs. cadaver) donor kidney is a significant advantage. Both short- and long-term results are better. A disadvantage of living donation is that donors undergo a major operation that they do not need. Clearly, donors are not better off with one kidney rather than two. However, considerable data support the concept that an individual with one normal kidney can lead a normal life 11 : children born with one normal kidney live a normal life; children or adolescents who have a kidney removed because of a tumor or trauma live a normal life (if the remaining kidney is normal); and donors followed up for 20 to 30 years do not have an increased incidence of kidney disease compared with their brothers and sisters who did not donate. 37 Kidney donors do not have trouble getting life insurance, and insurance rates are not increased after donation. 38 Although donation carries no physical benefit, studies have shown a psychological benefit: an increase in self-esteem. 39 In addition, donor evaluation has revealed previously unrecognized and treatable medical problems. 40
Nonetheless, donation is associated with complications and even death. The death rate has been estimated to be 0.03%;37,41 the most common cause of death has been pulmonary embolism. The complication rate in recent series has been low. We noted a 0.2% major complication rate and 8% minor complication rate. 42 Median hospital stay has been 4 days. Throughout the years, nephrectomy has commonly been done via a flank incision. Development of laparoscopic techniques for donor nephrectomy may be associated with decreased hospital stays, less pain, and a more rapid return to work. 43
One advantage of a living donor transplant is that it can be scheduled before dialysis is instituted. A preemptive transplant saves the recipient (and the healthcare system) the cost and complications of dialysis-access surgery and of long-term dialysis. However, concern has been raised that a recipient who does not fully understand or has not experienced dialysis may be less compliant with the immunosuppressive regimen. We and others have previously shown that the outcome after preemptive transplants is as good as the outcome in patients who have received pretransplant dialysis. Our current data for patients transplanted in the 1990s show that 40% of those having preemptive transplants versus 36% of those having pretransplant dialysis are currently working full-time. However, of those who had dialysis for more than 1 year before the transplant, only 24% are currently working.
The biggest challenge in transplantation today is increasing the number of available organs. Although the outcome after living donor transplantation is better than after cadaver donor transplantation, the number of living donor kidney transplants done annually was unchanged for years because of the reluctance of transplant personnel to put a potential donor through a major and unnecessary operation. However, because of the rapidly growing waiting list for cadaver transplants and the increasingly longer wait, most centers are now willing to advocate living donation. In the past 2 years, the number of living donor transplants in the United States has increased. Much of this increase followed the recognition that living unrelated donor recipients had outcomes similar to those of living related non-HLA-identical donor recipients.
Both registry and single-center data show excellent short- and long-term graft survival for living unrelated donor (vs. cadaver donor) transplants. Further increasing the number of living donor transplants will require both innovative approaches and continued public education. For example, Park et al 44 have developed a paired exchange program for recipients with a willing but incompatible donor (ABO or positive cross-match). At the time of their latest report, 110 exchanges had been done; results were identical to those of the living unrelated donor transplants.
Jordan et al 45 have used intravenous immunoglobulin to eliminate antidonor cytotoxin antibodies in cases of a donor-specific positive cross-match. If the cross-match became negative after intravenous immunoglobulin administration, a transplant could be successfully done. Others have developed protocols for transplanting blood type A2 kidneys into blood type O or B recipients. 46 Radcliffe-Richards et al 47 have suggested reopening the discussion about living donors selling kidneys.
In conclusion, the outcome of kidney transplants has continually improved in the 1990s. With current immunosuppressive protocols, graft loss to AR is rare. CR and death with function are the predominant causes of graft loss. Infection and cardiovascular events are the predominant causes of death with function. Despite the improved outcome, most patients require at least one readmission and may have immunosuppression-related complications. Future effort needs to be directed at increasing the number of transplants and at further improving outcomes for new transplant recipients.
Acknowledgments
The authors thank Mary Knatterud for editorial assistance and Stephanie Daily for preparation of the manuscript.
Footnotes
Supported by NIH Grant #DK13083.
Correspondence: Arthur J. Matas, MD, MMC 328 Mayo, 420 Delaware St. S.E., Minneapolis, MN 55455.
E-mail: matas001@tc.umn.edu
Accepted for publication October 6, 2000.
References
- 1.Murray JE, Merrill JP, Harrison JH. Renal homotransplantation in identical twins. Surg Forum 1955; 6: 432–436. [PubMed] [Google Scholar]
- 2.Merrill JP, Murray JE, Harrison JH, et al. Successful homotransplantation of the human kidney between identical twins. JAMA 1956; 160: 277–282. [DOI] [PubMed] [Google Scholar]
- 3.Schwartz R, Dameshek W. The effects of 6-mercaptopurine on homograft reactions. J Clin Invest 1960; 39: 952–958. [DOI] [PMC free article] [PubMed] [Google Scholar]
- 4.Starzl TE, Marchioro TL, Porter KA, et al. The use of heterologous antilymphoid agents in canine renal and liver homotransplantation and in human renal homotransplantation. Surg Gynecol Obstet 1967; 124: 301–318. [PMC free article] [PubMed] [Google Scholar]
- 5.Kries H. Why living donors should not be used whenever possible. Transplant Proc 1985; 17: 1510–1514. [Google Scholar]
- 6.Woodruff MFA. Ethical problems in organ transplantation. Br Med J 1964; 1: 1457–1460. [DOI] [PMC free article] [PubMed] [Google Scholar]
- 7.Starzl TE. Living donors: con. Transplant Proc 1987; 19 (1 Pt 1):174–175. [PubMed] [Google Scholar]
- 8.Spital A. Ethical and policy issues in altruistic living and cadaveric organ donation. Clin Transplant 1997; 11: 77–87. [PubMed] [Google Scholar]
- 9.Najarian JS, Kaufman DB, Fryd DS, et al. Long-term survival following kidney transplantation in 100 type I diabetic patients. Transplantation 1989; 47: 106–113. [DOI] [PubMed] [Google Scholar]
- 10.Doyle SE, Matas AJ, Gillingham K, et al. Predicting clinical outcome in the elderly renal transplant recipient. Kidney Int 2000; 57: 2144–2150. [DOI] [PubMed] [Google Scholar]
- 11.Jones J, Payne WE, Matas AJ. The living donor: risks, benefits, and related concerns. Transplant Rev 1993; 7: 115–128. [Google Scholar]
- 12.Manske CL, Wilson RF, Wang Y, et al. Prevalence of, and risk factors for, angiographically determined coronary artery disease in type I-diabetic patients with nephropathy. Arch Intern Med 1992; 152: 2450–2455. [PubMed] [Google Scholar]
- 13.Manske CL, Thomas W, Wang Y, et al. Screening diabetic transplant candidates for coronary artery disease: identification of a low risk subgroup. Kidney Int 1993; 44: 617–621. [DOI] [PubMed] [Google Scholar]
- 14.Matas AJ, Kasiske B, Miller L. Proposed guidelines for re-evaluation of patients on the waiting list for cadaver transplantation. Transplant 2000 joint meeting of American Society of Transplant Surgeons and American Society of Transplantation.
- 15.Opelz G, Terasaki PI. Prolongation effect of blood transfusions on kidney graft survival. Transplantation 1976; 22: 380–383. [DOI] [PubMed] [Google Scholar]
- 16.Sutherland DE, Fryd DS, So SK, et al. Long-term effect of splenectomy versus no splenectomy in renal transplant patients. Reanalysis of a randomized prospective study. Transplantation 1984; 38: 619–624. [DOI] [PubMed] [Google Scholar]
- 17.Najarian JS, Fryd DS, Strand M, et al. A single-institution, randomized, prospective trial of cyclosporine versus azathioprine-antilymphocyte globulin for immunosuppression in renal allograft recipients. Ann Surg 1985; 201: 142–157. [DOI] [PMC free article] [PubMed] [Google Scholar]
- 18.Matas AJ, Gillingham KJ, Chavers BM, et al. The importance of early cyclosporine levels in pediatric kidney transplantation. Clin Transplant 1996; 10: 482–486. [PubMed] [Google Scholar]
- 19.Johnson EM, Canafax DM, Gillingham KJ, et al. Effect of early cyclosporine levels on kidney allograft rejection. Clin Transplant 1997; 11: 552–557. [PubMed] [Google Scholar]
- 20.Almond PS, Gillingham KJ, Matas AJ, et al. Risk factors for chronic rejection in renal allograft recipients. Transplantation 1993; 55: 752–757. [DOI] [PubMed] [Google Scholar]
- 21.Basadonna GP, Matas AJ, Gillingham KJ, et al. Early versus late acute renal allograft rejection: impact on chronic rejection. Transplantation 1993; 55: 993–995. [DOI] [PubMed] [Google Scholar]
- 22.Simmons RL, Matas AJ, Rattazzi LC, et al. Clinical characteristics of the lethal cytomegalovirus infection following renal transplantation. Surgery 1977; 82: 537–546. [PubMed] [Google Scholar]
- 23.Dunn DL, Gillingham KJ, Kramer MA, et al. A prospective randomized study of acyclovir versus ganciclovir plus human immune globulin prophylaxis of cytomegalovirus infection after solid organ transplantation. Transplantation 1994; 57: 876–884. [DOI] [PubMed] [Google Scholar]
- 24.Gehan EA. A generalized Wilcoxon test for comparing arbitrarily singly-censored samples. Biometrika 1965; 52: 203–223. [PubMed] [Google Scholar]
- 25.Matas AJ, Gillingham KJ, Sutherland DE. Half-life and risk factors for kidney transplant outcome: importance of death with function. Transplantation 1993; 55: 757–761. [DOI] [PubMed] [Google Scholar]
- 26.Park K, Kim Y-SM, Kee E-M, et al. Single-center experience of unrelated living donor renal transplantation in the cyclosporine era. In: Clinical Transplants 1992. Los Angeles: UCLA Tissue Typing Laboratory; 1993: 249–256. [PubMed]
- 27.Terasaki PI, Cecka JM, Gjertson DW, Takemoto S. High survival rates of kidney transplants from spousal and living unrelated donors. N Engl J Med 1995; 333: 333–336. [DOI] [PubMed] [Google Scholar]
- 28.Najarian JS, Gillingham KJ, Sutherland DE, et al. The impact of the quality of initial graft function on cadaver kidney transplants. Transplantation 1994; 57: 812–816. [DOI] [PubMed] [Google Scholar]
- 29.Cantarovich M, Elstein E, deVarennes B, et al. Clinical benefit of Neoral dose monitoring with cyclosporine 2-hr post-dose levels compared with trough levels in stable heart transplant patients. Transplantation 1999; 68: 1839–1842. [DOI] [PubMed] [Google Scholar]
- 30.Mahalati K, Lawen J, Kiberd B, et al. Is 3-hour cyclosporine blood level superior to trough level in early post-renal transplantation period? J Urol 2000; 163: 37–41. [PubMed] [Google Scholar]
- 31.Senel MF, Van Buren CT, Welsh M, et al. Impact of early cyclosporin average blood concentration on early kidney transplant failure. Transplant Int 1998; 11: 46–52. [DOI] [PubMed] [Google Scholar]
- 32.Kim YS, Moon JI, Kim SI, et al. Clear benefit of mycophenolate mofetil-based triple therapy in reducing the incidence of acute rejection after living donor renal transplantations. Transplantation 1999; 68: 578–581. [DOI] [PubMed] [Google Scholar]
- 33.Veenstra DL, Best JH, Hornberger J, et al. Incidence and long-term cost of steroid-related side effects after renal transplantation. Am J Kidney Dis 1999; 33: 829–839. [DOI] [PubMed] [Google Scholar]
- 34.Troppmann C, Gillingham KJ, Benedetti E, et al. Delayed graft function, acute rejection, and outcome after cadaver renal transplantation. The multivariate analysis. Transplantation 1995; 59: 962–968. [DOI] [PubMed] [Google Scholar]
- 35.Cosio FG, Falkenhain ME, Pesavento TE, et al. Patient survival after renal transplantation: II. The impact of smoking. Clin Transplant 1999; 13: 336–341. [DOI] [PubMed] [Google Scholar]
- 36.Kerr SR, Gillingham KJ, Johnson EM, et al. Living donors >55 years: to use or not to use? Transplantation 1999; 67: 999–1004. [DOI] [PubMed] [Google Scholar]
- 37.Najarian JS, Chavers BM, McHugh LE, et al. 20 years or more of follow-up of living kidney donors. Lancet 1992; 340 (8823): 807–810. [DOI] [PubMed] [Google Scholar]
- 38.Spital A, Kokmen T. Health insurance for kidney donors: how easy is it to obtain? Transplantation 1996; 62: 1356–1358. [DOI] [PubMed] [Google Scholar]
- 39.Johnson EM, Anderson JK, Jacobs C, et al. Long-term follow-up of living kidney donors: quality of life after donation. Transplantation 1999; 67: 717–721. [DOI] [PubMed] [Google Scholar]
- 40.Jones JW, Halldorson J, Elick B, et al. Unrecognized health problems diagnosed during living donor evaluation: a potential benefit. Transplant Proc 1993; 25: 3083–3084. [PubMed] [Google Scholar]
- 41.Bay WH, Hebert LA. The living donor in kidney transplantation. Ann Intern Med 1987; 106: 719–727. [DOI] [PubMed] [Google Scholar]
- 42.Johnson EM, Remucal MJ, Gillingham KJ, et al. Complications and risks of living donor nephrectomy. Transplantation 1997; 64: 1124–1128. [DOI] [PubMed] [Google Scholar]
- 43.Ratner LE, Ciseck LJ, Moore RG, et al. Laparoscopic live donor nephrectomy. Transplantation 1995; 60: 1047–1049. [PubMed] [Google Scholar]
- 44.Park K, Moon JI, Kim SI, et al. Exchange donor program in kidney transplantation. Transplantation 1999; 67: 336–338. [DOI] [PubMed] [Google Scholar]
- 45.Jordan SC, Tyan D, Czer L, Toyada M. Immunomodulatory actions of intravenous immunoglobulin (IVIG): potential applications in solid organ transplant recipients. Pediatr Transplant 1998; 2: 92–105. [PubMed] [Google Scholar]
- 46.Alkhunaizi AM, De Mattos AM, Barry JM, et al. Renal transplantation across the ABO barrier using A2 kidneys. Transplantation 1999; 67: 1319–1324. [DOI] [PubMed] [Google Scholar]
- 47.Radcliffe-Richards J, Daar AS, Guttmann RD, et al. The case for allowing kidney sales. Lancet 1998; 351: 1950–1952. [DOI] [PubMed] [Google Scholar]


