

Abstract
Objective
To assess 5-aminolevulinic acid (ALA)-induced protoporphyrin IX accumulation and fluorescence in peritoneal colon carcinoma metastases and its benefits for laparoscopic fluorescence diagnosis.
Summary Background Data
Occult, macroscopically nonvisible peritoneal micrometastases can be missed in laparoscopy or open surgery. Laparoscopic fluorescence diagnosis allows detection of these lesions after intraperitoneal lavage with ALA and subsequent fluorescence induction by blue-light excitation.
Methods
A disseminated peritoneal carcinosis was induced by laparoscopic implantation of colon carcinoma cells (CC531) in the peritoneum of 55 WAG/Rij rats. After 12 days of tumor growth the animals were randomized into 11 groups with different photosensitization parameters. Peritoneal lavage was performed either with 1.5% or 3.0% ALA solution, except for one control group. Photosensitization times were 0.5, 1, 2, 4, or 8 hours. Spectrometry was performed using an optical multichannel analyser. ALA and protoporphyrin IX serum levels were measured by high-performance liquid chromatography to determine systemic load.
Results
Protoporphyrin IX tumor accumulation and fluorescence peaked 2 to 4 hours after ALA application in both main groups, 1.5% and 3.0% ALA. Tumor detection rate was most effective in the 1.5% ALA group. Compared with conventional white-light laparoscopy alone, blue-light excitation detected 35% additional intraabdominal tumor foci.
Conclusions
Laparoscopic fluorescence diagnosis can increase the sensitivity and specificity of diagnostic staging laparoscopy. It allows determination of the extent of peritoneal carcinosis. Improved preoperative assessment helps to avoid unnecessary laparotomies and radical resections.
Accurate staging is essential to plan therapeutic strategies and appropriate surgical treatment in patients with advanced gastrointestinal malignancies. Tremendous efforts have been undertaken to develop more sensitive techniques for the detection of premalignant, early-stage lesions and micrometastases. Despite the improvements in preoperative radiologic imaging, precise assessment of the local, regional, or distant extent of the primary tumor can be a major problem. Even with computed tomography, magnetic resonance tomography, or ultrasound, minimal tumor spread remains undetected. 1 Laparoscopy has emerged as a highly sensitive and specific method of comprehensive abdominal exploration, 2–4 but even with this staging tool an unknown amount of lesions still remain occult.
Fluorescence diagnosis, also known as photodynamic diagnosis, is being increasingly used to distinguish healthy from diseased tissue in various medical disciplines. Especially in urology, fluorescence diagnosis has been used to visualize even small, plane tumors of the bladder. The principle of fluorescence diagnosis is based on the accumulation of administered agents, called photosensitizers, in malignant cells. After intravenous, oral, or topical application, the agent concentrates in tumors and remains inactive until exposed to light of a specific wavelength. When light is delivered to the cancer site, either directly or indirectly through a fiberoptic device, it causes fluorescence of the photosensitizers. Whereas earlier generations of photosensitizers, such as Photofrin, were fluorescent at the time of application (exogenous photosensitizers), the photosensitizer aminolevulinic acid (ALA) requires endogenous metabolism before it becomes fluorescent (endogenous photosensitizer). ALA is the natural precursor of the heme pathway. Administration of ALA, either systemically or locally, overloads the last step in the heme biosynthesis pathway of tumor cells because of missing negative feedback mechanisms and reduced enzymatic activities. This results in increased accumulation of ALA’s metabolite protoporphyrin IX. Protoporphyrin IX is a fluorescent agent when stimulated by a defined wavelength within its absorption spectrum. One main emission wavelength is within the visible light spectrum at 635 nm (red light) 5 (Fig. 1). The positive, red fluorescence of protoporphyrin IX is even detectable in macroscopically invisible tumor foci and can indicate lesions that would have been missed under conventional white-light illumination. Detection of fluorescence may be achieved by two distinct technical principles. In an imaging system, a two-dimensional picture of the fluorescence intensity distribution of the examined tissue is captured with a charge-coupled device (CCD) camera and displayed on a monitor. In a point system, the fluorescence signal is measured in a restricted area and spectrometrically evaluated with an optical multichannel analyzer.
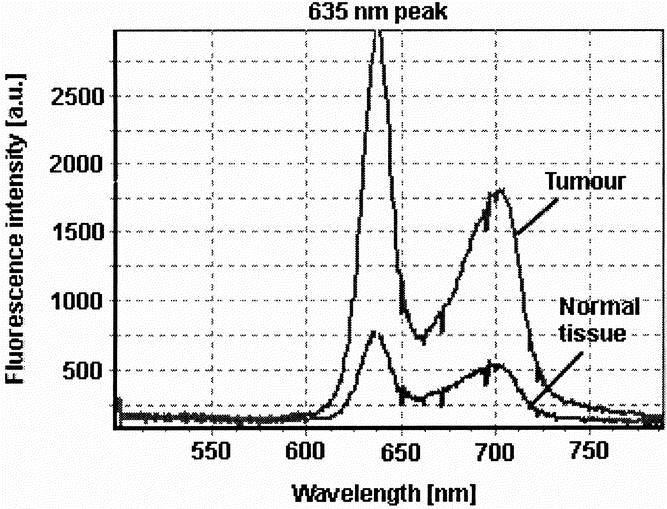
Figure 1. Typical protoporphyrin IX fluorescence emission spectra of tumor tissue (CC531 colon carcinoma) and surrounding healthy tissue (peritoneal muscle) with its typical peak at 635 nm and a lower secondary emission peak in the far red around 700 nm.
Fluorescence diagnosis for surgical staging laparoscopy was adopted to achieve better assessment of disseminated intraabdominal tumor spread. 6 This allowed early detection of dysplastic and malignant peritoneal changes caused by metastatic growth of gastrointestinal tumors. The feasibility of this modality in the detection of lesions occult to conventional white-light laparoscopy has been evaluated and confirmed as practicable in an experimental setting. The use of fluorescence laparoscopy increased the visualization of tumors by 17.5% compared with white-light laparoscopy. 6
In the pilot study, photosensitization parameters, such as an ALA concentration of 3.0% and a photosensitization time of 4 hours, were chosen according to data gained in urology. The following experimental study evaluated the variation of these two parameters to achieve optimal diagnostic results in the detection of peritoneal tumors. Both fluorescence detection techniques, the imaging and point system, were applied. Serum samples were investigated for ALA and protoporphyrin IX.
METHODS
All experiments were carried out in accordance with protocols approved by national experimental animal welfare institutions.
Tumor Model
Disseminated peritoneal carcinosis was induced in male WAG/Rij rats (n = 55; weight 230–340 g, mean 273 g) by laparoscopically controlled subperitoneal colon carcinoma cell inoculation (CC531; 5 × 10⁵ tumors cells in 1.5 mL RMPI-1640 medium; Sigma, Munich, Germany). The animals were anesthetized intraperitoneally using Ketanest (Parke-Davis, Freiburg, Germany) and diazepam (Valium; Roche, Grenzach, Germany). Subsequently, a 5.5-mm trocar with an insufflation side port was inserted in the midline of the lower abdomen of the animal. After creating a carbon dioxide pneumoperitoneum (pmax 5 mm Hg) a 4-mm laparoscope (Hopkins II, 12°, Karl Storz, Tuttlingen, Germany) connected to a modified CCD camera (Telecam, Karl Storz) was introduced through the trocar to visualize the abdominal cavity. Under careful laparoscopic observation, the tumor cell suspension was transcutaneously injected with a 40-mm 21-g needle under the thin peritoneal layer at about 10 different sites. After tumor inoculation, the animals were kept under standard laboratory conditions with free access to water and food in a 12-hour light/dark schedule. Twelve days of tumor growth was found to be adequate for multilocular intraperitoneal tumor growth and induction of a disseminated peritoneal carcinosis in the animals.
Photosensitization
The animals were randomly divided into 11 groups of five each. After reaching an advanced tumor stage, local photosensitization was achieved by peritoneal lavage with 5 mL ALA solution (pH 6.5, Medac, Wedal, Germany) of two different concentrations (1.5% and 3.0%). Photosensitization times (interval between ALA application and fluorescence laparoscopy) of 0.5, 1, 2, 4, and 8 hours were chosen. The animals were then kept under subdued light conditions to avoid photobleaching and phototoxic reactions.
Fluorescence Laparoscopy (Imaging System)
Conventional white-light laparoscopy followed by fluorescence laparoscopy was performed after the photosensitization interval using the D-Light system (Karl Storz). The system is based on a 300-W xenon short-arc lamp with special optical properties to focus high intensities of light into a light guide for endolaparoscopic use. Two different illumination modes are possible: a conventional white-light mode for standard endoscopic/laparoscopic procedures and a specific blue light (380–440 nm) mode for protoporphyrin IX fluorescence excitation. The modes can easily be switched any time by a footswitch or directly by a button on the CCD camera head. The fundamental principle of fluorescence diagnosis is to exploit the optimal optical contrast between the fluorescent tumor and its surrounding healthy, nonfluorescent or less-fluorescent tissue. To enhance the emitted fluorescence of the tumor, special spectral filters (cutoff or long-pass filters;Fig. 2) in the laparoscope eyepiece block the blue excitation light. They allow only a defined part of the blue light to reach the examiner’s eye and the detection camera, resulting in a red–blue contrast between tumor and normal tissue.
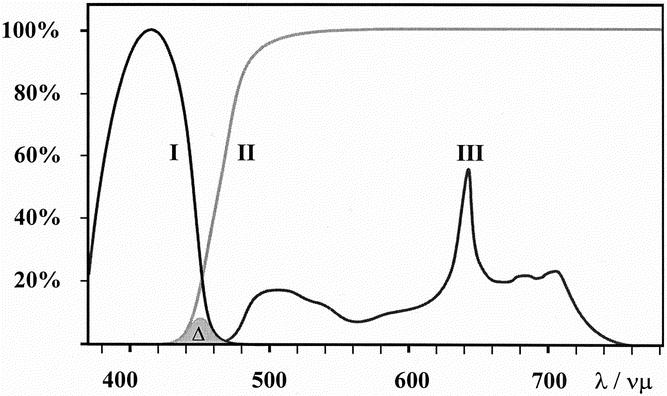
Figure 2. Optical characteristics of the D-Light system (Karl Storz, Tuttlingen, Germany) for fluorescence detection. Blue excitation (380–440 nm) light (I) is blocked by an observation filter in the scope eyepiece (II). A strictly defined amount of blue light (approximately 2%) passes the filter (Δ). This allows color contrast and orientation in the fluorescence negative areas. The protoporphyrin IX spectrum is shown in (III) with the typical peak at 635 nm and a lower secondary emission peak in the far red around 700 nm.
First, a complete examination of the entire abdominal cavity was performed using white light. All tumors detected were counted and the exact location of the tumors was mapped. The same procedure was performed in the fluorescence mode. Previously detected tumors were evaluated according to their fluorescence aspect and the peritoneum was examined for additional fluorescent tumors. All detected tumors were categorized according to their fluorescence characteristics into three groups: M tumors were macroscopically visible and not fluorescent (false-negative tumors); MF tumors were macroscopically visible and fluorescent; and F tumors were fluorescent but macroscopically not visible (representing the increased sensitivity of laparoscopy using fluorescence diagnosis).
Spectrometry (Point System)
After laparotomy the tumors were measured spectrometrically. The fiber used (Polytec, Waldbronn, Germany) consisted of a bifurcated fiber bundle with a central fiber of 200 μm in diameter for the excitation light and six peripheral fibers for the measurement of the fluorescence, resulting in an overall diameter of the fiber bundle of 700 μm. The excitation light of the D-Light was transferred to the tissue via one leg of the bifurcated fiber bundle. The common tip of the fiber was brought in contact with the lesion and the second leg of the fiber was connected with an optical multichannel analyzer (Spectra Pro 300i, Polytec). Fluorescence was detected by a CCD camera (Quantix, Photometrics, Ottobrunn, Germany) over an integration time of 10 seconds. Spectral analysis was achieved using specific software (MAPS, Photometrics). Background signals were subtracted from the spectra and fluorescence intensities measured at one typical, maximal emission wavelength of protoporphyrin IX at 635 nm. From each tissue sample multiple spectral intensities were gained and averaged. A set of fluorescence spectra of normal peritoneal muscle tissue was collected to be used as a comparative baseline value. A fluorescence ratio was determined by comparing the fluorescence intensity of normal peritoneal tissue with the score measured of tumors. To guarantee constant spectrometric conditions, measurements of a standardized fluorescent body were conducted before and after each measurement and all spectra were normalized on these data.
Finally, all animals were killed under deep anesthesia, and the laparoscopic findings were confirmed by open inspection and palpation of the entire peritoneum. No additional tumor foci were found after laparotomy. All tumors identified in either white light or fluorescence were removed for histologic examination.
Analysis of ALA and Protoporphyrin IX in Serum
Blood samples were collected from the heart cavity and centrifuged for 10 minutes at 4°C, and the supernatants were kept at −20°C until analyzed.
ALA was determined in 25-μL serum samples by a fluorometric high-pressure liquid chromatography (HPLC) method using precolumn derivatization of ALA with acetylacetone and formaldehyde according to Tomokuni et al. 7 If the concentration of ALA exceeded 100 ng/mL, the sample was diluted with saline (1:12.5 by volume) before derivatization. The detection limit for ALA in serum was 3 ng/mL.
Protoporphyrin IX was quantified by a fluorometric HPLC method based on its native fluorescence after solvent precipitation of serum proteins. All reagents used were of HPLC or analytic grade. Protoporphyrin IX disodium salt and mesoporphyrin dihydrochloride were purchased from Sigma; methanol, glacial acetic acid, ammonium acetate, and acetonitrile were from Roth (Karlsruhe, Germany). Mesoporphyrin as an internal standard (200 ng/mL for protoporphyrin IX concentrations 5–200 ng/mL and 2,000 ng/mL for protoporphyrin IX concentrations 100–2,000 ng/mL) and 200 μL acetonitrile/methanol (1:2 by volume) were added to 100 μL serum. The mixture was vortex-mixed and centrifuged, and 40 μL of the supernatant was injected into the HPLC system. Analysis was performed with a Hewlett Packard 1050 series LC pump (Sindelfingen, Germany), a Shimadzu fluorescence detector (Kyoto, Japan), an autosampler, and a workstation equipped with Hyperdata Chromsoft (Bischoff, Leonberg, Germany). The chromatographic separation was carried out according to Guo et al 8 with the following modifications. Samples were eluted from a Hypersil ODS column (60 × 4.6 mm, particle size 3 μm, Ziemer, Langerwehe, Germany) at a flow rate of 0.8 mL/min with methanol/1 mol/L ammonium acetate buffer pH 5.16 (88:12 by volume) as the mobile phase. For detection, the excitation wavelength was 418 nm, and emission was recorded at 635 nm. Exposure to light was minimized during sample processing and analysis.
Two sets of five-point standard calibration curves (5–200 ng protoporphyrin IX/mL serum and 200 ng mesoporphyrin/mL serum, 100–2,000 ng protoporphyrin IX/mL serum and 2,000 ng mesoporphyrin/mL serum) and a particular blank were prepared for each run. The ratios of the peak areas to that of the internal standard were plotted against the amount of protoporphyrin IX. Each calibration line was calculated using the least-square method and was found to be highly linear (r > 0.995) for both calibration ranges chosen. The concentration of protoporphyrin IX was calculated from its peak area ratio directly from the calibration curve. The limit of detection was determined according to the IUPAC definition and was 3 ng protoporphyrin IX/mL serum.
RESULTS
There were no deaths or complications related to either tumor growth or laparoscopy in all groups. Our tumor model was reliable in establishing disseminated peritoneal carcinosis. The technically complex laparoscopic inoculation of the tumor cells was necessary to guarantee a homogenous and ubiquitous distribution of the tumor foci in the abdominal cavity. Size and number of tumors induced in all groups were comparable.
Fluorescence Laparoscopy (Imaging System)
The laparoscopic findings are shown in Table 1. All animals (n = 55) developed disseminated peritoneal carcinosis. Disseminated tumor growth was observed exclusively in the parietal peritoneum. The entire abdominal cavity could be assessed for laparoscopic inspection. A total of 463 peritoneal tumors of 0.1 to 2.0 cm in diameter were detected (Figs. 3 and 4).
Table 1. NUMBER OF TUMORS DETECTED BY THE IMAGING SYSTEM

ALA, 5-aminolevulinic acid; MF, macroscopically visible and fluorescent; F, fluorescent but macroscopically not visible.
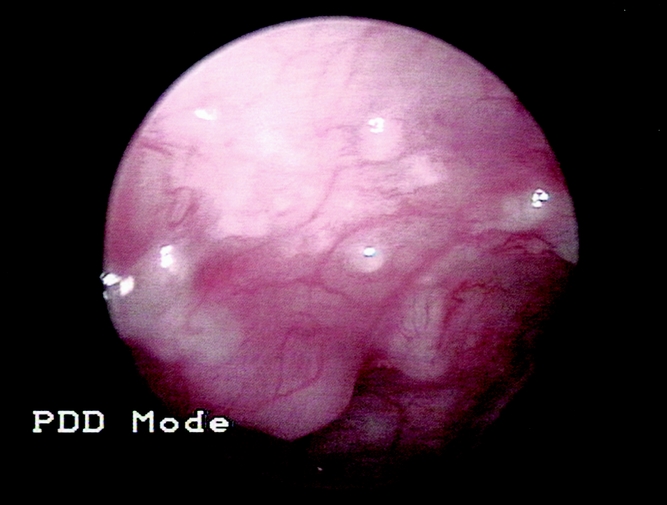
Figure 3. Laparoscopic view of peritoneal tumors visualized during conventional laparoscopy.
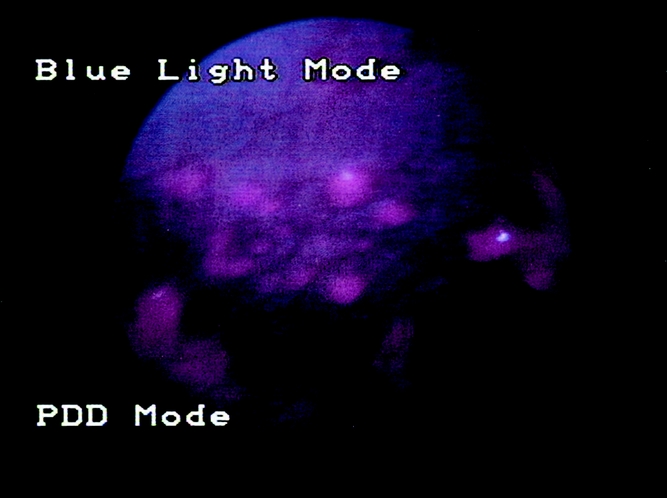
Figure 4. The same location under fluorescence laparoscopy, showing the typical red protoporphyrin IX fluorescence of the lesions.
M tumors were seen only after short photosensitization times up to 1 hour with both 1.5% and 3.0% ALA solution.
Fluorescence laparoscopy was able to detect tumor foci that were not visualized under conventional laparoscopy (F tumors). Small or plane lesions, inconspicuous under white light, were identified exclusively as a result of their characteristic red fluorescence. This increase in diagnostic sensitivity was dependent on the duration of photosensitization and the ALA concentration. F tumors, representing the diagnostic value of fluorescence laparoscopy as detected exclusively by fluorescence, reached highest percentages and absolute numbers after approximately 4 hours using 1.5% ALA solution and after approximately 2 to 4 hours using 3.0% ALA solution (Fig. 5). In direct comparison of both ALA concentrations, 1.5% ALA rendered superior results, with up to 35% of tumors detected only by fluorescence (vs. 23% using 3.0% ALA).

Figure 5. Increase of sensitivity by fluorescence diagnosis (F-tumors/total detected tumors).
Spectrometry (Point System)
The spectrometric results are shown in Figures 6 and 7. Spectrometry showed no major difference in the shape of the measured spectra between tumor and normal tissue (see Fig. 1). The site-to-site variation of each tissue sample was negligible: removing the fiber and replacing it altered the measured signal only slightly. Therefore, all spectra obtained from a single tissue sample were averaged.

Figure 6. Spectrometry: comparison of fluorescence intensities of tumors (T) and peritoneum (PE) using ALA 1.5%.

Figure 7. Spectrometry: comparison of fluorescence intensities of tumors (T) and peritoneum (PE) using ALA 3.0%.
In all groups, normalized fluorescence intensity scores at 635 nm were significantly higher in the tumor foci than in the normal peritoneal tissue (P < .01, Mann-Whitney test). Maximal fluorescence intensity scores were reached after 4 hours of photosensitization using 1.5% and 3.0% ALA solution in the tumors as well as in normal tissue. Fluorescence intensities of 1.5% ALA were slightly lower than after sensitization with 3.0% ALA.
The main difference between the two evaluated ALA concentrations was revealed by the fluorescence ratios. Using 1.5% ALA, the fluorescence ratio of peritoneal, normal tissue to tumor reached a contrast of up to 1:6 after photosensitizations times of 0.5 to 4 hours. A less constant ratio was seen using 3.0% ALA: ranging between 1:4 to 1:6 over comparable time intervals, the ratios were generally lower (see Figs. 6 and 7).
All tumors were resected after the examination and histologically confirmed as colon carcinomas; all samples considered healthy were tumor-free.
ALA and Protoporphyrin IX Serum Analysis
The protoporphyrin IX concentration in blood serum followed a similar kinetic as measured by spectrometry (Figs. 8 and 9). Maximal levels were reached after 4 hours, 1.5% ALA reaching even higher protoporphyrin IX concentrations. The 1.5% concentration of ALA also showed a more accentuated increase and decrease of the serum levels, resulting in a faster systemic elimination after 8 hours.
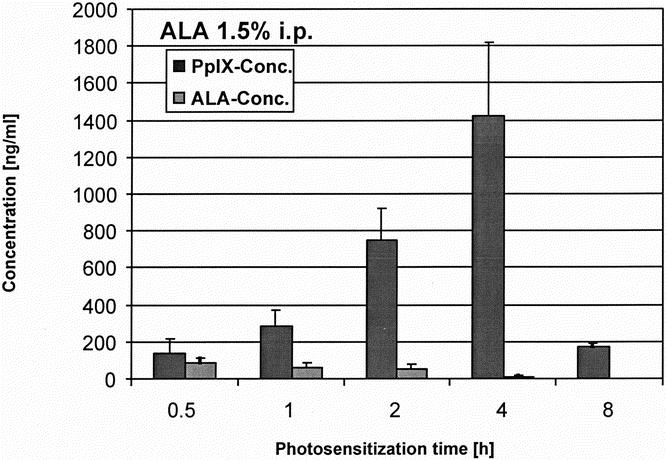
Figure 8. Serum load of ALA and PpIX measured by HPLC after photosensitization with ALA 1.5%.
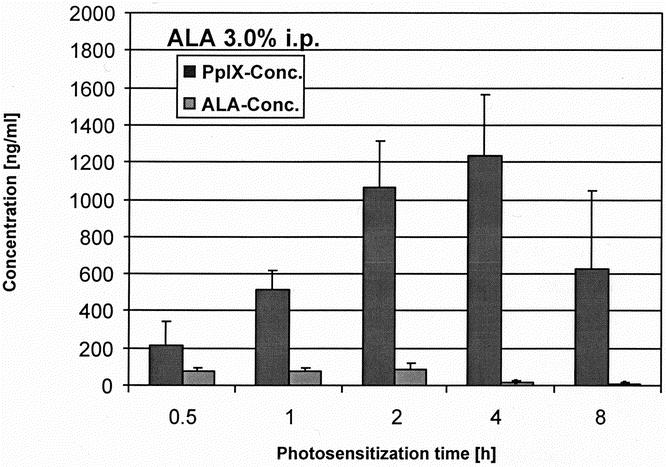
Figure 9. Serum load of ALA and PpIX measured by HPLC after photosensitization with ALA 3.0%.
DISCUSSION
The development of fluorescence diagnosis has been mainly encouraged by the needs of urologists. Endoscopic detection of fluorescence using locally administered ALA was described for the detection of early bladder cancer several years ago. The results of these studies indicate that porphyrin-induced fluorescence increases the sensitivity to detect plane urothelial lesions, such as dysplasias, carcinoma in situ, and papillary tumors, compared with conventional white-light cystoscopy alone. 9
Based on these promising clinical results, fluorescence diagnosis has also become a diagnostic tool in other medical fields, such as in pulmonology, 10 otolaryngology, 11 and gynecology. 12 Neurosurgeons are also using fluorescence for the intraoperative detection of malignant gliomas;13 in dermatology, efforts have been made to diagnose and demarcate basal cell carcinomas, for instance. 14
For gastrointestinal malignancies, ALA-induced protoporphyrin IX fluorescence has been used as a diagnostic aid in several experimental and clinical studies, mainly to detect and differentiate dysplasias and precancerous lesions within Barrett’s mucosa. 15–17 Other indications to assess mucosal lesions suspicious of malignancy were gastric polyps and adenomas, ulcerative colitis, and lower gastrointestinal adenomas. 18–20
Although theoretically available for several decades, fluorescence techniques became more attractive when more effective photosensitizers such as ALA were clinically implemented and tested. They were intended to reduce common side effects of photosensitizers such as skin sensitivity, nausea, vomiting, and transiently elevated liver transaminase levels. ALA-induced protoporphyrin IX photosensitization showed several advantages: ALA, protoporphyrin IX, and other intermediates are rapidly eliminated from the human organism, thus minimizing the risk of skin phototoxicity; ALA can be applied locally, providing an acceptable and convenient route of administration; and the fluorescence ratio between tumor and surrounding healthy tissue is superior to that of other agents. 21–26
Our motive in combining staging laparoscopy with fluorescence diagnosis was to increase the sensitivity of conventional laparoscopy. Feussner et al 2 found that laparoscopy rendered more precise information about tumor staging in 40.4% of patients. In 30% the information gained by laparoscopy helped to plan surgical interventions or to prevent unnecessary laparotomies. In 32% of patients with abdominal malignancies, such as gastric carcinoma, assessment during laparoscopy indicated that resection was inappropriate because of peritoneal carcinosis. However, Hemming et al 3 reported 12% unresectable lesions found after laparotomy that had been judged resectable by laparoscopy. In 6.8% peritoneal metastases were completely missed during staging laparoscopy.
Initial studies using laparoscopic fluorescence diagnosis for intraperitoneal tumors after peritoneal ALA lavage rendered highly promising results. 6,27 Hence, the aim of the present study was to define the ideal photosensitization parameters for diagnosis.
The data obtained in the pilot study were confirmed in our follow-up study. Using 3% ALA solution resulted in an increase of sensitivity of 23% (pilot study 17.5%), indicating a good but inferior outcome compared with the use of 1.5% ALA, with an increase of up to 35%. Thus, every fourth lesion was diagnosed simply by adding the optical fluorescence mode to conventional laparoscopy. Because a full histopathologic examination of the entire peritoneal surface to identify false-negative lesions was impracticable, we can make no statement about the absolute sensitivity of the method. As an indicator for specificity, all fluorescent tumors (1.5% ALA, 4 hours) were true-positive results, proven by histology. False-positive fluorescence caused by inflammation, as reported by other studies, 20 was not observed. Hence, the laparoscopist can rely on the fact that fluorescence represents malignancy, allowing an immediate assessment of the intraoperative situation.
Because visualization and judgment of fluorescence depend on the examiner and therefore are subjective, an objective determination of the fluorescence characteristics by spectrometry was performed. The signal is measured only within a small, restricted area and is thus also described as point spectrometry or the point system. Various experimental and clinical studies have been performed to differentiate malignant or premalignant from healthy tissue using this technique. 28–30 Spectral information from a lesion is immediately available, allowing a real-time diagnosis. In endoscopic gastroenterology, it enables the examiner to take biopsy samples from the areas most likely to yield positive results. Here, the term “optical biopsy” was created, referring to the histologic sampling of tissue by fluorescence spectrometry. 17 In the endoscopic field, the purpose of optical biopsies is not to replace histology, but rather to make the examination clinically more effective. Conventional sampling errors are greatly minimized, making the procedure more rational. 28,30
In laparoscopy, point spectrometry may support laparoscopic fluorescence diagnosis when visualization is impaired for technical reasons such as poor illumination, light reflections on surfaces, low contrast, or high scattering. It provides valuable information in uncertain cases, when suspicious areas show only moderate fluorescence (for example, if lesions are located in deeper peritoneal layers). 27
The data gained in the present experimental setting showed a good correlation between the findings of the imaging system and the spectrometric measurements (point system). The fluorescence intensity score of the F tumors was slightly lower than that of the MF tumors but still significantly higher than healthy tissue. Maximal fluorescence intensities were seen after 4 hours with both ALA concentrations. Clinically the fluorescence ratio between tumor and surrounding healthy tissue is essential for visualization because it represents the optical contrast. In this regard, 1.5% ALA solution was clearly superior to 3.0% solution, reaching a ratio of 1:5.5 versus 1:4.6 after 4 hours and also higher ratios after shorter photosensitization times. The absolute fluorescence intensities of 3.0% ALA were only slightly higher than those of 1.5% ALA in both tumor and healthy tissue. This may suggest a kind of ceiling effect: higher ALA concentrations may not necessarily produce higher tumor fluorescence intensities. During surgery, the better the fluorescence contrast between tumor and unaffected tissue, the faster and more precise malignant areas can be identified (comparable to a bright vs. a pale star in the dark sky). Operation time may be minimized while maintaining a high diagnostic efficiency.
The drawback of fluorescence diagnosis with photosensitizers such as Photofrin was their slow systemic elimination, which caused skin phototoxicity that persisted for up to several days. The intravenous use of ALA and its metabolite protoporphyrin IX overcomes this problem. Determination of protoporphyrin IX and ALA serum levels in the present study confirmed the relatively fast systemic elimination of protoporphyrin IX after intraperitoneal photosensitization as well. However, 1.5% ALA showed a more favorable systemic biokinetic: reaching slightly higher maximal protoporphyrin IX levels, the systemic elimination occurred faster, probably producing fewer toxic side effects.
When dealing with the fluorescence process, one drawback cannot be overlooked. Laparoscopic fluorescence diagnosis is limited to superficial lesions because the detection depth of tumors depends on the wavelength of the applied light. Red light (longer wavelength) has a deeper penetration capability in tissue compared with blue light (shorter wavelength). The penetration depth of light at 630 nm (used for photosensitizers such as Photofrin) ranges from 0.2 to 2 cm, with a mean depth of around 0.6 cm. 31 Protoporphyrin IX molecules optimally absorb light around 400 nm. The blue light (380–440 nm) of the D-Light system, therefore, reaches an even lower penetration, limiting the targets to superficial tissue layers.
The ultimate goal of the study is the translation to clinical use. Many aspects of the experimental setting can be transferred without major changes. Local photosensitization could be performed in a manner similar to diagnostic peritoneal lavage (e.g., in abdominal trauma). Under short conscious sedation and monitoring of vital signs, the photosensitizer lavage would be applied using umbilical access to the peritoneal cavity. The awake patient would then be kept under surveillance in a dark environment until the beginning of anesthesia and laparoscopy. Precautions for light exposure in the operating room are essential, necessitating an accurate and full coverage of the photosensitized body.
In conclusion, fluorescence staging laparoscopy might be helpful in all clinical situations when exploration and clear visualization in the abdominal cavity are impaired (e.g., as a result of adhesions). Here, identification of malignant lesions is sometimes impossible even for experienced laparoscopists. In these cases, fluorescence laparoscopy is a relatively simple aid requiring only moderate technical and clinical expenditure. We would consider the optimal time to be 4 hours after photosensitization with 1.5% ALA peritoneal lavage. We found no false-positive results in our study, so we conclude that the method offers additional security in differentiating between malignant and benign tissue. The technique can be easily learned and applied by most examiners, meaning a vast clinical potential.
Fluorescence staging laparoscopy with intraperitoneal ALA lavage appears to be a very promising diagnostic tool for the visualization and detection of disseminated peritoneal tumors. It increases the sensitivity of conventional laparoscopy, may improve tumor staging, and provides the clinician with a rapid and accurate technique for assessing the full extent of malignant tumor growth in the abdominal cavity. However, these observations must be transferred into the clinical situation. Further studies are needed to show that these techniques are safe and reliable for the staging of gastrointestinal malignancies.
Footnotes
Correspondence: Johannes Gahlen, MD, Chirurgische Universitätsklinik Heidelberg, Kirschnerstraβe 1, D-69120 Heidelberg, Germany.
E-mail: johannes_gahlen@med.uni-heidelberg.de
Accepted for publication June 15, 2001.
References
- 1.Lorenz R, Krestin GP, Neufang KF. Diagnosis and differential diagnosis of a peritoneal carcinosis. Conventional techniques, sonography, computed tomography, magnetic resonance tomography. Radiologe 1990; 30: 477–480. [PubMed] [Google Scholar]
- 2.Feussner H, Kraemer SJ, Siewert JR. Staging laparoscopy. Chirurgie 1997; 68: 201–209. [DOI] [PubMed] [Google Scholar]
- 3.Hemming AW, Nagy AG, Scudamore CH, et al. Laparoscopic staging of intraabdominal malignancy. Surg Endosc 1995; 9: 325–328. [DOI] [PubMed] [Google Scholar]
- 4.Jerby BL, Milsom JW. Role of laparoscopy in the staging of gastrointestinal cancer. Oncology (Huntingt) 1998; 12: 1353–1360. [PubMed] [Google Scholar]
- 5.Peng Q, Warloe T, Berg K, et al. 5-Aminolevulinic acid-based photodynamic therapy. Cancer 1997; 79: 2282–2308. [DOI] [PubMed] [Google Scholar]
- 6.Gahlen J, Stern J, Laubach HH, et al. Improving diagnostic staging laparoscopy using intraperitoneal lavage of delta-aminolevulinic acid (ALA) for laparoscopic fluorescence diagnosis. Surgery 1999; 126: 469–473. [PubMed] [Google Scholar]
- 7.Tomokuni K, Ichiba M, Hirai Y. HPLC micro-method for determining delta-aminolevulinic acid in plasma. Clin Chem 1993; 39: 169–170. [PubMed] [Google Scholar]
- 8.Guo R, Lim CK, Peters TJ. Accurate and specific HPLC assay of coproporphyrin III oxidase activity in human peripheral leucocytes. Clin Chim Acta 1988; 177: 245–252. [DOI] [PubMed] [Google Scholar]
- 9.Kriegmair M, Baumgartner R, Knuchel R, et al. Detection of early bladder cancer by 5-aminolevulinic acid induced porphyrin fluorescence. J Urol 1996; 155: 105–110. [PubMed] [Google Scholar]
- 10.George PJ. Fluorescence bronchoscopy for the early detection of lung cancer. Thorax 1999; 54: 180–183. [DOI] [PMC free article] [PubMed] [Google Scholar]
- 11.Leunig A, Rick K, Stepp H, et al. Fluorescence imaging and spectroscopy of 5-aminolevulinic acid induced protoporphyrin IX for the detection of neoplastic lesions in the oral cavity. Am J Surg 1996; 172: 674–677. [DOI] [PubMed] [Google Scholar]
- 12.Walt H. Photomedicine in gynecology. Schweiz Med Wochenschr 1998; 128: 1690–1696. [PubMed] [Google Scholar]
- 13.Stummer W, Stocker S, Wagner S, et al. Intraoperative detection of malignant gliomas by 5-aminolevulinic acid-induced porphyrin fluorescence. Neurosurgery 1998; 42: 518–526. [DOI] [PubMed] [Google Scholar]
- 14.Andersson-Engels S, Canti G, Cubeddu R, et al. Preliminary evaluation of two fluorescence imaging methods for the detection and the delineation of basal cell carcinoma of the skin. Lasers Surg Med 2000; 26: 76–82. [DOI] [PubMed] [Google Scholar]
- 15.Keller R, Fischbach W. Endoscopic fluorescence detection of dysplasia in patients with Barrett’s esophagus, ulcerative colitis or colorectal adenomas. Z Gastroenterol 1999; 37: 761–763. [PubMed] [Google Scholar]
- 16.van den Boogert J, Houtsmuller AB, de Rooij FW, et al. Kinetics, localization, and mechanism of 5-aminolevulinic acid-induced porphyrin accumulation in normal and Barrett’s-like rat esophagus. Lasers Surg Med 1999; 24: 3–13. [DOI] [PubMed] [Google Scholar]
- 17.Stepp H, Sroka R, Baumgartner R. Fluorescence endoscopy of gastrointestinal diseases: basic principles, techniques, and clinical experience. Endoscopy 1998; 30: 379–386. [DOI] [PubMed] [Google Scholar]
- 18.Messmann H, Knuchel R, Baumler W, et al. Endoscopic fluorescence detection of dysplasia in patients with Barrett’s esophagus, ulcerative colitis, or adenomatous polyps after 5-aminolevulinic acid-induced protoporphyrin IX sensitization. Gastrointest Endosc 1999; 49: 97–101. [DOI] [PubMed] [Google Scholar]
- 19.Messmann H, Knuchel R, Endlicher E, et al. Photodynamic diagnosis of gastrointestinal precancerous lesions after sensitization with 5-aminolevulinic acid. A pilot study. Dtsch Med Wochenschr 1998; 123: 515–521. [DOI] [PubMed] [Google Scholar]
- 20.Messmann H, Kullmann F, Wild T, et al. Detection of dysplastic lesions by fluorescence in a model of colitis in rats after previous photosensitization with 5-aminolevulinic acid. Endoscopy 1998; 30: 333–338. [DOI] [PubMed] [Google Scholar]
- 21.Johansson J, Berg R, Svanberg K, et al. Laser-induced fluorescence studies of normal and malignant tumour tissue of rat following intravenous injection of delta-amino levulinic acid. Lasers Surg Med 1997; 20: 272–279. [DOI] [PubMed] [Google Scholar]
- 22.Van Hillegersberg R, Van den Berg JW, Kort WJ, et al. Selective accumulation of endogenously produced porphyrins in a liver metastasis model in rats. Gastroenterology 1992; 103: 647–651. [DOI] [PubMed] [Google Scholar]
- 23.Loh CS, Vernon D, MacRobert AJ, et al. Endogenous porphyrin distribution induced by 5-aminolevulinic acid in the tissue layers of the gastrointestinal tract. J Photochem Photobiol B 1993; 20: 47–54. [DOI] [PubMed] [Google Scholar]
- 24.Bedwell J, MacRobert AJ, Phillips D, et al. Fluorescence distribution and photodynamic effect of ALA-induced PP IX in the DMH rat colonic tumour model. Br J Cancer 1992; 65: 818–824. [DOI] [PMC free article] [PubMed] [Google Scholar]
- 25.Orenstein A, Kostenich G, Roitman L, et al. A comparative study of tissue distribution and photodynamic therapy selectivity of chlorin e6, Photofrin II and ALA-induced protoporphyrin IX in a colon carcinoma model. Br J Cancer 1996; 73: 937–944. [DOI] [PMC free article] [PubMed] [Google Scholar]
- 26.Heyerdahl H, Wang I, Liu DL, et al. Pharmacokinetic studies on 5-aminolevulinic acid-induced protoporphyrin IX accumulation in tumours and normal tissues. Cancer Lett 1997; 112: 225–231. [DOI] [PubMed] [Google Scholar]
- 27.Gahlen J, Prosst RL, Pietschmann M, et al. Spectrometry supports fluorescence staging laparoscopy after peritoneal aminolaevulic acid lavage for gastrointestinal tumours. J Photochem Photobiol B 1999; 52: 131–135. [DOI] [PubMed] [Google Scholar]
- 28.Kapadia CR, Cutruzzola FW, O’Brien KM, et al. Laser-induced fluorescence spectroscopy of human colonic mucosa. Detection of adenomatous transformation. Gastroenterology 1990; 99: 150–157. [DOI] [PubMed] [Google Scholar]
- 29.Andersson-Engels S, Klinteberg C, Svanberg K, et al. In vivo fluorescence imaging for tissue diagnostics. Phys Med Biol 1997; 42: 815–824. [DOI] [PubMed] [Google Scholar]
- 30.Wagnieres GE, Star WM, Wilson BC. In vivo fluorescence spectroscopy and imaging for oncological applications. Photochem Photobiol 1998; 68: 603–632. [PubMed] [Google Scholar]
- 31.Webber J, Herman M, Kessel D, et al. Current concepts in gastrointestinal photodynamic therapy. Ann Surg 1999; 230: 12–23. [DOI] [PMC free article] [PubMed] [Google Scholar]