

Abstract
Objective
To develop a prognostic model that determines patient survival outcomes after orthotopic liver transplantation (OLT) using readily available pretransplant variables.
Summary Background Data
The current liver organ allocation system strongly favors organ distribution to critically ill recipients who exhibit poor survival outcomes following OLT. A severely limited organ resource, increasing waiting list deaths, and rising numbers of critically ill recipients mandate an organ allocation system that balances disease severity with survival outcomes. Such goals can be realized only through the development of prognostic models that predict survival following OLT.
Methods
Variables that may affect patient survival following OLT were analyzed in hepatitis C (HCV) recipients at the authors’ center, since HCV is the most common indication for OLT. The resulting patient survival model was examined and refined in HCV and non-HCV patients in the United Network for Organ Sharing (UNOS) database. Kaplan-Meier methods, univariate comparisons, and multivariate Cox proportional hazard regression were employed for analyses.
Results
Variables identified by multivariate analysis as independent predictors for patient survival following primary transplantation of adult HCV recipients in the last 10 years at the authors’ center were entered into a prognostic survival model to predict patient survival. Accordingly, mortality was predicted by 0.0293 (recipient age) + 1.085 (log10 recipient creatinine) + 0.289 (donor female gender) + 0.675 urgent UNOS - 1.612 (log10 recipient creatinine times urgent UNOS). The above variables, in addition to donor age, total bilirubin, prothrombin time (PT), retransplantation, and warm and cold ischemia times, were applied to the UNOS database. Of the 46,942 patients transplanted over the last 10 years, 25,772 patients had complete data sets. An eight-factor model that accurately predicted survival was derived. Accordingly, the mortality index posttransplantation = 0.0084 donor age + 0.019 recipient age + 0.816 log creatinine + 0.0044 warm ischemia (in minutes) + 0.659 (if second transplant) + 0.10 log bilirubin + 0.0087 PT + 0.01 cold ischemia (in hours). Thus, this model is applicable to first or second liver transplants. Patient survival rates based on model-predicted risk scores for death and observed posttransplant survival rates were similar. Additionally, the model accurately predicted survival outcomes for HCV and non-HCV patients.
Conclusions
Posttransplant patient survival can be accurately predicted based on eight straightforward factors. The balanced application of a model for liver transplant survival estimate, in addition to disease severity, as estimated by the model for end-stage liver disease, would markedly improve survival outcomes and maximize patients’ benefits following OLT.
Since 1987, the rate of new registration to the United Network for Organ Sharing (UNOS) waiting list has far exceeded the growth of cadaveric liver donors. With less than 5,000 cadaveric livers available annually, close to 19,000 patients currently await liver transplantation. 1 Despite adopting the minimal listing criteria 2 and expanding the definitions of acceptable grafts, the current disparity between supply and demand has both exponentially increased median waiting times and linearly increased waiting list deaths, which reached 1,600 in 2000. The growing scarcity of donor organs compared to potential recipients awaiting liver transplantation has additionally increased the numbers of patients undergoing transplantation as urgent-status recipients. 3 However, survival benefits of transplantation in critically ill recipients are poor when compared to nonurgent patients. 4–8
Two guiding principles of organ distribution for liver transplantation have been advocated: efficiency of organ use and the urgency of need. 8 The first implies transplantation into low-risk recipients, where the best results are achieved, while the second favors organ diversion to high-risk patient cohorts. If sufficient liver organ allografts were available for transplantation, the urgency of need principle would no doubt provide the best benefit to transplant candidates. However, the aforementioned scarcity of cadaveric organs and mounting deaths on waiting lists and failure of one in five adult primary liver grafts within the first year after transplantation 9 argue that optimizing outcome by efficient organ use may provide the best benefit to our patients.
The current organ allocation system is strongly biased toward the severity of illness and favors organ distribution to urgent recipients. 2–3,10,11 Additionally, the recent adoption of the Model for End-Stage Liver Disease (MELD), 12,13 which is a strong predictor of death for patients on waiting lists but not for survival after transplantation, as the basis for national organ allocation may increase the percentage of urgent patients receiving cadaveric transplantation and further minimize the survival outcomes of a limited organ resource. In contrast, an organ allocation system that balances disease severity with expected outcomes would maximize patients’ survival benefits from transplantation. Such goals can be realized only with better understanding of the factors that influence patient and graft survival and the development of prognostic models for OLT outcomes.
The development of a model that predicts patient survival following liver transplantation has therefore become a crucial concern of the liver transplant community. We 4–7,14,15 and others 16–27 have critically examined the factors associated with transplantation outcomes in different patient populations. Our previous study 5 attempted to define the variables that affected patient survival in hepatitis C virus (HCV) transplant recipients at our center. Such factors were applied to a large cohort of patients obtained from the UNOS database to develop a model that predicts patient survival after liver transplantation.
METHODS
Patients
From January 1990 to December 2000, 510 adult patients underwent orthotopic liver transplantation (OLT) for end-stage liver disease (ESLD) secondary to HCV at our center. Of the 510 patients, 80 (15.7%) had graft failure that required retransplantation and 129 died during the follow-up period. Median follow-up was 30 (0–130) months.
The UNOS dataset contained a total of 46,942 patients who were transplanted between 1990 and 2000 for all diagnoses of ESLD. Only 25,772 patients over 18 years of age, with complete datasets, were included in the analysis. The median follow-up time was 36 months (<1–145) months, with a 27.5% overall mortality.
Candidates for OLT were categorized as urgent or nonurgent recipients according to their medical condition before transplantation, as defined by the UNOS categories. From 1990 to 1994 urgent recipients included status 4 patients, while nonurgent patients included status 3, 2, and 1. After November 1994, status designation was modified by UNOS on two occasions. Urgent recipients included either status 1 or 2A and nonurgent recipients included status 2, 2B, 3, or 4, according to the designated UNOS criteria at the time of transplantation.
Survival Model for HCV Patients
The initial survival model in HCV-positive adult primary transplant recipients considered 19 donor, recipient, and operative variables that may have an impact on patient survival. Donor variables included age, sodium level, days of hospitalization before procurement, history of cardiac arrest, number of donor pressors, donor HCV status, and donor gender. The 10 recipient variables examined were age, UNOS status before transplantation, preoperative total bilirubin, AST, ALT, prothrombin time, serum creatinine, HCV RNA, presence or absence of hepatocellular carcinoma (HCC), and HCV recurrence. In addition, two operative variables that included cold and warm ischemia times were analyzed. According to this model, the estimated relative mortality risk = exp (mortality index), where the mortality index is given by: 0.0293 (recipient age) + 1.085 (log10 recipient creatinine) + 0.289 (donor female gender) + 0.675 urgent UNOS - 1.612 (log10 recipient creatinine times urgent UNOS). Factors that were identified by multivariate analysis to have an impact on survival in HCV patients, in addition to other variables, were tested in the UNOS dataset.
Statistical Analysis
Analyses were performed as previously described. 5 Survival curves were computed using Kaplan-Meier methods and compared using log-rank tests. Medians were compared via the log-rank test or the Wilcoxon test when data were not censored. Proportions were compared using the chi-square test. The log-rank test for trend was used when comparing survival curves across ordered categories. For univariate screening purposes, continuous potential predictors of patient or graft survival such as (log) creatinine were dichotomized at their overall median to form two groups of roughly equal size.
All variables found univariately significant at P < .20 or those thought to be important on logical and/or biomedical grounds were entered into a backward stepdown Cox proportional hazard regression analysis using a liberal P < .10 criterion for interaction variable retention. Variables with many missing values were not included. All possible two-way interactions among variables were also first considered in this Cox backward stepdown procedure. Highly skewed variables were transformed to the log scale where their distribution was more symmetric. The c-statistic (concordance) was used to assess the multivariate model performance. All analyses were carried out using the SAS system (SAS Institute Inc., Cary, NC).
RESULTS
Predictors of Survival in HCV Patients at UCLA
Our previous univariate and multivariate analyses of adult patients who underwent primary transplantation for HCV over the last 10 years considered 19 donor, recipient, and operative variables that may have an impact on patient survival. Univariate comparison followed by multivariate Cox proportional hazard regression analysis indicated that recipient age, UNOS status, donor gender, and log creatinine were simultaneous significant predictors that predicted patient survival following primary transplantation for HCV at our center. Although this survival model was developed in HCV patients, HCV recurrence did not appear to affect patient survival (P = .879). We therefore applied such factors to the UNOS database that included patients with all indications for transplantation to verify their ability to predict survival of HCV and non-HCV recipients.
Model Development Based on UNOS Data
The summary statistics of HCV patients at UCLA, from which the previous model was derived, and the UNOS patient population, on which the new model is based, are shown in Table 1. Comparison of the two datasets demonstrated a higher percentage of urgent-status patients in the UNOS data. UCLA patients exhibited lower recipient bilirubin and warm and cold ischemia times compared to UNOS data. The two datasets were similar in total deaths, serum creatinine, AST, and ALT. The retransplantation rate was 15.7% in the UCLA dataset and 12% in the UNOS dataset. Variables found to affect survival in HCV transplanted recipients at UCLA were evaluated in the UNOS dataset. Because of the differences in the two patient populations, other variables that were thought to be clinically relevant or were previously shown to affect patient survival were included in the analysis. These additional variables included donor age, recipient total bilirubin, prothrombin time (PT) of recipient, warm and cold ischemia times, and history of previous transplant. Multivariate revaluation of the variables in the UCLA model for HCV patients, in addition to all the above-mentioned factors in 25,772 patients obtained from the UNOS database, resulted in an eight-factor model shown in Table 2. Recipient (log) ALT was not considered, since (log) AST was found to be a good proxy for (log) ALT (ALT-AST Spearman correlation = 0.81). In this revised model, donor gender, recipient gender, log AST, and urgent UNOS status ceased to be statistically significant after accounting for recipient age, donor age, recipient (log) creatinine, recipient (log) bilirubin, PT, previous transplant, and warm and cold ischemia times, which were all associated with increased risk of death. Additionally, HCV positivity did not appear to impact patient survival (P = .221).
Table 1. COMPARATIVE CHARACTERISTICS FOR MULTIVARIATE DATASETS

UCLA, University of California Los Angeles; UNOS, United Network for Organ Sharing; AST, aspartate transaminase; ALT, alanine transaminase.
Table 2. PROPORTIONAL HAZARD (COX) MODEL FOR PATIENT MORTALITY

UNOS, United Network for Organ Sharing; AST, aspartate transaminase; HCV, hepatitis C virus.
Table 2 demonstrates the relative risk (hazard) of death with the corresponding 95% confidence bounds for each factor. Thus, any increase in the latter eight factors was associated with increased mortality. Accordingly, a year increase in recipient age was associated with a 1.9% increase in the risk of dying, while a previous transplant carried 1.93 times the risk of death when compared to no previous transplants. Based on this model, the mortality score is given by: 0.0084 donor age + 0.019 recipient age + 0.816 log creatinine + 0.0044 warm ischemia (in minutes) + 0.659 (if second transplant) + 0.10 log bilirubin + 0.0087 PT + 0.01 cold ischemia (in hours).
The relative risk of mortality in this model is given by exp (mortality score minus mean mortality score) = exp (mortality score minus 1.90), where 1.90 is the mean overall risk score.
Risk Scores and Model Validation
Mortality risk scores were calculated for individual patients based on the current model and used to stratify transplant recipients into five risk groups. The risk score cutoff values dividing the patients were chosen so that each quintile would contain a roughly equal number of patients. As shown in Table 3, the mean mortality score exhibited a sequential increase from the first patient quintile, with a mean risk score of 1.33, to 2.59 in the fifth quintile. The model’s ability to stratify the patients by risk scores was validated by the observed relative risk of death, which sequentially increased from 1.0 in the first quintile to 3.89 in the fifth quintile. Additionally, the model-predicted relative risk of death was identical to the observed relative risk of death throughout all quintiles.
Table 3. MORTALITY SCORE AND RELATIVE MORTALITY RISK QUINTILES

The overall survival of patients from the UNOS database is shown in Figure 1A. Kaplan-Meier survival analysis demonstrated 86%, 83%, and 77% patient survival rates at 6 months and 1 and 5 years, respectively. Actuarial patient survival estimates based on mortality score quintiles are shown in Figure 1 B. The mortality score accurately determined patient survival, with the worst survival observed with the highest risk scores. The best survival estimates were achieved by the patients in the first quintile and reached 94%, 92%, and 83% at 6 months and 1 and 5 years, respectively. In contrast, patients with the highest risk scores, in the fifth quintile, exhibited the lowest patient survival rates: 71%, 67%, and 53% at 6 months and 1 and 5 years, respectively.
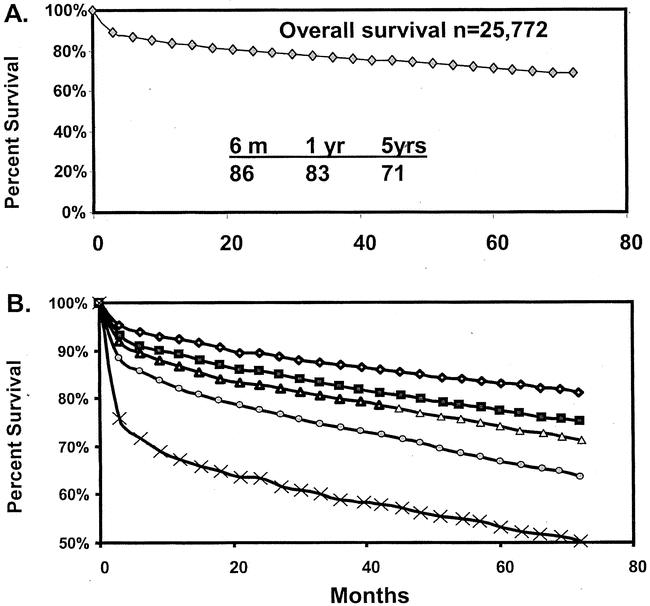
Figure 1. Actual Kaplan-Meier patient survival estimates of patients in UNOS dataset. (A) Overall survival estimate. (B) Actual patient survival estimates following recipient stratification into quintiles based on model-predicted mortality risk scores.
Actual Kaplan-Meier and model-predicted survival estimates for risk scores quintiles of the entire UNOS population of 25,772 patients are shown in Figure 2. Observed survival rates were identical to model-predicted estimates for the second and fourth quintiles, as well as for the first, third, and fifth quintiles. In addition to survival estimates, the model was also validated using the c-statistic. The value of the c-statistic was 0.69, 0.68, and 0.67 at 3 months, 6 months, and 1 year after transplantation, respectively.
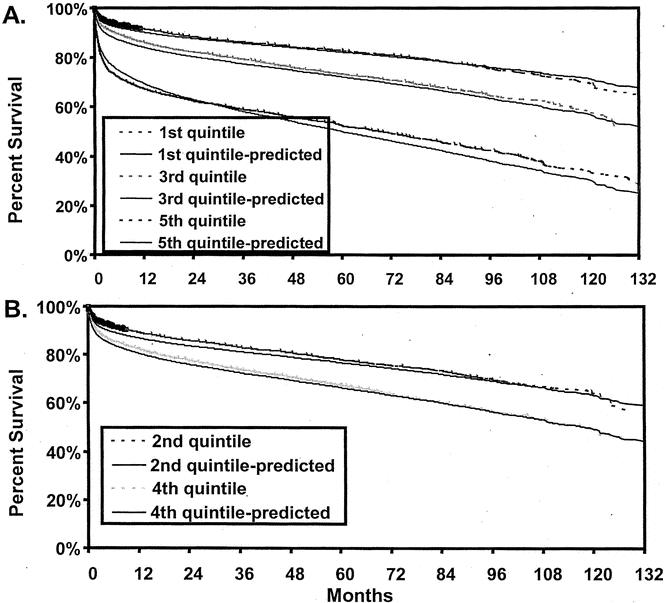
Figure 2. Observed (broken line) and model-predicted (nonbroken lines) survival estimates of liver transplant recipients by mortality risk quintiles. (A) Second and fourth quintiles. (B) First, third, and fifth quintiles.
Survival of HCV and Non-HCV Recipients
To determine whether the model accurately predicted the risk of death in HCV patients, the model-predicted relative risk of death was compared between HCV-positive and non-HCV recipients in the UNOS dataset for each variable included in the model. As shown in Table 4, only the donor age variable exhibited a difference between HCV and non-HCV recipients. All other variables imposed a similar relative risk of death to HCV or non-HCV patients. Additionally, Kaplan-Meier survival estimates demonstrated that the model-predicted survival estimates were identical to observed actuarial survival rates both in HCV-positive and non-HCV recipients in the UNOS dataset (Fig. 3). Further, as shown in Figure 4, the model accurately predicted survival rates of HCV recipients in UCLA patients.
Table 4. COX MODEL COMPARISON FOR PATIENT MORTALITY

HCV, hepatitis C virus.
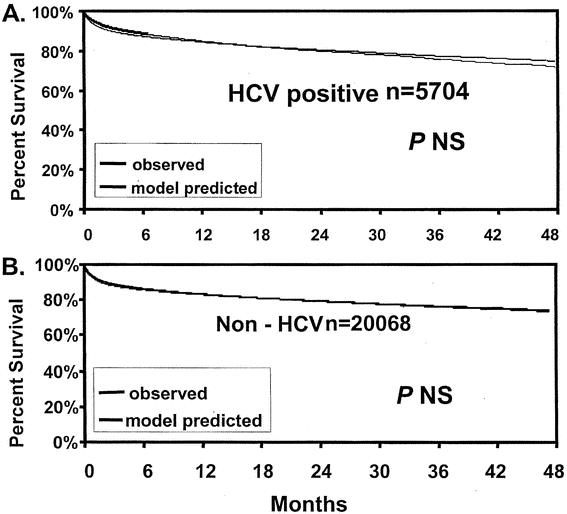
Figure 3. Observed and model-predicted survival estimates of UNOS patient cohorts. (A) HCV-positive patients. (B) Non-HCV patients.
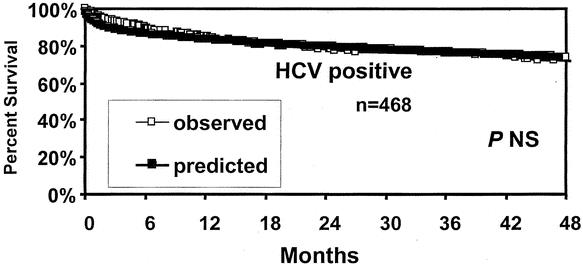
Figure 4. Model-predicted and actual patient survival rates based on HCV-positive patients transplanted at UCLA.
DISCUSSION
The present study represents our continuous efforts to determine recipient outcomes following liver transplantation. We have defined a mathematical model that accurately estimates patient survival based on readily available preoperative factors. These include recipient age, donor age, recipient creatinine, recipient total bilirubin, PT, retransplantation, and warm and cold ischemia times. The mean warm ischemia time for the surgical team should be a well-known value, and the expected cold ischemia time could be easily calculated before transplantation. The application of this model should accurately determine the expected survival rates for patients undergoing first or second transplantation.
We have previously reported the factors that influenced patient and graft survival in transplantation of HCV recipients at our center. 5 Univariate analysis of 19 donor, recipient, and operative factors demonstrated that increases in the age of the recipient (>52 years) and preoperative serum creatinine (>1 mg/dL) had an adverse impact on patient survival. By multivariate analysis, factors that simultaneously predicted patient survival included UNOS status, donor female gender, recipient age, and serum creatinine. This study attempted to validate such factors in a large cohort of patients derived from the UNOS database. Because of the variation between the UCLA cohort and the broad-based UNOS population, we elected to evaluate additional factors to our analysis based on the previously reported significance of such factors 7,14,15,17–19,22,26 in an attempt to obtain a universal model that predicts survival of all liver transplants.
This strategy outlined the inherent differences between single-center and national datasets. While some factors were significant in both databases, the effect of others may not be immediately apparent in relatively small datasets where surgical practices are homogeneous. For example, warm and cold ischemia times, not significant in our original study, exhibited vital importance in the final model based on the UNOS data. Additionally, the UNOS status of the recipient, although critical to the UCLA cohort, ceased to be significant when applied to the UNOS population, where other, more objective parameters for the condition of the patient were used. However, the final UNOS-derived model was validated in the smaller UCLA cohort. Thus, single-center experiences are crucial to the validation of any model to confirm its applicability to a wide range of surgical practices.
Two methods were used in this study to validate the current eight-factor model. 12,14,24 The first divided the UNOS patient population into five quintiles based on the model-predicted risk scores. Such mortality scores accurately determined patient survival rates. The best survival was seen in patients in the first quintile, with the lowest risk scores. As predicted, survival rates gradually decreased as the mortality scores increased, with the lowest survival achieved in patients with highest risk scores. Further, the model-predicted survival was identical to the observed actual Kaplan-Meier survival estimates for the entire UNOS population and subpopulations that included UNOS non-HCV recipients, UNOS HCV recipients, and UCLA HCV recipients. The second methodology for model validation estimated the c-statistic, which may be used to assess a multivariate model with a binary outcome. The c-statistic for this model was estimated at 0.69 and 0.67 at 3 and 12 months, respectively. The MELD is generally believed to exhibit a high c-statistic of 0.8 to 0.87 and 0.78 to 0.87 at 3 months and 1 year, respectively. 12 However, these high c-statistic estimates were achieved only on small sample sizes of 282 to 491 patients. When the MELD was applied to a larger sample size of 1,179, the c-statistic dropped to 0.78 and 0.73 at 3 months and 1 year, respectively. Thus, with a much larger patient population, the c-statistic of the MELD may decline even further. We therefore believe that the c-statistic of 0.69 achieved by this model in the heterogeneous UNOS population of more than 25,000 patients provides an extremely useful validated model that accurately predicts patient survival after transplantation.
The variables identified by our model to affect patient survival are quite similar to those identified by other authors. 16–27 The association of retransplantation with poor survival outcomes has been well defined by many investigators, 17,19,22,23 as well as by our group. 7,14 Recipient serum creatinine was correlated with posttransplant survival, early postoperative sepsis, and hospital death. 15,16,22 Preoperative recipient physiology, reflected in our model by recipient age, creatinine, PT, and bilirubin, has been well established as an independent risk of death. 15,17,21,22,26 In addition to recipient factors, our model also includes an assessment of the donor organ, as indicated by donor age, which has been clearly demonstrated to be a primary determinant of graft function. 20,27 Perioperative events that influence patient survival are reflected in the model by warm and cold ischemia times. The mean operative warm ischemia time for the surgical team and the anticipated cold ischemia time are variables that can be predicted before surgery and were therefore entered in our model. The deleterious effects of prolonged warm or cold ischemia times on the outcome of transplantation are well established. 20,27
An important aspect of this model is that it is applicable to both HCV and non-HCV patients. This was validated by demonstrating identical model-predicted survival estimates to actuarial HCV-positive and non-HCV-positive recipients in the UNOS database. Additionally, this model was applicable to HCV-positive patients at UCLA. Since ESLD caused by HCV is currently the major indication for liver transplantation, it is crucial for any prognostic model to predict outcomes in such patient cohorts. Interestingly, a prognostic model for morbidity outcomes in patients with cholestatic liver disease included recipient age, serum creatinine, UNOS status, and Child class. 26 Such factors are extremely similar to those identified in our model. Although we did not consider Child class, our model includes serum creatinine, PT, and total bilirubin, which have been shown to be superior to Child class in predicting mortality of patients with ESLD by the MELD model. Thus, the ability of the current model to predict survival of non-HCV as well as HCV patients, as well as its similarity to other models used for non-HCV cohorts, validates our approach in developing universal prognostic models that accurately predict short-term OLT outcomes, regardless of the etiology of ESLD.
The currently presented model for liver transplant survival (MLTS) is in marked contrast to the MELD scoring system that has been recently adopted for organ allocation. While MLTS is an indicator for patient survival after transplantation, MELD is a predictor of mortality for patients with ESLD. Organ distribution based on MELD scores would therefore increase the rate of transplantation in urgent high-risk recipients. Unfortunately, such patients exhibit poor survival outcomes when compared to nonurgent low-risk patients, thereby reducing the survival benefits that could be afforded by liver transplantation. The current era of severe organ shortage and mounting deaths on the waiting list argue for optimizing outcome by transplantation of nonurgent low-risk patients. Thus, a balanced organ allocation system that considers both disease severity as assessed by MELD and expected survival as assessed by MLTS would maximize the patients’ survival benefits following liver transplantation.
In summary, we have developed a preoperative prognostic model that accurately predicts survival after liver transplantation. This model is equally applicable to first or second transplants and appears to predict survival accurately regardless of the cause of underlying liver disease. Use of such survival models in clinical decision making and organ allocation may maximize recipients’ benefits from a limited donor organ pool.
DISCUSSION
Dr. John J. Fung (Pittsburgh, PA): The liver transplant group at UCLA is to be commended for their continuing efforts in assessing utility measures for liver transplantation. From their reports on cost analysis in liver transplantation to studying the utility of retransplantation, this study on predictive modeling for liver transplant outcomes is a natural extension and adds to our appreciation of the complex factors that determine survival after liver transplantation.
The issue, as I see it, is not so much the concern that the current allocation system favors sicker patients and that this will lead to poorer outcomes. This is a given; it has been demonstrated by other models and in real life. However, if, as suggested in their manuscript, we should be “optimizing outcomes by efficient organ use,” we should only transplant children, 30-year-old PSC and 40-year-old PBC patients livers from teenage donors at centers that do more than 35 liver transplants a year. We would turn down patients with HCV, patients with liver cancer, patients in fulminant hepatic failure, and never retransplant anyone. But that is not reality; this is not what the liver transplant procedure was developed for.
In my mind, the strength of this study is that it points out, in a mathematical representation, the balance between donor factors and recipient factors that determine success or failure, something that liver transplant surgeons have implicitly known for years. The current policy of transplanting marginal-quality organs into the sickest patient is a formula for disaster. In the era of increasing marginal donors, such as the older donor, the unstable donor, the donor with a fatty liver, we must strive to find scenarios where they can be used with the least negative impact.
So the first question: Do the authors believe their work supports this concept that higher-risk donors should be transplanted into lower-risk recipients, and vice versa, such that the objective would be to strike a balanced risk for everyone who is undergoing liver transplantation?
As one can see from the elements of this formula, the prediction of outcome is not individual-oriented but rather based on population outcomes. The model looks at primarily physiologic determinants, those that get the patient through surgery, but do not necessarily define long-term survival. For example, a 40-year-old HCV candidate with bilobar HCC with compensated cirrhosis would not be expected to have better survival than a 60-year-old woman with significant liver dysfunction from PBC. So the second question: Do the authors believe that this model can be used at a level to discern whether an individual patient should be transplanted or not?
It is obvious that this task is in a state of continuing refinement, as evidenced by the differences in the various weights and factors mentioned in the abstract submitted last fall and the equation shown today. Nevertheless, the authors recognize that the utilization of a larger database will only improve the accuracy of their model. However, I believe that this introduces center-specific variables that are not adequately addressed in this model, especially if it is to be used for allocation at a national level. For instance, warm ischemia time is more a reflection of center experience than an element that can be predicted prior to transplantation at an individual basis.
Lastly, the donor shortage has led to not only utilization of marginal donors, but also the use of living donors. In the current equation, cold ischemia times are given significant weight. Since this is a minimal factor in LRD liver transplant (i.e., CIT are <1 hour), do the authors suggest that this will allow us to transplant patients with more advanced liver disease?
Presenter Dr. Rafik M. Ghobrial (Los Angeles, CA): Thank you, Dr. Fung, for such insightful remarks. I deeply appreciate your comments, especially when much of the pioneering work on predictors of transplantation outcomes originated from the University of Pittsburgh. As you stated, this is a very complex issue, but we do live in very complex times where there aren’t enough organs for transplantation. With 5,000 livers for 19,000 patients waiting, there isn’t any easy answer to all those questions.
Regarding your first question, the model supports that high-risk donors should be transplanted into lower-risk recipients and vice versa? As you mentioned, this may optimize the outcome, because high-risk recipients often need better organs and vice versa. However, in practicality when we get a patient from home, it is very difficult to offer him or her a high-risk graft. I think this model provides an objective analysis to this dilemma. If a marginal liver is offered, we can assess the risk that may be imposed on a particular recipient and then make the judgment whether this is an acceptable risk. So I think the model provides objective criteria to the clinical decision making.
Could that model be used as a level to discern whether an individual patient should be transplanted or not? Again, I believe it could. As transplant surgeons, we sometimes have to make the tough decision of telling a potential recipient, or a potential recipient’s family, that “no, you are too sick to be transplanted.” A prognostic model that can accurately predict posttransplant outcomes, would no doubt make these decisions a lot easier.
The question on the living donor is a very interesting and excellent question that I think imposes additional thought. I believe that we do not fully understand all the factors and variables that influence transplantation outcomes after living-donor transplantation. I think the question would be answered a lot better in a year or two from today after we have had the opportunity to evaluate the outcome of 1,000 to 2,000 living donors in the United States and assess all variables. But, as yet, I would not be so hasty as to apply this model to living donors.
Dr. Stuart J. Knechtle (Madison, WI): I would like to thank Dr. Ghobrial for the opportunity to review his manuscript and to congratulate him on continued clinical productivity in his research.
To put the paper in a larger context, I think it could be pointed out that allocation does not increase the total number of livers transplanted but rather seeks to equitably distribute a scarce resource. But having said that, you have developed a beautiful model to usefully guide us in predicting outcomes after liver transplantation. I have three questions for you.
Firstly, have you prospectively validated the model that you have just described for us? Secondly, the current allocation system, as you know, favors patients with known or suspected hepatocellular malignancies. How would this model deal with patients who have known or suspected hepatocellular carcinoma? And thirdly, how would you propose to use the model that you have just described to balance the competing goals of transplanting the sickest patient versus achieving the highest possible survival rate? You have given us an elegant tool. How would you apply that tool now?
Dr. Rafik M. Ghobrial (Los Angeles, CA): Dr. Knechtle, thank you very much for your questions. Some of them are easy and some of them are very tough.
With regard to the question on hepatocellular carcinoma, these are patients that everybody struggles with in the liver transplant survival model because the survival is not based on liver disease. I think that the current model may be applicable to these patients to predict short-term survival since the model is based on pretransplant and peritransplant variables. However, long-term survival may be dependent on other factors such as the size and stage of the tumor. If this model would be applied for organ allocation, we may need to take into account the factors that may influence patient survival after transplantation for HCC. So I believe in doing prospective evaluation, we should be looking into how well these patients do and factor in how big the cancer is. There are so many variables that may influence their survival, so it may be helpful in the future if we apply, on an individual basis, those variables back to that disease.
With regard to the applicability of the model, I believe there are immediate and long-term goals. I think the immediate effect of this model is that it will help the clinician at the time of the transplant to customize, if you will, which organ should go to which recipient. I think in the long term, after prospective evaluation of the model, we would be in a position to say that we should apply that model in conjunction with the MELD scoring system to achieve a balance between equity and utility for organ allocation.
Footnotes
Presented at the 122nd Annual Meeting of the American Surgical Association, April 24–27, 2002, The Homestead, Hot Springs, Virginia.
Supported in part by the Dumont Foundation, the Torino Foundation, and the Joanne Barr Foundation.
Correspondence: Ronald W. Busuttil, MD, PhD, Dumont-UCLA Transplant Center, UCLA School of Medicine, 10833 LeConte Ave., 77-120 CHS, Los Angeles, CA 90095.
Accepted for publication April 24, 2002.
References
- 1.United Network for Organ Sharing website (http. //wwwew3.att.net/UNOS), accessed April 2002.
- 2.Lucey MR, Brown KA, Everson GT, et al. Minimal criteria for placement of adults on the liver transplant waiting list: a report of a national conference organized by the American Society of Transplant Physicians and the American Association for the Study of Liver Diseases. Liver Transplantation 1997; 3: 628. [DOI] [PubMed] [Google Scholar]
- 3.Federal Register (FR Doc 98–8191) 42 CFR Part 121, April 2, 16296, 1998.
- 4.Ghobrial RM, Farmer DG, Baquerizo A, et al. Orthotopic liver transplantation for hepatitis C: outcome, effect of immunosuppression and causes of retransplantation during an eight-year single center experience. Ann Surg 1999; 229: 824–833. [DOI] [PMC free article] [PubMed] [Google Scholar]
- 5.Ghobrial RM, Steadman R, Gornbein J, et al. A ten-year experience of liver transplantation for hepatitis C: analysis of factors determining outcome in over 500 patients. Ann Surg 2001; 234: 384–394. [DOI] [PMC free article] [PubMed] [Google Scholar]
- 6.Ghobrial RM, Yersiz H, Farmer D, et al. Predictors of survival after in vivo split liver transplantation: analysis of 110 consecutive cases. Ann Surg 2000; 232: 312–323. [DOI] [PMC free article] [PubMed] [Google Scholar]
- 7.Markmann JF, Markowitz JS, Yersiz H, et al. Long-term survival after retransplantation of the liver. Ann Surg 1997; 226: 408–420. [DOI] [PMC free article] [PubMed] [Google Scholar]
- 8.Bronsther O, Fung JF, Tzakis A, et al. Prioritization and organ distribution for liver transplantation. JAMA 1994; 271: 140–143. [PMC free article] [PubMed] [Google Scholar]
- 9.Seaberg EC, Belle SH, Beringer KC, et al. Liver transplantation in the United States from 1987–1998: updated results from the Pitt-UNOS liver transplant. In Cecka M, Terasaki P, eds. Clinical Transplants. Los Angeles, CA: UCLA Tissue Typing Laboratory, 1998. [PubMed]
- 10.Freeman RB, Rober RJ, Katz E, et al. Preliminary results of a liver allocation plan using a continuous severity score that de-emphasizes waiting time. Liver Transplant 2001; 7: 173–178. [DOI] [PubMed] [Google Scholar]
- 11.Freeman RB Jr, Edwards EB. Liver transplant waiting time does not correlate with waiting list mortality: implications for liver allocation policy. Liver Transplant 2000; 6: 543–552. [DOI] [PubMed] [Google Scholar]
- 12.Wiesner RH, McDiarmid SV, Kamath PS, et al. MELD and PELD: application of survival models in liver allocation. Liver Transplant 2001; 7: 567–580. [DOI] [PubMed] [Google Scholar]
- 13.Kamath PS, Wiesner RH, Malinchoc M, et al. A model to predict survival in patients with end-stage liver disease. Hepatology 2001; 33: 464–470. [DOI] [PubMed] [Google Scholar]
- 14.Markmann JF, Gornbein J, Markowitz J, et al. A simple model to predict survival after retransplantation of the liver. Transplantation 1999; 67: 422–430. [DOI] [PubMed] [Google Scholar]
- 15.Markmann JF, Markmann JW, Markmann DA, et al. Preoperative factors associated with outcome and their impact on resource use in 1148 consecutive primary liver transplants. Transplantation 2001; 72: 113–1122. [DOI] [PubMed] [Google Scholar]
- 16.Cuervas-Mons V, Millan I, Gavaler JS, et al. Prognostic value of preoperatively obtained clinical and laboratory data in predicting survival after liver transplantation. Hepatology 1986; 6: 922–927. [DOI] [PMC free article] [PubMed] [Google Scholar]
- 17.Doyle HR, Marino IR, Jabbour N, et al. Early death or retransplantation in adults after orthotopic liver transplantation. Can outcome be predicted? Transplantation 1994; 57: 1028–1036. [DOI] [PMC free article] [PubMed] [Google Scholar]
- 18.Gonzalez FX, Rimola A, Grande L, et al. Predictive factors of early postoperative graft function in human liver transplantation. Hepatology 1994; 20: 565–573. [DOI] [PubMed] [Google Scholar]
- 19.Doyle HR, Dvorchik I, Mitchell S, et al. Predicting outcomes after liver transplantation. Ann Surg 1994; 219: 408–415. [DOI] [PMC free article] [PubMed] [Google Scholar]
- 20.Strasberg SM, Howard TK, Molmenti EP, et al. Selecting donor livers: Risk factors for poor function after orthotopic liver transplantation. Hepatology 1994; 20: 829–838. [DOI] [PubMed] [Google Scholar]
- 21.Doyle HR, Marino IR, Morelli F, et al. Assessing risk in liver transplantation. Ann Surg 1996; 224: 168–177. [DOI] [PMC free article] [PubMed] [Google Scholar]
- 22.Doyle HR, Morelli F, McMichael J, et al. Hepatic retransplantation-an analysis of risk factors associated with outcome. Transplantation 1996; 61: 1499–1505. [DOI] [PMC free article] [PubMed] [Google Scholar]
- 23.Wong T, Devlin J, Rolando N, et al. Clinical characteristics affecting the outcome of liver transplantation. Transplantation 1997; 64: 878–882. [DOI] [PubMed] [Google Scholar]
- 24.Rosen HR, Martin P. A model to predict survival following liver retransplantation. Hepatology 1999; 29: 365–370. [DOI] [PubMed] [Google Scholar]
- 25.Showstack J, Katz PP, Lake JR, et al. Resource utilization in liver transplantation. JAMA 1999; 281: 1381–1386. [DOI] [PubMed] [Google Scholar]
- 26.Ricci P, Therneau TM, Malinchoc M, et al. A prognostic model for the outcome of liver transplantation in patients with cholestatic liver disease. Hepatology 1997; 25: 672–677. [DOI] [PMC free article] [PubMed] [Google Scholar]
- 27.Mor E, Klintmalm GB, Gonwa TA, et al. The use of marginal donors for liver transplantation. A retrospective study of 365 liver donors. Transplantation 1992; 53: 383–386. [DOI] [PubMed] [Google Scholar]