

Abstract
Objective:
To predict the impact of the aging population on the demand for surgical procedures.
Summary Background Data:
The population is expanding and aging. According to the US Census Bureau, the domestic population will increase 7.9% by 2010, and 17.0% by 2020. The fastest growing segment of this population consists of individuals over the age of 65; their numbers are expected to increase 13.3% by 2010 and 53.2% by 2020.
Methods:
Data on the age-specific rates of surgical procedures were obtained from the 1996 National Hospital Discharge Survey and the National Survey of Ambulatory Surgery. These procedure rates were combined with corresponding relative value units from the Centers for Medicare and Medicaid Services. The result quantifies the amount of surgical work used by an average individual within specific age groups (<15 years old, 15–44 years old, 45–64 years old, 65+ years old). This estimate of work per capita was combined with population forecasts to predict future use of surgical services.
Results:
Based on the assumption that age-specific per capita use of surgical services will remain constant, we predict significant increases (14–47%) in the amount of work in all surgical fields. These increases vary widely by specialty.
Conclusions:
The aging of the US population will result in significant growth in the demand for surgical services. Surgeons need to develop strategies to manage an increased workload without sacrificing quality of care.
The US population is expanding and aging. Based on a projection method that assumes that age-specific rates of surgical use will remain constant, we predict significant increases (14 - 47%) in the amount of work in all surgical fields. Surgeons need to develop strategies to manage this increased workload.
The population is expanding and aging. According to the US Census Bureau, the domestic population will increase 7.9% by 2010, and 17.0% by 2020. The fastest growing segment of this population consists of individuals over the age of 65; their numbers are expected to increase 13.3% by 2010 and 53.2% by 2020. Two main factors are responsible for these forecasts. First, we are living longer; life expectancy has increased from 66.7 years for individuals born in 1946 to 76.1 years for those born in 1996.1 Second, the baby boomers (those born between 1946 and 1964) are a wave of population density that will begin to hit retirement age in 2011.2
Older individuals require more medical services relative to their younger counterparts. The National Hospital Discharge Survey (NHDS) reported that in 1999, patients aged 65 years or older comprised 12% of the population, but constituted 40% of hospital discharges and 48% of days of inpatient care.3 As the proportion of elderly patients in the population increases, the medical system will face new challenges. Will there be enough surgeons to meet the increased demand for surgical services?
The last decade has been notable for a perception of balance with regard to the physician supply relative to demand. Against this calm background, we sought to isolate and predict the effect of the aging population on the use of surgical services and the need for surgeons. We hypothesized that the surgical workload will increase significantly over the next 2 decades due in large part to the aging of the US population. Toward evaluating this hypothesis, we employed an approach based upon historical patterns of care. Data from national surveys of medical and surgical services were used to establish a profile of age-specific rates of surgical use. This profile was then used to model the impact of forecasted population shifts on surgical work.
MATERIALS AND METHODS
Source of Data
Nationwide census forecasts for the years 2001–2020 were obtained through the US Census Bureau. Information regarding the rates of specific surgical procedures was obtained from the 1996 NHDS and the 1996 National Survey of Ambulatory Surgery (NSAS).4 The 1996 NHDS and NSAS are the most current surveys of surgical services that include an ambulatory surgery component. These surveys were based on a probability sample of nationwide inpatient and ambulatory surgery facilities. Sample sizes were 300,000 and 125,000, respectively.5,6 The NHDS and NSAS report procedure rates according to the International Classification of Disease, Revision 9 (ICD-9) procedural coding scheme. Each procedural code is listed along with the number of times it was performed in the survey sample; results are listed by patient age group (< 15 years old, 15–44 years old, 45–64 years old, 65+ years old). Reporting standards for these surveys preclude the accurate reporting of rates for procedures with a low sampled frequency (less than 60 cases present in sample). Procedures for which an age-specific procedure rate could not be determined based on NHDS and NSAS data were excluded from analysis.
Each ICD-9 code was linked to the Current Procedural Terminology (CPT) code that was most relevant to each procedure. Through the Centers for Medicare and Medicaid Services, a database linking each CPT code to pertinent resource-based relative value units (RVU) was obtained. The RVU, which is generally used for calculating reimbursement, includes 3 components: physician work, practice (overhead), and malpractice costs.7-9 In this analysis, the physician work component was used to estimate the amount of surgical work required to perform the procedure. For example, the number of work RVUs assigned to a laparoscopic cholecystectomy is 11.09, whereas a total hip replacement is 20.12, and a three-vessel coronary artery bypass graft is 31.80.
Analysis
To compute workload projections, age-specific incidence rates for each procedure were multiplied by the corresponding work RVUs. The results were tabulated by surgical specialty and population age group. Through this method, the amount of surgical work used by an average individual each year within the 4 specified age groups was calculated. These age-specific estimates of per capita work per year were combined with population forecasts to model the impact of the expanding/aging population on surgical work. Forecasts were carried out until the year 2020 using 2001 as a reference. The results were aggregated according to specialty, which included cardiothoracic surgery, general surgery, neurosurgery, ophthalmology, orthopedic surgery, otolaryngology, and urology. For the purposes of analysis, general surgery includes vascular, abdominal, gastrointestinal, hernia, breast, and pediatric surgery.
RESULTS
Analysis of Census Projections
Based on census projections, the total domestic US population will increase 7.9% by 2010 and 17.0% by 2020. Older individuals constitute a disproportionately large share of this growth. Individuals aged 65 years or older are expected to increase in number by 53.2% (18 million persons) between 2001 and 2020 (Table 1).
TABLE 1. Forecasted Population by Age Group

Initially, gains will be the largest in 45–64 year olds; by 2010, the population in this age group will have increased in size 26.0% relative to 2001 (Fig. 1). Individuals aged 65 years or older will increase in number by 13.3% during the same time period. After 2010, population growth will occur primarily in the 65 years or older age group. By 2020, individuals aged 65 years or older will have increased in number by 53.2% relative to 2001, whereas those aged 45–64 years of age will have increased 28.1%. Between 2001 and 2020, younger individuals (0–44 years old) are projected to have relatively little population growth.

FIGURE 1. US population growth by age group.
Analysis of Age-Specific Surgical Procedure Rates
A total of 214 procedures met the inclusion criterion. The number of procedures included for analysis is listed by specialty in Table 2. A sample of 6 procedures along with their corresponding age-specific incidence rates is provided in Table 3. Individuals in older age groups had higher rates of surgical use than patients in younger age groups. For example, the incidence rate for a three-vessel coronary artery bypass graft in an individual 65 years of age or older (1.95 procedures per 1,000 persons per year) is more than twice as high as in a 45–64-year-old (0.82 procedures per 1,000 persons per year). For 58% of the surgical procedures analyzed in the study, the incidence rate for individuals 65 years of age or older was higher than for any of the other 3 age groups.
TABLE 2. Number of Procedures Analyzed by Specialty
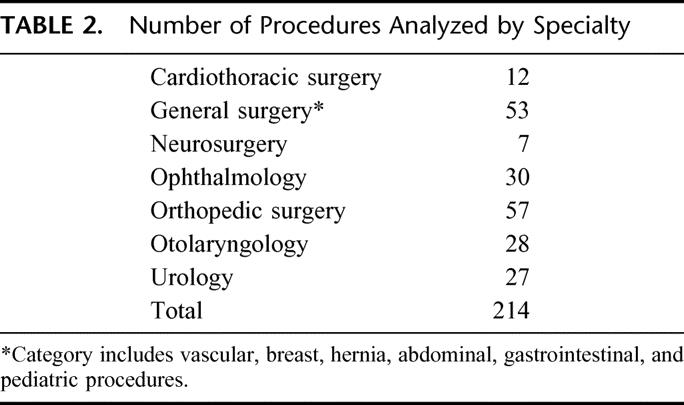
TABLE 3. Sample of Incidence Rates by Age Group

The proportion of surgical work by age group was computed for each surgical specialty (Table 4). There was significant variation between specialties in terms of the age group(s) of patients that constituted the bulk of procedure-based work. For example, patients aged 65 years or older constituted a larger proportion of procedure-based work in ophthalmology (88%) and cardiothoracic surgery (70%) than in otolaryngology (8%).
TABLE 4. Proportion of Work Within Surgical Specialty by Age Group

Forecasts for Surgical Specialties
Specialties in which older patients constitute a greater share of procedure-based work have larger forecasted increases in workloads (Fig. 2). The projected growth in procedure-based work closely parallels growth in the number of procedures performed by each specialty (Table 5). Of all the surgical specialties examined, ophthalmology has the largest forecasted increase in work (15% by 2010; 47% by 2020). These projections reflect that older patients are the predominant consumers of cataract surgery; the incidence of cataract surgery in individuals 65 years old or older is more than 8 times the incidence in a patient 45–64 years old. In addition, cataract surgeries (lens fragmentation, insertion of intraocular lens; ICD-9 codes 13.41 and 13.71) comprise 55% of the overall procedure-based workload of ophthalmologists.

FIGURE 2. Forecasted increases in work by specialty.
TABLE 5. Forecasted Percent Increases in Number of Procedures and Work by Specialty

Cardiothoracic surgeons care for predominantly older patients. In cardiothoracic surgery, 70% of procedure-based work was derived from patients 65 years old or older. Over the next 2 decades, the growth in surgical work in this field is forecasted to be 42%.
Orthopedics, urology, and neurosurgery also have forecasted growth. The procedure-based work in orthopedics and urology is expected to increase by 28% and 35%, respectively, by 2020. Orthopedic surgery has smaller predicted gains than urology as a result of the significant amount of procedures performed in patients under the age of 45. The profile of age-specific use of neurosurgical procedures is similar to that of orthopedics and urology. Growth in procedure-based work in neurosurgery is predicted to be 15% by 2010 and 28% by 2020.
The amount of procedure-based work in general surgery is expected to grow by 13% by 2010 and 31% by 2020. The possibility that the inclusion of pediatric surgical procedures affected the interpretation of the growth of general surgery was examined. If all pediatric surgical procedures (defined as procedures performed in patients under 15 years of age) were removed from analysis, the forecast for growth in general surgical procedures did not change significantly.
Otolaryngology is unique among the surgical specialties examined. In this field, a greater share of work (39.6%) is performed in patients under the age of 15 than in any other age group. Only a small portion of their procedure-based work (8.4%) is performed on patients over the age of 65. Growth in otolaryngology is therefore projected to be less than the population growth.
DISCUSSION
As a result of the aging of the US population, we predict that increases in the utilization of surgical services will far outpace the rate of overall population growth. These increases will not be distributed uniformly across surgical specialties. Specialties in which a disproportionately high amount of care is provided to patients over the age of 65 (ie, ophthalmology, cardiothoracic surgery) will experience more growth in workload than those fields that care for younger as well as older patients.
In the past, needs-based models have been used to predict future demand for medical services. The landmark Graduate Medical Education National Advisory Committee (GMENAC) report, published in 1980, was based on an “adjusted needs-based” approach. Their methods relied upon an expert panel’s estimation of the amount of physician work required to care for specific medical and surgical problems. These estimates were then “adjusted” to reflect market realities. Drawing upon these estimates and a comprehensive epidemiological model of the incidence of disease processes, they forecasted the future need for medical services. The GMENAC report suggested that by the year 2000, there would be a surplus of 144,700 physicians—approximately 25% of all doctors.10 It contained more than 107 specific recommendations to prevent a flood of unneeded physicians. Meanwhile, Congress was also acting by passing Public Law 94-484, intended to restrict the number of foreign medical graduates trained in the US.
In 1989, the Bureau of Health Professions and the Council on Graduate Medical Education contracted with ABT Associates to conduct a follow-up to the GMENAC study. This report, released in 1991, built on the earlier GMENAC model and forecasted the national need and supply of physicians by specialty. The methods used in generating this report were similar to that used by GMENAC; the major differences were a lack of “adjustment” of the needs-based model, and the convening of a new set of expert panels. This report conflicted with the earlier GMENAC report and forecasted increases in the growth of need relative to supply in certain areas. In the field of general surgery, the forecasted increase in needs between 1990 and 2010 was 32.7%.11
Historically, the ratio of physician supply to demand has been cyclical. The GMENAC report was produced during a period of perceived physician surplus in the 1970s and early 1980s. Over the last decade physician workforce projections have become less popular, likely the result of a transient balance between demand and supply. Currently, we are not alone in forecasting the emergence of a shortage of specialist physicians. Cooper et al have analyzed the relationship between longitudinal trends and the population-based demand for medical services.12 Based on forecasted economic expansion, population growth, and changes in the health care workforce, they predict a 20% deficit in the number of physicians by the year 2020. The predicted shortages are greater for specialists than for primary care physicians.12,13 Their findings, although the product of a different methodology, parallel ours. Other recent analyses have addressed the impact of population trends on the demand for medical specialists, and also predict significant shortages.14,15
Some researchers disagree with these predictions, and find the prospect of training more specialists an unwelcome move toward specialty-dominated medical care.16,17 These disagreements are primarily the product of a belief that physicians, and in particular specialists, induce demand for the services they provide. Do the rates of surgical procedures depend on the number and concentrations of surgeons that perform them? In the early 1980s, Wennberg and colleagues found a correlation between regional rates of surgical procedures and physician supply.18 More recent research has clarified this relationship. One study used Medicare data to investigate the effect of regional variations in surgeon supply. Regions with higher concentrations of surgeons have increased rates of initial visits between physicians and patients, however, the rate of procedure utilization does not seem to be affected.19 Another study examined coronary revascularization procedures, and found that rates of surgery are determined more by local variations in the use of diagnostic procedures than the concentration of surgeons.20 Despite these findings, the fear that increasing the number of surgeons will result in an increased use of unnecessary procedures is pervasive.
Unlike prior needs-based forecasts, the methods used in this study are based on established patterns of surgical use. We believe that this approach, by eliminating the need for the subjective estimates of an expert panel, is a more valid technique for predicting the impact of population shifts on changes in workload. Our method assumes that the age-specific profile of surgical demand will remain constant, which may be a limitation. It is possible that innovations in medical technology will decrease the demand for surgical procedures, or even make certain procedures obsolete. In general, noninvasive therapies thus far have failed to decrease the need for surgeries. One excellent example of this is in the area of cardiac surgery. Cutler et al, in 2001, examined the costs and benefits of medical technological advances in the treatment of coronary artery disease. The rapid growth of coronary angioplasty and stent technology had no discernible impact on the growth of coronary artery bypass surgery.21 It remains to be seen whether other nonsurgical therapies (eg, proton pump inhibitors, carotid artery stents) will affect rates of surgeries in the future (eg, Nissen fundoplication, carotid endarterectomy).
Continued technological advance may actually lead to the application of existing procedures to a wider range of individuals. Escarce et al examined the effect of the introduction of laparoscopic technology on the threshold to perform cholecystectomy. They found that the improved technology led to increased rates of surgery.22 Minimally invasive surgical techniques are rapidly improving and finding new applications. If this trend continues, the demand for surgical procedures may see even further increases as clinical thresholds for other procedures are lowered.
Despite the potential limitation inherent in our assumption, we believe our approach realistically forecasts an important trend. That the aging population will result in more work for surgeons was a foregone conclusion. The actual forecasted growth, between 14 and 47% within each surgical specialty, is impressive. How will surgeons handle the impending increases in procedures generated by the aging US population? We propose 3 areas in which surgeons may be able to adapt to a growth in workload.
The most obvious solution would be to increase the number of practicing surgeons. Unfortunately, this is a very long-term solution. If the number of surgical residency slots was immediately increased by 10%, it would take 20 years before the number of practicing surgeons increased by 5% (assumptions: 5-year training program, average time in workforce of 30 years). The number of surgeons completing postgraduate training programs has remained remarkably constant over the last decade within all surgical specialties. Furthermore, recent trends indicate a declining medical student interest in certain surgical specialties with a perceived poor lifestyle, most notably general surgery.23,24 Other specialties (orthopedics, otolaryngology, and urology) with more controllable lifestyles have had better success with maintaining medical student interest.24
A second possible solution to address the increasing workload would be to ask surgeons to work more. Unfortunately, although it is difficult to assess the number of surgeons currently in practice, it is even more difficult to determine their workloads. Jonasson et al have elegantly described the pitfalls of using physician rosters, such as the American Medical Association Masterfile, to estimate the number of surgeons in practice.25 They pointed out that previous estimates of the size of the general surgical workforce were inflated because they counted a large number of surgeons not performing general surgery. Furthermore, attempts to estimate the workloads of general surgeons have yielded wildly inconsistent figures regarding the number of cases performed by the average surgeon. Early studies reported surgical workloads in terms of “hernia equivalents,” and sparked concern about a surplus of surgeons when the average number of hernia equivalents performed per week in 1 group practice was listed as 3.1.26 These reports are difficult to put into current perspective. More recently, Ritchie et al reported data from the surgical operative logs (SOL) from the recertification examinations offered by the American Board of Surgery.27 These SOLs reflect a heterogeneous case-mix; the number of cases performed per year varied between 6 and 2,541 (mean = 398). The same report also examined temporal trends from 1995–1997 in terms of the number of cases per surgeon per year. There was no evidence that the workload (in terms of number of cases) increased or decreased during this 3-year period. In another report, Zelenock et al examined the number of operations performed per year by surgeons in an academic setting.28 They reported a 30% increase between 1981 and 1995. Are surgeons performing more cases now than they did in the past? Are surgeons’ hours longer? Do these caseloads reflect a significant amount of latent capacity in the current surgical workforce, or are surgeons stretched dangerously thin? These are enormously important questions that need to be answered.
A third solution may be to improve the ability of surgeons to focus on procedure-based work. Only a few studies have been devoted to understanding the work environment of surgeons, and the factors that contribute to increased productivity. Two studies performed in the 1970s compared the workloads of surgeons in community versus prepaid group practice. Those in group practice produced twice the surgical output, while working 1-1/2 times as many hours.29,30 Despite the rapid proliferation of staff model HMOs, there have been no detailed investigations of the workloads and working hours of their staff surgeons. The specific elements of surgical practice that lead to increased productivity are largely unknown. Medical fields have increasingly relied on nonphysician clinicians such as advanced practice nurses and physician assistants to shoulder part of the burden of work. Nonphysician clinicians may have expanding roles in augmenting surgical productivity.
In the near future, the aging of the US population will result in significant increases (14–47%) in the demand for surgical services. Surgeons need to develop strategies to accommodate an expanding workload without sacrificing quality of care. We believe that with the arrival of increased demand relative to supply, surgeons will find themselves empowered to explore new ways to streamline and improve their practices. Future research should be directed toward identifying the interaction between work environment, surgeon productivity, and quality of care.
Footnotes
Reprints: David A. Etzioni, MD, David Geffen School of Medicine at University of California, Los Angeles, Department of Surgery, 1015 Ninth Street Apt 106, Santa Monica, CA 90403. E-mail: detzioni@mednet.ucla.edu.
REFERENCES
- 1.Anderson RN, DeTurk PB. United States Life Tables, 1999. Natl Vital Stat Rep 2002;50(6):33. [PubMed]
- 2.Martin JA, Hamilton BE, Ventura SJ, et al. Births: final data for 2000. Natl Vital Stat Rep 2002;50(5). [PubMed]
- 3.Popovic J. 1999 National Hospital Discharge Survey: Annual Summary with Detailed Diagnosis and Procedure Data. National Center for Health Statistics, 2001;1. [DOI] [PubMed]
- 4.Owings MF, Kozak LJ. Ambulatory and inpatient procedures in the United States, 1996. Vital Health Stat 1998;13(139). [PubMed]
- 5.Dennison C, Pokras R. Design and Operation of the National Hospital Discharge Survey: 1988 Redesign. National Center for Health Statistics; 2000. [PubMed]
- 6.McLemore T. LL. Plan and operation of the National Survey of Ambulatory Survey. National Center for Health Statistics; 1997;1–3. [PubMed]
- 7.Hsiao WC, Braun P, Dunn D, et al. Resource-based relative values. An overview. JAMA. 1988;260:2347–2353. [PubMed] [Google Scholar]
- 8.Hsiao WC, Braun P, Yntema D, Becker ER. Estimating physicians’ work for a resource-based relative-value scale. N Engl J Med. 1988;319:835–841. [DOI] [PubMed] [Google Scholar]
- 9.Hsiao WC, Couch NP, Causino N, et al. Resource-based relative values for invasive procedures performed by eight surgical specialties. JAMA. 1988;260:2418–2424. [PubMed] [Google Scholar]
- 10.Summary report of the Graduate Medical Education National Advisory Committee to the Secretary, Department of Health and Human Services, September 20, 1980, vol. 1. GMENAC summary report. Department of Health and Human Services; 980.
- 11.Associates A. Reexamination of the Adequacy of Physician Supply Made in 1980 by the Graduate Medical Advisory Committee (GMENAC) for Selected Specialties–Final Report. Washington, DC: US Dept of Commerce; 1991.
- 12.Cooper RA, Getzen TE, McKee HJ, et al. Economic and demographic trends signal an impending physician shortage. Health Aff (Millwood). 2002;21:140–154. [DOI] [PubMed] [Google Scholar]
- 13.Cooper RA. There’s a shortage of specialists: is anyone listening? Acad Med. 2002;77:761–766. [DOI] [PubMed] [Google Scholar]
- 14.Angus DC, Kelley MA, Schmitz RJ, et al. Caring for the critically ill patient. Current and projected workforce requirements for care of the critically ill and patients with pulmonary disease: can we meet the requirements of an aging population? JAMA. 2000;284:2762–2770. [DOI] [PubMed] [Google Scholar]
- 15.Fye WB. Cardiology workforce: there’s already a shortage, and it’s getting worse! J Am Coll Cardiol 2002;39:2077–2079. [DOI] [PubMed] [Google Scholar]
- 16.Weiner JP. A shortage of physicians or a surplus of assumptions? Health Aff (Millwood). 2002;21:160–162. [DOI] [PubMed] [Google Scholar]
- 17.Grumbach K. The ramifications of specialty-dominated medicine. Health Aff (Millwood). 2002;21:155–157. [DOI] [PubMed] [Google Scholar]
- 18.Wennberg J, Gittelsohn A. Variations in medical care among small areas. Sci Am. 1982;246:120–134. [DOI] [PubMed] [Google Scholar]
- 19.Escarce JJ. Explaining the association between surgeon supply and utilization. Inquiry. 1992;29:403–415. [PubMed] [Google Scholar]
- 20.Kuhn EM, Hartz AJ, Baras M. Correlation of rates of coronary artery bypass surgery, angioplasty, and cardiac catheterization in 305 large communities for persons age 65 and older. Health Serv Res. 1995;30:425–436. [PMC free article] [PubMed] [Google Scholar]
- 21.Cutler DM, McClellan M. Is technological change in medicine worth it? Health Aff (Millwood). 2001;20:11–29. [DOI] [PubMed] [Google Scholar]
- 22.Escarce JJ, Chen W, Schwartz JS. Falling cholecystectomy thresholds since the introduction of laparoscopic cholecystectomy. JAMA. 1995;273:1581–1585. [PubMed] [Google Scholar]
- 23.Henningsen JA. Why the numbers are dropping in general surgery: the answer no one wants to hear–lifestyle! Arch Surg. 2002;137:255–256. [DOI] [PubMed] [Google Scholar]
- 24.Bland KI, Isaacs G. Contemporary trends in student selection of medical specialties: the potential impact on general surgery. Arch Surg. 2002;137:259–267. [DOI] [PubMed] [Google Scholar]
- 25.Jonasson O, Kwakwa F, Sheldon GF. Calculating the workforce in general surgery. JAMA. 1995;274:731–734. [PubMed] [Google Scholar]
- 26.Hughes EF, Fuchs VR, Jacoby JE, et al. Surgical work loads in a community practice. Surgery. 1972;71:315–327. [PubMed] [Google Scholar]
- 27.Ritchie WP Jr., Rhodes RS, Biester TW. Work loads and practice patterns of general surgeons in the United States, 1995-1997: a report from the American Board of Surgery. Ann Surg. 1999;230:533–542; discussion 542-543. [DOI] [PMC free article] [PubMed]
- 28.Zelenock GB, Stanley JC, More RA, et al. Differential clinical workloads among faculty at a major academic health center. Ann Surg 1997;226:336–345; discussion 345-347. [DOI] [PMC free article] [PubMed]
- 29.Hughes HF, Lewit EM, Lorenzo FV. Time utilization of a population of general surgeons in community practice. Surgery. 1975;77:371–383. [PubMed] [Google Scholar]
- 30.Watkins RN, Hughes EF, Lewit EM. Time utilization of a population of general surgeons in a prepaid group practice. Med Care. 1976;14:824–838. [DOI] [PubMed] [Google Scholar]