

Abstract
CNT2 (concentrative nucleoside cotransporter) is a plasma membrane high-affinity Na+-coupled adenosine transporter, also localized in intracellular structures. This transporter protein may play additional roles other than nucleoside salvage, since it has recently been shown to be under purinergic control via KATP channels, by a mechanism that does not seem to involve changes in its subcellular localization. In an attempt to identify the agents that promote CNT2 trafficking, bile acids were found to increase CNT2-related transport activity in a KATP channel-independent manner in both Fao hepatoma and rat liver parenchymal cells. A maximum effect was recorded after treatment with hydrophilic anions such as TCA (taurocholate). However, this effect did not involve changes in the amount of CNT2 protein, it was instead associated with a subcellular redistribution of CNT2, resulting in an accumulation of the transporter at the plasma membrane. This was deduced from subcellular fractionation studies, biotinylation of plasma membrane proteins and subsequent CNT2 detection in streptavidin precipitates and in vivo confocal microscopic analysis of the distribution of a YFP (yellow fluorescent protein)–CNT2 construct. The induction of CNT2 translocation, triggered by TCA, was inhibited by wortmannin, dibutyryl-AMPc, PD98059 and colchicine, thus suggesting the involvement of the PI3K/ERK (phosphoinositide 3-kinase/extracellular-signal related kinase) pathway in microtubule-dependent activation of recombinant CNT2. These are novel effects of bile-acid physiology and provide the first evidence for short-term regulation of CNT2 translocation into and from the plasma membrane.
Keywords: adenosine, bile acids, CNT2, liver parenchymal cells, plasma membrane transporters, trafficking
Abbreviations: A1R, adenosine 1 receptor; AMPK, AMP-dependent protein kinase; BSEP, bile-salt export pump; GCDCA, glycochenodeoxycholic acid; CHO, chinese hamster ovary; CNT2, concentrative nucleoside cotransporter; DCA, deoxycholic acid; ERK, extracellular-signal related kinase; IEC-6, intestinal epithelial cells-6; MAPK, mitogen-activated protein kinase; MEK, MAPK/ERK kinase; NTCP, Na+/TCA co-transporting polypeptide; PKC, protein kinase C; PI3K, phosphoinositide 3-kinase; rCNT2, recombinant CNT2; TCA, taurocholate; TUDCA, tauroursodeoxycholic acid; UDCA, ursodeoxycholic acid; YFP, yellow fluorescent protein
INTRODUCTION
CNT2 (SLC28A2) is a Na+-coupled concentrative nucleoside cotransporter that preferentially translocates purine nucleosides across the plasma membrane (for recent reviews see [1–3]). CNT2 cDNA was initially isolated by expression cloning in Xenopus oocytes using a rat liver cDNA library and was originally called SPNT (sodium-purine nucleoside transporter) [4]. However, CNT2 is expressed in most epithelia and in cells of the immune system [5–7]. In liver parenchymal cells, it is located at the sinusoidal pole and in intracellular compartments [8]. CNT2 mRNA is up-regulated during cell-cycle progression in synchronized proliferating cultured rat hepatoma Fao cells [9], and the amount of CNT2 protein is increased in regenerating rat liver soon after hepatectomy [10]. Moreover, CNT2 is expressed in differentiated hepatocytes and accordingly its expression is lost in chemically-induced hepatocarcinogenesis [11].
Recent data regarding CNT2's properties point to a role beyond the mere salvage of extracellular nucleosides. A link between CNT2 function and energy metabolism has recently been provided by the demonstration that CNT2-mediated uptake of adenosine into IEC (intestinal epithelial cells)-6 activates AMPK (AMP-dependent protein kinase), thus promoting the phosphorylation of downstream targets such as acetyl CoA carboxylase-1 (I. Aymerich, F. Foufelle, P. Ferré, F. J. Casado and M. Pastor-Anglada, unpublished work). In turn, CNT2 may modulate extracellular adenosine levels, since it had the highest affinity for adenosine (apparent Km value of 8 μM) [4]. Although adenosine also binds to CNT1 with high affinity [12], adenosine transport via CNT1 is either very low or negligible [12,13]. CNT2 co-localizes with A1R (adenosine 1 receptor) at the plasma membrane of Fao cells, whereas A1R has been localized at the basolateral domain of hepatocytes, as has CNT2 [8]. Moreover, CNT2-related transport activity is rapidly increased after A1R agonist activation in rat hepatocytes and hepatoma cells by a mechanism that requires functional KATP channels but does not seem to be associated with changes in CNT2 abundance at the plasma membrane [14].
Nevertheless, the occurrence of CNT2 protein in intracellular stores (present study and [8]) prompted us to examine whether CNT2 activity might be regulated by changes in its subcellular distribution in rat liver parenchymal cells. Among a panel of putative modulators, bile acids were chosen since they regulate nucleoside metabolism in regenerating rat liver in which CNT2-related transport activity is up-regulated [10]. In particular TCA (taurocholate) promotes either nucleoside catabolism or incorporation into DNA, dependent upon nutritional status [15,16]. Moreover, bile acids are bioactive molecules. They are physiological ligands for the farnesoid X receptor [17,18] and they transcriptionally modulate enzymes involved in their metabolism [19–21], as well as the basolateral bile acid cotransporter NTCP (Na+/TCA co-transporting polypeptide) [22]. Bile acids also promote the translocation of their own BSEP transporter, (bile-salt export pump), into the canalicular membrane [23]. Furthermore, bile acid transport from the sinusoid to the canalicular domain of hepatocytes requires the polarized localization of particular transporter proteins, the expression and activity of which are also dependent upon the differentiation status of hepatocytes, as well as on bile acids themselves [24] (for a recent review see [25]). In the present study we demonstrate that bile acids rapidly increase CNT2-related transport activity by changing its subcellular localization, thus increasing its expression at the plasma membrane. This mechanism is sensitive to inhibition of the PI3K/ERK (phosphoinositide 3-kinase/extracellular-signal related kinase) transduction pathway, but is independent of the KATP-mediated activation of CNT2 described previously [14]. More interestingly, this is a novel observation in bile acid physiology and provides the first evidence for short-term regulation of CNT2 translocation into/from the plasma membrane.
MATERIALS AND METHODS
Chemicals and reagents
Colchicine, DCA (deoxycholic acid), GCDCA (glycochenodeoxycholic acid), TCA anions, UDCA (ursodeoxycholic acid), dibutyryl-AMPc, cycloheximide and the tyrosine kinase inhibitor genisteine were purchased from Sigma–Aldrich (Saint Louis, MO, U.S.A.). The selective and cell-permeable MAPK (mitogen-activated protein kinase)/MEK (MAPK/ERK kinase) inhibitor PD 98059, and the selective and irreversible inhibitor of PI3K, wortmannin were from Calbiochem (La Jolla, CA, U.S.A.). [3H]Guanosine was from Moravek (Brea, CA, U.S.A.) and [γ-32P]ATP was from Amersham Biosciences (Buckinghamshire, U.K.). Proteina A-agarose was from Roche Molecular Biochemicals (Mannheim, Germany). All other reagents were of analytical grade.
Fao and HepG2 cells, isolated rat hepatocytes and culture conditions
The rat hepatoma cell line Fao [purchased from the ECACC (European Collection of Cell Cultures)] was routinely cultured in Coon's F12 medium supplemented with 10% (v/v) foetal calf serum, 2 mM glutamine and a mixture of antibiotics (100 units/ml penicillin G, 0.1 mg/ml streptomycin and 0.25 μg/ml fungizone). This cell line, which is derived from the H4IIEC3 cell line Reuber H35 is well differentiated, expresses numerous liver-specific enzymes and transcription factors [26], and retains significant CNT2 activity and expression [9].
The human hepatocyte carcinoma cell line HepG2 (ECACC) was cultured in Dulbeco's modified Eagle's medium supplemented with 10% (v/v) foetal calf serum, 2 mM glutamine and a mixture of antibiotics.
All animals used in this study were maintained, handled and killed according to the European Union laws on biomedical research involving laboratory animals. Hepatocytes were isolated from male Wistar rats by the classical anterograde collagenase perfusion method as described previously [27]. Isolated hepatocytes were then seeded in Earle's E-199 medium supplemented with 2% (v/v) foetal calf serum and a mixture of antibiotics (100 units/ml penicillin G, 0.1 mg/ml streptomycin and 0.25 μg/ml fungizone).
Primary cultures were analysed 15 h after seeding, and Fao cells were used at 60–70% confluence. Before monitoring the effects of bile acids on nucleoside transport activity and carrier expression, primary cultures and cell lines were incubated overnight in a serum-free BSA-supplemented medium.
Measurement of CNT2 activity
Nucleoside transport activity was monitored in cultured hepatocytes, and Fao hepatoma cells in either Na+-containing or Na+-free medium, as previously described [9]. Cells were cultured either in the presence or absence of different bile acids (DCA, GCDCA, TCA and UDCA) and the uptake of 1 μM guanosine was measured in the presence of either 137 mM NaCl or 137 mM C5H14CINO. The uptake medium also contained 5.4 mM KCl, 108 mM CaCl2, 1.2 mM MgSO4 and 10 mM Hepes (pH 7.4). Incubation was stopped after 1 min of initial velocity conditions in the two cell system [9] by washing the monolayers twice in 2 ml of cold buffer composed of 137 mM NaCl and 10 mM tris(hydroxymethyl) aminomethane-Hepes (pH 7.4). Cells were then dissolved in 100 μl of 100 mM NaOH, 0.5% (v/v) Triton-X-100. Aliquots were sampled for protein determination by Bradford's method (Bio-Rad Laboratories, Madrid, Spain) and for radioactivity measurements. The specificity of the CNT2 activity assay was based upon the observation that the uptake of guanosine (a substrate for both CNT2 and CNT3 transporters) could not be inhibited by cytidine (a substrate of CNT3 but not CNT2) [28,29]. Moreover, besides having a broader selectivity as a nucleoside transporter substrate, adenosine is also a purinergic agonist, thus making guanosine a less ‘bioactive’ substrate than adenosine itself. In functional terms, changes in CNT2-related transport function will affect any CNT2 substrate equally [14].
Western blot analysis
Antibodies against ERK1/2 and anti-(phospho-ERK1/2) were purchased from Promega (Madison, WI, U.S.A.) and used at dilutions of 1:5000 and 1:2000 respectively. The monoclonal antibody against the α1-subunit of the Na+/K+-ATPase was from Developmental Studies Hibrydoma Bank (Department of Biological Sciences, University of Iowa, IA, U.S.A.) and used at a dilution of 1:200. The monospecific anti-CNT2 and anti-CNT1 polyclonal antibodies were generated and characterized in our laboratory [5,10], and after purification of the IgG fraction were routinely used at dilutions of 1:1000 and 1:2000 respectively.
For Western blotting of CNT2, CNT1 and α1-subunit of the Na+/K+-ATPase, cell extracts were obtained by washing cell monolayers in PBS at specific timepoints, and then scraped off into in a buffer consisting of 0.5% (v/v) Triton X-100 and 100 mM Tris/HCl (pH 7.4), supplemented with a mixture of protease inhibitors (Complete MINI, Roche).
For Western blot analysis of ERK1/2 phosphorylation, cells were incubated with 250 μM TCA, and then treated with Triton lysis buffer [50 mM Hepes (pH 7.4), 150 mM NaCl, 100 mM NaF, 10 mM EDTA, 10 mM Na4P2O7, 2 mM Na3VO4, 1% Triton X-100 and supplemented with a mixture of protease inhibitors] at specific time points. Extracts were then centrifuged for 5 min at 13200g, 20 μg and 40 μg samples of the supernatants were used for Western blots of ERK 1/2 and anti-(phospho-ERK1/2) respectively.
Isolation of plasma membrane and microsomal fractions
Plasma and microsomal membrane fractions were prepared from incubated cells by differential centrifugation. Briefly, liver parenchymal or Fao cells were washed and sonicated in 0.3 M sucrose containing protease inhibitors. The plasma membrane fraction was obtained by centrifugation at 200000 g for 60 min on a discontinuous 1.3 M sucrose gradient, as described previously [30]. After removing the plasma membrane fraction, the sucrose gradient was sonicated, diluted to 0.3 M and centrifuged at 17000 g for 30 min. The resulting supernatant was centrifuged at 200000 g for 60 min to yield the microsomal membrane fraction.
The protein content of these samples was measured according to the Bradford method and 10–30 μg aliquots of protein were used for PAGE and transferred on to IMMOBILON-p Membrane filters (Millipore), as previously described [5]. After probing the blots with the antibodies described above, a secondary peroxidase-coupled anti-rabbit antibody was used at a 1:2000 dilution. Blots were exposed to high-sensitivity films and developed using an ECL® (enhanced chemiluminesence) technique (Amersham Pharmacia).
Biotinylation of plasma membrane proteins
Fao cells were washed twice in PBS containing 1 mM MgCl2 and CaCl2 and then incubated with 500 μM Sulfo-NHS-Biotin (Pierce) in the same buffer for 30 min at room temperature. Cells were washed in PBS containing 2% (v/v) 2-mercaptoethanol to quench the remaining biotin, and twice more in PBS alone. Cells were then lysed with a buffer containing 50 mM NaPO4, 1% (v/v) Triton X-100, 300 mM NaCl and protease inhibitors and centrifuged at 16000g for 30 min at 4 °C. The protein concentration of the supernatant was measured by the Bradford method and equal amounts of protein from each sample were incubated with 30 μl of streptavidin–agarose beads for 90 min with constant rotation at 4 °C. Beads were washed twice in PBS/500 mM NaCl and once in PBS alone. The complexes were dissociated with 30 μl of SDS/PAGE sample buffer heated to 100 °C for 5 min and then run on a 10% acrylamide gel.
Generation of a YFP (yellow fluorescent protein)–rCNT2 (recombinant CNT2) construct and analysis of YFP–rCNT2 insertion into the plasma membrane
A rCNT2 cDNA, kindly donated by Dr Ruben Boado (Department of Medicine, UCLA, CA, U.S.A.) [31] was subcloned into the pE(enhanced)YFP-C1 vector (Clontech) using the EcoR1 and SmaI restriction sites at the 5′ and 3′ ends respectively. This resulted in a tagged rCNT2 with YFP at the N-terminus which was sequenced and transiently transfected into CHO (chinese hamster ovary) cells using FuGENE™ 6 Transfection Reagent (Boehringer). CHO cells were chosen because they are easily transfected and provide a suitable background with no CNT2-related transport activity. The kinetic properties of the tagged and parental cDNA were assayed by measuring guanosine uptake in either an NaCl or a C5H14CINO containing medium as described above, over a range of substrate concentrations, 0.5–150 μM.
HepG2 cells were transiently transfected using Lipofectamine™ (Invitrogen) according to the manufacturer's instructions. Cells were treated with or without 250 μM TCA for 1 h and then washed with PBS and fixed with 4% paraformaldehyde/0.06 M sucrose for 15 min. Samples were mounted with medium suitable for visualizing immunofluorescence (ICN, Costa Mesa, CA, U.S.A.) and analysed using an Olympus Fluo-view 500 confocal microscope (Olympus model IX-70 inverted fluorescence microscope).
PI3K activity
PI3K activity was measured by the amount of in vitro phosphorylation of PI as previously described [32]. At the end of the culture period cells were washed with ice-cold PBS, solubilized in lysis buffer [10 mM Tris/HCl, 5 mM EDTA, 50 mM NaCl, 30 mM Na4O7P2, 50 mM NaF, 100 μM Na3VO4, 1% Triton X-100 (pH 7.6)] containing 10 μg/ml leupeptin, 10 μg/ml aprotinin and 1 mM PMSF. Lysates were purified by centrifugation at 15000 g for 10 min at 4 °C, and proteins were immunoprecipitated using a polyclonal anti-p85α PAN antibody (Upstate Biotechnology Inc., NY, U.S.A.). The immune complexes were collected on Protein A-agarose. The immunoprecipitates were washed successively in PBS containing 1% Triton X-100 and 100 μM Na3VO4 (twice), 100 mM Tris (pH 7.5) in PBS containing 0.5 M LiCl, 1 mM EDTA and 100 μM Na3VO4 (twice), and in 25 mM Tris (pH 7.5) containing 100 mM NaCl and 1 mM EDTA (twice). To each pellet were added 25 μl of 1 mg/ml L-a-phosphatidylinositol/L-a-phosphatidyl-L-serine sonicated in 25 mM Hepes (pH 7.5) and 1 mM EDTA. The PI3K reaction was started by the addition of 100 nM [γ 32P]ATP (10 μCi) and 300 μM ATP in 25 μl of 25 mM Hepes (pH 7.4)/10 mM MgCl2/0.5 mM EGTA, by vol. After 15 min at room temperature the reaction was stopped by the addition of 125 μl chloroform/250 μl methanol/125 μl HCl (10 mM) giving a 1% concentration of HCl. The samples were centrifuged and the organic phase was removed and washed once with 480 μl of methanol/(100 mM HCl/2 mM EDTA; 1:1, v/v). The organic phase was extracted, dried and resuspended in chloroform. Samples were applied to a silica gel TLC plate (Whatman, Clifton, NJ, U.S.A.). TLC plates were developed in 2 M propan-1-ol/acetic acid (65:35, v/v), dried and visualized by autoradiography.
RESULTS
Bile acids do not up-regulate CNT2 protein expression in liver parenchymal cells
Since bile acids are known to transcriptionally activate the basolateral transporter gene NTCP, the first experiment was designed to monitor changes in the amount of CNT2 protein, as measured by Western blot analysis of crude extracts of Fao cells incubated with a panel of bile acids. DCA, GCDCA, TCA or UDCA did not significantly affect the amount of CNT2 protein (Figure 1), even after 10 h of treatment. Similar results were found when using primary cultures of rat hepatocytes (results not shown).
Figure 1. CNT2 protein expression is not regulated by bile acids in Fao cells.

Cell cultures at 65–70% confluence were treated with 250 μM DCA, GCDCA, TCA or UDCA and the amount of CNT2 protein was monitored after 1, 5 and 10 h by Western blot analysis. Untreated cells monitered for 10 h were used as a control. Equal amounts of protein (20 μg) were loaded to allow direct comparisons and a β-actin antibody was used as a loading control. A representative immunoblot (A) and the corresponding densitometric analysis (B) are shown. Data are expressed as the percentage increase in CNT2 protein over control values. Ctrl, control.
Bile acids up-regulate CNT2-related transport activity in liver parenchymal cells by modifying the subcellular localization of CNT2 protein
The effect of DCA, GCDCA, TCA and UDCA on Na+-dependent guanosine transport (by CNT2) was then monitored in Fao cells and primary cultures of rat liver parenchymal cells after incubating cells for 1 h with 250 μM of each bile acid.
TCA and UDCA increased CNT2-related transport activity in both cell types (Figures 2A and 2B), but the effect of GCDCA on transport activity was only significant in Fao cells (Figure 2B). DCA treatment also showed a tendency to activate CNT2 in this hepatoma cell line (Figure 2B). Since these differences could also be due to the time-course of the activation triggered by each bile acid, we next monitored the time-course for CNT2 activity changes in Fao cells after incubating them with these four bile acids at the same concentration (250 μM) (Figure 3). All acids except DCA increased CTN2 transport activity, with peaks at approx. 1 and 2 h after treatment. In all cases the increase began between 30 and 60 min after bile acid treatment. Maximum activation was recorded after 60 min for TCA and UDCA. The concentration dependence of the TCA-triggered effect was then monitored. In Fao cells, TCA increased CNT2 activity 2–3-fold compared with control values, peaking at 250 μM (Figure 4). Concentrations as low as 50–100 μM had a significant effect on transport activity (Figure 4).
Figure 2. Effect of bile acids on CNT2-related transport activity in liver parenchymal cells.
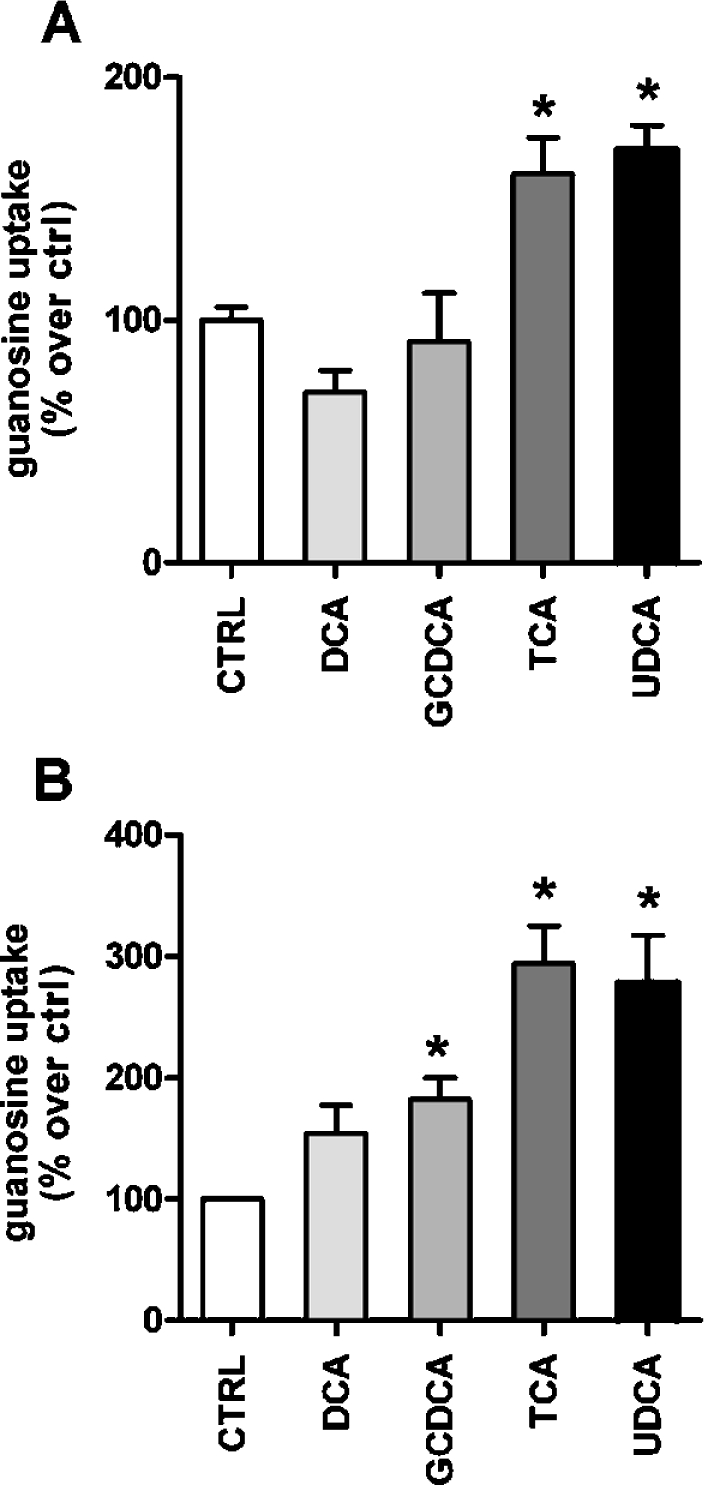
Na+ dependent guanosine uptake was monitored after 1 h incubation of primary rat hepatocyte cultures (A) and Fao cells (B) with different bile acids (DCA, GCDCA, TCA and UDCA, each at 250 μM) as described in the Materials and methods section. Data are the means±S.E.M. for quadruplicate measurements made in 3 independent cultures. Data are expressed as the percentage increase in guanosine uptake over basal values. The basal uptake rate was 9.8±0.7 pmol guanosine/min per mg of protein. Statistical significance was established by a Student's t test (*P<0.05).
Figure 3. Time-course of the activation of CNT2 by bile acids.

Na+ dependent guanosine uptake was monitored in Fao cells after the addition of 250 μM of each bile acid at different time points (15, 30, 60, 120 and 180 min). Results were derived from quadruplicate measurements made in four independent experiments. Data (means±S.E.M.) are shown as the percentage increase in guanasine uptake over control values (non-treated cells). The basal uptake rate was 16±2 pmol guanosine/min per mg of protein.
Figure 4. Concentration-dependent effect of TCA on CNT2 transport activity in liver parenchymal cells.
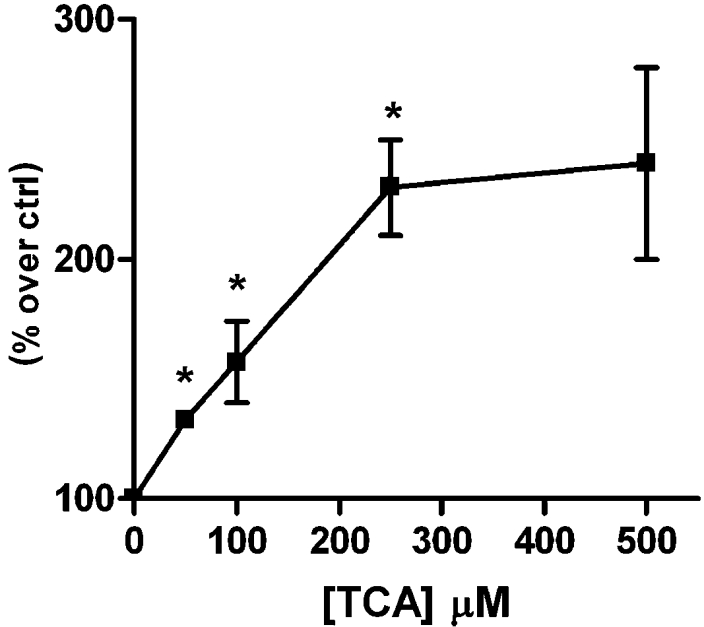
CNT2-mediated uptake was measured in Fao cells after 1 h of treatment with TCA at various concentrations. Results are the means±S.E.M. for three independent determinations measured in quadruplicate. Data are expressed as the percentage of transport activity versus basal guanosine uptake (6.38±0.66 pmol guanosine/min per mg of protein) in control cells. Statistical significance was assessed by a Student's t test (*P<0.05).
Therefore TCA was chosen for further experiments. The amount of CNT2 protein was unchanged at 1 h after the addition of bile acids (Figure 1), and blocking protein synthesis with 10 μg/ml cycloheximide did not inhibit the increase in CNT2-related transport activity (results not shown). Accordingly, this effect could not be caused by de novo CNT2 protein synthesis, therefore we examined the effect of TCA treatment on the amount of CNT2 protein at the plasma membrane. First we used subcellular fractionation to isolate plasma membrane and microsomal fractions. Plasma and microsomal membrane preparations were highly enriched in α1 Na+/K+-ATPase subunits, whereas the pyrimidine nucleoside transporter CNT1, which is mainly located in intracellular structures in liver parenchymal cells [8], was barely detectable in the plasma membrane, but was enriched in the microsomal fraction [33].
Treatment of Fao cells with 250 μM TCA for 1 h increased the amount of CNT2 protein in the plasma membrane fraction (approx. 2-fold compared with non-treated cells) with a parallel decrease in CNT2 protein in intracellular structures (a 2-fold decrease triggered by addition of TCA) (Figure 5A). This observation is consistent with a role for TCA in increasing the insertion of CNT2 transporters from intracellular compartments into the plasma membrane or slowing down the retrieval of CNT2 proteins from the plasma membrane.
Figure 5. Effect of TCA on CNT2 subcellular localization in liver parenchymal cells.

(A) CNT2 expression in plasma (PM) and microsomal (MF) membrane fractions of Fao cells treated with TCA. Cells were incubated either in the presence or absence of 250 μM TCA, and membrane fractions were prepared as described in the Materials and methods section. A representative anti-CNT2 immunoblot and the corresponding densitometric analysis from three independent experiments are shown (upper panel). Data are expressed as the percentage increase in CNT2 expression over control values. Statistical significance was established using a Student's t test (*P<0.05, **P<0.01). Plasma and microsomal membrane fractions were also checked for enrichment of the α1 subunit of the Na+/K+-ATPase and the CNT1 transporter. As expected, plasma membranes are highly enriched in the Na+/K+-ATPase α1 subunit, whereas CNT1 which is known to be largely located in subcellular vesicles, shows a significant enrichment in microsomal membrane fractions in control and TCA treated cells (lower panel). (B) Analysis of CNT2 protein expression in the biotinylated plasma membrane fraction of Fao cells. The analysis was performed by biotinylating the plasma membrane proteins of cells treated either in the presence or absence of 250 μM TCA with Sulfo-NHS-Biotin and purification with streptavidin, as described in the Material and methods section. The amount of CNT2 protein was evaluated by Western blotting of plasma membrane fractions (PM) and cell extracts (H). A representative immunoblot is shown. (C) HepG2 cells were transiently transfected with YFP–rCNT2. Then analysed in vivo for YFP–rCNT2 insertion into the plasma membrane of cultured cells incubated either in the presence or absence of 250 μM TCA for 1 h as described in the Materials and methods section.
To confirm our findings regarding the effect of TCA on the subcellular localization of CNT2 in Fao cells, plasma membrane proteins were biotinylated and CNT2 was then detected by Western blotting in streptavidin-precipitates. TCA (250 μM) increased the amount of biotinylated CNT2 protein in Fao cell extracts (Figure 5B).
Complementary evidence was obtained using a YFP–rCNT2 construct. To determine whether the addition of YFP to the transporter affected transport kinetics, a substrate concentration-dependent analysis of transport function was performed in CHO cells transiently transfected with either pcDNA3-rCNT2 or YFP–rCNT2. CHO cells were chosen because they can be easily transfected and they lack endogenous CNT2-type transport activity. The tagged protein reached the membrane and had similar kinetic properties to the untagged rCNT2. Subsequently, HepG2 cells were transiently transfected with YFP–rCNT2 and treated for 1 h with TCA 250 μM. An increase in the level of the tagged protein in the plasma membrane was detected (Figure 5C).
Involvement of the PI3K/ERK pathway in bile-acid triggered activation of CNT2 in rat liver parenchymal cells
Bile acids are known to activate a variety of intracellular kinases, such as PKC (protein kinase C) isoforms, MAPKs and PI3K [34–36]. To investigate whether treatment with TCA results in increased PI3K activity, liver parenchymal cells (hepatocytes and Fao) were serum starved and subsequently stimulated with 250 μM TCA. The resulting lysates were assayed for PI3K activity as described in Materials and methods section. As shown in Figure 6(A) liver parenchymal cells displayed almost undetectable PI3K activity in anti-p85α immunoprecipitates under control (non-treated cells) conditions. After treatment with TCA, the level of basal PI3K activity rapidly increased. In addition, 250 μM TCA also induced the phosphorylation of ERK1 and ERK2 in Fao cells, without affecting total amounts of unphosphoyrlated ERK1 or ERK2 (Figure 6B). To further explore whether this and/or other pathways are involved in the activation of CNT2, we monitored CNT2-related transport activity in Fao cells after 1 h of treatment with 250 μM TCA, pre-incubated for 30 min with selected signal transduction pathway inhibitors.
Figure 6. Signal pathways implicated in the activation of CNT2 by TCA in liver parenchymal cells.

(A) Cell lysates were immunoprecipitated using an anti-p85α antibody as described in the Materials and methods section and assayed for PI3K activity at the indicated times. (B) Effect of TCA on ERK1/2 phosphorylation in Fao cells. Cell protein extracts were prepared, at different time points (2, 5 and 7 min) after the addition of bile acid, and monitored by Western blotting for changes in the amount of phosphorylated ERK1/2, and total ERK as a control. Representative immunoblots are shown. (C) Involvement of the PI3K/ERK pathway in TCA induction of CNT2 transport activity. Fao cells were pre-incubated for 30 min with the inhibitors wortmannin (100 nM), dibutyryl-AMPc (100 μM), PD98059 (10 μm), colchicin (1 mM) and genistein (60 μM). Cells were then incubated for 1 h either in the presence or absence of 250 μM TCA, and Na+-dependent guanosine uptake was monitored. Results were derived from quadruplicate measurements made in five independent experiments. Data (means±S.E.M.) are shown as the percentage increase in guanosine uptake over control (non-treated cells) values. Basal uptake rate was 8.3±1 pmol guanosine/min per mg of protein. Statistical significance was assessed by a Student's t test (*P<0.05, ***P<0.001). CTRL, control.
Neither chelerytrine chloride (1 μM), a selective inhibitor of PKC or SB202192 (1 μM), a selective antagonist of p38MAPK, modified the activation of CNT2 triggered by TCA (results not shown), whereas the broad tyrosine kinase inhibitor, genistein (60 μM) slightly modified basal and TCA-activated CNT2 transport activities, without affecting CNT2 activation (Figure 6C). However, blocking the ERK pathway with the MEK inhibitor, PD98059 abolished the activation of CNT2 induced by TCA, although this partially but not exclusively accounted for a significant increase in basal guanosine uptake rates (absence of bile acid) following the addition of the inhibitor (Figure 6C). The PI3K inhibitor wortmannin (100 nM), dibutyryl-cAMP (100 μM), an activator of PKA (protein kinase A) which in turn can inhibit the MAPK pathway through Ras/Raf inhibition, and colchicin, (1 mM) a microtubule disruptor, all blocked the effect of TCA on CNT2-related activity, without affecting basal uptake rates (Figure 6C). Glybenclamide (50 μM), an inhibitor of K+ATP channels, known to block the purinergic activation of CNT2, did not affect the activation of CNT2 by TCA (results not shown).
DISCUSSION
This study demonstrates that bile acids, particularly TCA and UDCA, activate the high-affinity adenosine transporter CNT2 in rat hepatocytes and hepatoma cells. Activation is achieved by promoting localization of the transporter to the plasma membrane, by a mechanism implicating the PI3K/Ras/MAPK signal transduction pathway (Figure 7). A scheme that summarizes a hypothetical model for the signal transduction pathway involved in the regulation of CNT2-related activity by TCA in liver parenchymal cells is shown in Figure 7.
Figure 7. Model of the signalling pathway implicated in TCA-regulated CNT2-related activity in liver parenchymal cells.

Based on inhibitor studies, a model for the activation of CNT2 transporter function triggered by TCA is shown. The inhibitors used to generate the data shown in Figure 6 are also included, as well as their targets, thus defining the transduction pathway implicated in this response. TCA treatment increases the abundance of CNT2 at the plasma membrane. From the in vivo tagged-CNT2 assays shown in Figure 5(C), it is deduced that CNT2 translocation is increased. It is likely that, as in the case of BSEP translocation into the apical membrane, TCA transport into cells is required. Nevertheless, Fao cells which are highly responsive to TCA treatment, do not express the major bile acid transporter NTCP, although there is evidence of transporter-mediated TCA uptake, which may be mediated by OATP (organic anion transporter polypeptide) transporters (results not shown). For this reason the molecular identity of the TCA carrier protein has been omitted.
The involvement of bile acids in protein trafficking in liver parenchymal cells has been well established for the insertion of BSEP at the canalicular membrane, thus contributing to the driving force required for bile flow [37]. Thus choleresis induced by tauroursodeoxycholic acid (TUDCA) is associated with translocation of BSEP by a mechanism that is dependent on the activation of the PI3K/Ras/ERK1/2 pathway [23]. BSEP post-translational regulation associated with trafficking and translocation is a paradigm of transporter regulation, since besides the bile acid-regulated insertion into the plasma membrane, BSEP also undergoes constitutive recycling independent of bile acid-regulation and is insensitive to inhibitors of PI3K [38].
To our knowledge this is the first report of post-translational regulation of CNT2 activity associated with changes in its sub-cellular localization. As previously described, the transduction signal pathway implicated in the bile-acid mediated insertion of BSEP into the plasma membrane is similar to the pathway described in the present study for the insertion of CNT2 into the membrane. Nevertheless, p38 MAPK has also been implicated in regulating BSEP trafficking triggered by bile acids [23,37], whereas inhibition of this kinase by SB202192 in our cell models does not block the TCA-triggered effect on CNT2 function, thus suggesting that the pathways leading to BSEP and CNT2 trafficking differ. Moreover, CNT2 is a basolateral transporter [8] and so it is unlikely that CNT2 and BSEP share trafficking pathways to the plasma membrane.
Besides BSEP regulation, bile acids also transcriptionally modulate the expression of the basolateral bile acid transporter NTCP and several enzymes involved in their metabolism [19,21,22]. In fact, all biological actions hitherto ascribed to bile acids are exerted on targets that are involved in bile flow regulation. Although bile acids do not appear to transcriptionally activate the SLC28A2 gene that encodes CNT2, their relatively fast effect on CNT2 activity described in the present study is a novel observation in bile acid physiology. There is no established link between CNT2 function and bile acid metabolism. However, it is known that TCA promotes either nucleoside catabolism or nucleoside incorporation into DNA, dependent upon nutritional status [15,16], and that CNT2 expression is up-regulated during liver cell proliferation [9–11]. Nevertheless, as previously described, CNT2 may have additional functions besides nucleoside salvage, as CNT2 is under purinergic control via KATP channels in hepatocytes [14] and, at least in IEC-6 lines, CNT2-mediated adenosine uptake determines AMPK activation (I. Aymerich, F. Foufelle, P. Ferré, F. J. Casado and M. Pastor-Anglada, unpublished work). This observation links CNT2 function with oxidative metabolism and suggests a role for CNT2 in cell signalling. CNT2 expression is up-regulated in apoptotic LPS (lipopolysaccharide)-treated macrophages [6] and is also a target of the pro-apoptotic agent TGF (transforming growth factor)-β in hepatocytes (R. Valdés, S. Fernández-Veledo, I. Aymerich, F. J. Casado and M. Pastor-Anglada, unpublished work). Whether CNT2 plays a role in the response of hepatocytes to apoptosis, either favouring it or acting as a survival signal, is currently under investigation. Nevertheless, it is interesting to note that bile acids have been shown to have a dual role in the programmed cell death of hepatocytes, since hydrophobic (DCA and GCDCA) and hydrophilic (TCA and UDCA) bile acids have been considered to promote apoptosis and to up-regulate selected survival mechanisms respectively [39–41]. Moreover, hydrophilic anions such as UDCA and TUDCA are known to be cytoprotective against oxidative stress [42] and to suppress mitochondrial membrane perturbation [43]. We hypothesize that the differential regulation of CNT2 activity by bile acids contributes to the fine tuning of energy metabolism in hepatocytes, owing to the novel finding of a role for CNT2 in energy metabolism. Although still speculative at this stage, these putative roles merit further research.
Finally, the ability of selected bile acids to up-regulate CNT2 activity may also be relevant to anti-viral therapy. CNT2 is a high affinity transporter for ribavirin [44], although a comprehensive biochemical analysis of CNT2–ribavirin interactions is not available yet. This nucleoside-derivative is currently used along with IFN (interferon)-α in the treatment of hepatitis C infection [45–48]. Interestingly, hepatitis C infection has also been treated with high doses of UDCA, leading to a decrease in the level of classical hepatotoxicity markers (i.e. alanine aminotransferase and γ-glutamyl transpeptidase) but without any evidence of anti-viral activity [49]. Whether UDCA improves responses to ribavirin therapy remains to be addressed. In accordance with the present results, an improved response to combination therapy is consistent with the reported role of bile acids in CNT2 activity regulation, thus increasing ribavirin availability.
In summary, the present study describes a novel role for bile acids in the post-translational regulation of the high-affinity adenosine transporter CNT2, involving changes in its subcellular localization. This is also the first demonstration that CNT2-related transport activity is regulated by intracellular transporter trafficking. This functional link between bile acids and CNT2 activity further indicates that this nucleoside transporter might have other physiological roles in addition to nucleoside salvage.
Acknowledgments
We are grateful to Professor José Juan García Marín (Department of Physiology and Pharmacology, University of Salamanca, Spain) for critical reading of the manuscript before publication. This work was sponsored by grants SAF2002-0717 and SAF2005-01259 from the Ministerio de Educación y Ciencia (Madrid, Spain) and Generalitat de Calunya (Barcelona, Spain). I. H. -R. and I. A. hold a fellowship from the Ministerio de Educación y Ciencia. S. F. -V. was granted a fellowship from the Ministerio de Ciencia y Tecnología and S. D. was supported by the University of Barcelona.
References
- 1.Kong W., Engel K., Wang J. Mammalian nucleoside transporters. Curr. Drug Metab. 2004;5:63–84. doi: 10.2174/1389200043489162. [DOI] [PubMed] [Google Scholar]
- 2.Gray J. H., Owen R. P., Giacomini K. M. The concentrative nucleoside transporter family, SLC28. Pflugers Arch. 2004;447:728–734. doi: 10.1007/s00424-003-1107-y. [DOI] [PubMed] [Google Scholar]
- 3.Pastor-Anglada M., Molina-Arcas M., Casado F. J., Bellosillo B., Colomer D., Gil J. Nucleoside transporters in chronic lymphocytic leukaemia. Leukemia. 2004;18:385–393. doi: 10.1038/sj.leu.2403271. [DOI] [PubMed] [Google Scholar]
- 4.Che M., Ortiz D. F., Arias I. M. Primary structure and functional expression of a cDNA encoding the bile canalicular, purine-specific Na+-nucleoside cotransporter. J. Biol. Chem. 1995;270:13596–13599. doi: 10.1074/jbc.270.23.13596. [DOI] [PubMed] [Google Scholar]
- 5.Valdes R., Ortega M. A., Casado F. J., Felipe A., Gil A., Sanchez-Pozo A., Pastor-Anglada M. Nutritional regulation of nucleoside transporter expression in rat small intestine. Gastroenterology. 2000;119:1623–1630. doi: 10.1053/gast.2000.20183. [DOI] [PubMed] [Google Scholar]
- 6.Soler C., Valdes R., Garcia-Manteiga J., Xaus J., Comalada M., Casado F. J., Modolell M., Nicholson B., MacLeod C., Felipe A., et al. Lipopolysaccharide-induced apoptosis of macrophages determines the up-regulation of concentrative nucleoside transporters Cnt1 and Cnt2 through tumor necrosis factor-α-dependent and -independent mechanisms. J. Biol. Chem. 2001;276:30043–30049. doi: 10.1074/jbc.M101807200. [DOI] [PubMed] [Google Scholar]
- 7.Soler C., Garcia-Manteiga J., Valdes R., Xaus J., Comalada M., Casado F. J., Pastor-Anglada M., Celada A., Felipe A. Macrophages require different nucleoside transport systems for proliferation and activation. FASEB J. 2001;15:1979–1988. doi: 10.1096/fj.01-0022com. [DOI] [PubMed] [Google Scholar]
- 8.Duflot S., Calvo M., Casado F. J., Enrich C., Pastor-Anglada M. Concentrative nucleoside transporter (rCNT1) is targeted to the apical membrane through the hepatic transcytotic pathway. Exp. Cell Res. 2002;281:77–85. doi: 10.1006/excr.2002.5641. [DOI] [PubMed] [Google Scholar]
- 9.del Santo B., Valdes R., Mata J., Felipe A., Casado F. J., Pastor-Anglada M. Differential expression and regulation of nucleoside transport systems in rat liver parenchymal and hepatoma cells. Hepatology. 1998;28:1504–1511. doi: 10.1002/hep.510280609. [DOI] [PubMed] [Google Scholar]
- 10.Felipe A., Valdes R., Santo B., Lloberas J., Casado J., Pastor-Anglada M. Na+-dependent nucleoside transport in liver: two different isoforms from the same gene family are expressed in liver cells. Biochem. J. 1998;330(Pt 2):997–1001. doi: 10.1042/bj3300997. [DOI] [PMC free article] [PubMed] [Google Scholar]
- 11.Dragan Y., Valdes R., Gomez-Angelats M., Felipe A., Javier Casado F., Pitot H., Pastor-Anglada M. Selective loss of nucleoside carrier expression in rat hepatocarcinomas. Hepatology. 2000;32:239–246. doi: 10.1053/jhep.2000.9546. [DOI] [PubMed] [Google Scholar]
- 12.Larrayoz I. M., Casado F. J., Pastor-Anglada M., Lostao M. P. Electrophysiological characterization of the human Na+/nucleoside cotransporter 1 (hCNT1) and role of adenosine on hCNT1 function. J. Biol. Chem. 2004;279:8999–9007. doi: 10.1074/jbc.M311940200. [DOI] [PubMed] [Google Scholar]
- 13.Smith K. M., Ng A. M., Yao S. Y., Labedz K. A., Knaus E. E., Wiebe L. I., Cass C. E., Baldwin S. A., Chen X. Z., Karpinski E., Young J. D. Electrophysiological characterization of a recombinant human Na+-coupled nucleoside transporter (hCNT1) produced in Xenopus oocytes. J. Physiol. 2004;558:807–823. doi: 10.1113/jphysiol.2004.068189. [DOI] [PMC free article] [PubMed] [Google Scholar]
- 14.Duflot S., Riera B., Fernandez-Veledo S., Casado V., Norman R. I., Casado F. J., Lluis C., Franco R., Pastor-Anglada M. ATP-sensitive K+ channels regulate the concentrative adenosine transporter CNT2 following activation by A1 adenosine receptors. Mol. Cell. Biol. 2004;24:2710–2719. doi: 10.1128/MCB.24.7.2710-2719.2004. [DOI] [PMC free article] [PubMed] [Google Scholar]
- 15.Marin J. J., Barbero E. R., Herrera M. C., Tabernero A., Monte M. J. Bile acid-induced modifications in DNA synthesis by the regenerating perfused rat liver. Hepatology. 1993;18:1182–1192. [PubMed] [Google Scholar]
- 16.Villanueva G. R., Monte M. J., Barbero E. R., Serrano M. A., Marin J. J. Evidence for dual effect of bile acids on thymidine anabolism and catabolism by the regenerating rat liver. Biochim. Biophys. Acta. 1996;1289:136–144. doi: 10.1016/0304-4165(95)00147-6. [DOI] [PubMed] [Google Scholar]
- 17.Parks D. J., Blanchard S. G., Bledsoe R. K., Chandra G., Consler T. G., Kliewer S. A., Stimmel J. B., Willson T. M., Zavacki A. M., Moore D. D., Lehmann J. M. Bile acids: natural ligands for an orphan nuclear receptor. Science (Washington DC) 1999;284:1365–1368. doi: 10.1126/science.284.5418.1365. [DOI] [PubMed] [Google Scholar]
- 18.Walters J. R. Bile acids are physiological ligands for a nuclear receptor. Gut. 2000;46:308–309. doi: 10.1136/gut.46.3.308. [DOI] [PMC free article] [PubMed] [Google Scholar]
- 19.Sirvent A., Verhoeven A. J., Jansen H., Kosykh V., Darteil R. J., Hum D. W., Fruchart J. C., Staels B. Farnesoid X receptor represses hepatic lipase gene expression. J. Lipid Res. 2004;45:2110–2115. doi: 10.1194/jlr.M400221-JLR200. [DOI] [PubMed] [Google Scholar]
- 20.Pircher P. C., Kitto J. L., Petrowski M. L., Tangirala R. K., Bischoff E. D., Schulman I. G., Westin S. K. Farnesoid X receptor regulates bile acid-amino acid conjugation. J. Biol. Chem. 2003;278:27703–27711. doi: 10.1074/jbc.M302128200. [DOI] [PubMed] [Google Scholar]
- 21.Kast H. R., Nguyen C. M., Sinal C. J., Jones S. A., Laffitte B. A., Reue K., Gonzalez F. J., Willson T. M., Edwards P. A. Farnesoid X-activated receptor induces apolipoprotein C-II transcription: a molecular mechanism linking plasma triglyceride levels to bile acids. Mol. Endocrinol. 2001;15:1720–1728. doi: 10.1210/mend.15.10.0712. [DOI] [PubMed] [Google Scholar]
- 22.Konieczko E. M., Ralston A. K., Crawford A. R., Karpen S. J., Crawford J. M. Enhanced Na+-dependent bile salt uptake by WIF-B cells, a rat hepatoma hybrid cell line, following growth in the presence of a physiological bile salt. Hepatology. 1998;27:191–199. doi: 10.1002/hep.510270130. [DOI] [PubMed] [Google Scholar]
- 23.Kurz A. K., Graf D., Schmitt M., Vom Dahl S., Haussinger D. Tauroursodesoxycholate-induced choleresis involves p38(MAPK) activation and translocation of the bile salt export pump in rats. Gastroenterology. 2001;121:407–419. doi: 10.1053/gast.2001.26262. [DOI] [PubMed] [Google Scholar]
- 24.Gao B., St Pierre M. V., Stieger B., Meier P. J. Differential expression of bile salt and organic anion transporters in developing rat liver. J. Hepatol. 2004;41:201–208. doi: 10.1016/j.jhep.2004.04.029. [DOI] [PubMed] [Google Scholar]
- 25.Trauner M., Boyer J. L. Bile salt transporters: molecular characterization, function, and regulation. Physiol. Rev. 2003;83:633–671. doi: 10.1152/physrev.00027.2002. [DOI] [PubMed] [Google Scholar]
- 26.Tanaka F., Hori N., Sato K. Identification of differentially expressed genes in rat hepatoma cell lines using subtraction and microarray. J. Biochem. (Tokyo) 2002;131:39–44. doi: 10.1093/oxfordjournals.jbchem.a003075. [DOI] [PubMed] [Google Scholar]
- 27.Gomez-Angelats M., del Santo B., Mercader J., Ferrer-Martinez A., Felipe A., Casado J., Pastor-Anglada M. Hormonal regulation of concentrative nucleoside transport in liver parenchymal cells. Biochem. J. 1996;313(Pt 3):915–920. doi: 10.1042/bj3130915. [DOI] [PMC free article] [PubMed] [Google Scholar]
- 28.Ritzel M. W., Yao S. Y., Ng A. M., Mackey J. R., Cass C. E., Young J. D. Molecular cloning, functional expression and chromosomal localization of a cDNA encoding a human Na+/nucleoside cotransporter (hCNT2) selective for purine nucleosides and uridine. Mol. Membr. Biol. 1998;15:203–211. doi: 10.3109/09687689709044322. [DOI] [PubMed] [Google Scholar]
- 29.Ritzel M. W., Ng A. M., Yao S. Y., Graham K., Loewen S. K., Smith K. M., Ritzel R. G., Mowles D. A., Carpenter P., Chen X. Z., et al. Molecular identification and characterization of novel human and mouse concentrative Na+-nucleoside cotransporter proteins (hCNT3 and mCNT3) broadly selective for purine and pyrimidine nucleosides (system cib) J. Biol. Chem. 2001;276:2914–2927. doi: 10.1074/jbc.M007746200. [DOI] [PubMed] [Google Scholar]
- 30.Garcia F., Kierbel A., Larocca M. C., Gradilone S. A., Splinter P., LaRusso N. F., Marinelli R. A. The water channel aquaporin-8 is mainly intracellular in rat hepatocytes, and its plasma membrane insertion is stimulated by cyclic AMP. J. Biol. Chem. 2001;276:12147–12152. doi: 10.1074/jbc.M009403200. [DOI] [PubMed] [Google Scholar]
- 31.Li J. Y., Boado R. J., Pardridge W. M. Cloned blood-brain barrier adenosine transporter is identical to the rat concentrative Na+ nucleoside cotransporter CNT2. J. Cereb. Blood Flow Metab. 2001;21:929–936. doi: 10.1097/00004647-200108000-00005. [DOI] [PubMed] [Google Scholar]
- 32.Valverde A. M., Lorenzo M., Navarro P., Benito M. Phosphatidylinositol 3-kinase is a requirement for insulin-like growth factor I-induced differentiation, but not for mitogenesis, in fetal brown adipocytes. Mol. Endocrinol. 1997;11:595–607. doi: 10.1210/mend.11.5.9924. [DOI] [PubMed] [Google Scholar]
- 33.Fernandez-Veledo S., Valdes R., Wallenius V., Casado F. J., Pastor-Anglada M. Up-regulation of the high-affinity pyrimidine-preferring nucleoside transporter concentrative nucleoside transporter 1 by tumor necrosis factor-α and interleukin-6 in liver parenchymal cells. J. Hepatol. 2004;41:538–544. doi: 10.1016/j.jhep.2004.06.008. [DOI] [PubMed] [Google Scholar]
- 34.Stravitz R. T., Rao Y. P., Vlahcevic Z. R., Gurley E. C., Jarvis W. D., Hylemon P. B. Hepatocellular protein kinase C activation by bile acids: implications for regulation of cholesterol 7 α-hydroxylase. Am. J. Physiol. 1996;271:G293–G303. doi: 10.1152/ajpgi.1996.271.2.G293. [DOI] [PubMed] [Google Scholar]
- 35.Rust C., Karnitz L. M., Paya C. V., Moscat J., Simari R. D., Gores G. J. The bile acid taurochenodeoxycholate activates a phosphatidylinositol 3-kinase-dependent survival signaling cascade. J. Biol. Chem. 2000;275:20210–20216. doi: 10.1074/jbc.M909992199. [DOI] [PubMed] [Google Scholar]
- 36.Gupta S., Stravitz R. T., Dent P., Hylemon P. B. Down-regulation of cholesterol 7α-hydroxylase (CYP7A1) gene expression by bile acids in primary rat hepatocytes is mediated by the c-Jun N-terminal kinase pathway. J. Biol. Chem. 2001;276:15816–15822. doi: 10.1074/jbc.M010878200. [DOI] [PubMed] [Google Scholar]
- 37.Kubitz R., Sutfels G., Kuhlkamp T., Kolling R., Haussinger D. Trafficking of the bile salt export pump from the Golgi to the canalicular membrane is regulated by the p38 MAP kinase. Gastroenterology. 2004;126:541–553. doi: 10.1053/j.gastro.2003.11.003. [DOI] [PubMed] [Google Scholar]
- 38.Wakabayashi Y., Lippincott-Schwartz J., Arias I. M. Intracellular trafficking of bile salt export pump (ABCB11) in polarized hepatic cells: constitutive cycling between the canalicular membrane and rab11-positive endosomes. Mol. Biol. Cell. 2004;15:3485–3496. doi: 10.1091/mbc.E03-10-0737. [DOI] [PMC free article] [PubMed] [Google Scholar]
- 39.Schoemaker M. H., Conde de la Rosa L., Buist-Homan M., Vrenken T. E., Havinga R., Poelstra K., Haisma H. J., Jansen P. L., Moshage H. Tauroursodeoxycholic acid protects rat hepatocytes from bile acid-induced apoptosis via activation of survival pathways. Hepatology. 2004;39:1563–1573. doi: 10.1002/hep.20246. [DOI] [PubMed] [Google Scholar]
- 40.Torchia E. C., Stolz A., Agellon L. B. Differential modulation of cellular death and survival pathways by conjugated bile acids. BMC Biochem. 2001;2:11. doi: 10.1186/1471-2091-2-11. [DOI] [PMC free article] [PubMed] [Google Scholar]
- 41.Bernstein C., Payne C. M., Bernstein H., Garewal H. Activation of the metallothionein IIA promoter and other key stress response elements by ursodeoxycholate in HepG2 cells: relevance to the cytoprotective function of ursodeoxycholate. Pharmacology. 2002;65:2–9. doi: 10.1159/000056179. [DOI] [PubMed] [Google Scholar]
- 42.Lapenna D., Ciofani G., Festi D., Neri M., Pierdomenico S. D., Giamberardino M. A., Cuccurullo F. Antioxidant properties of ursodeoxycholic acid. Biochem. Pharmacol. 2002;64:1661–1667. doi: 10.1016/s0006-2952(02)01391-6. [DOI] [PubMed] [Google Scholar]
- 43.Rodrigues C. M., Sola S., Sharpe J. C., Moura J. J., Steer C. J. Tauroursodeoxycholic acid prevents Bax-induced membrane perturbation and cytochrome C release in isolated mitochondria. Biochemistry. 2003;42:3070–3080. doi: 10.1021/bi026979d. [DOI] [PubMed] [Google Scholar]
- 44.Patil S. D., Ngo L. Y., Glue P., Unadkat J. D. Intestinal absorption of ribavirin is preferentially mediated by the Na+-nucleoside purine (N1) transporter. Pharm. Res. 1998;15:950–952. doi: 10.1023/a:1011945103455. [DOI] [PubMed] [Google Scholar]
- 45.Mangia A., Ricci G. L., Persico M., Minerva N., Carretta V., Bacca D., Cela M., Piattelli M., Annese M., Maio G., et al. A randomized controlled trial of pegylated interferon-α-2a (40 Kd) or interferon-α-2a plus ribavirin and amantadine vs interferon-α-2a and ribavirin in treatment-naive patients with chronic hepatitis C. J. Viral Hepat. 2005;12:292–299. doi: 10.1111/j.1365-2893.2005.00591.x. [DOI] [PubMed] [Google Scholar]
- 46.Teuber G., Berg T., Hoffmann R. M., Leifeld L., Lafrenz M., Spengler U., Pape G. R., Hopf U., Zeuzem S. Retreatment with interferon-α and ribavirin in primary interferon-α non-responders with chronic hepatitis C. Digestion. 2000;61:90–97. doi: 10.1159/000007740. [DOI] [PubMed] [Google Scholar]
- 47.Azzaroli F., Accogli E., Nigro G., Trere D., Giovanelli S., Miracolo A., Lodato F., Montagnani M., Tame M., Colecchia A., et al. Interferon plus ribavirin and interferon alone in preventing hepatocellular carcinoma: a prospective study on patients with HCV related cirrhosis. World J. Gastroenterol. 2004;10:3099–3102. doi: 10.3748/wjg.v10.i21.3099. [DOI] [PMC free article] [PubMed] [Google Scholar]
- 48.Berg T., Hoffmann R. M., Teuber G., Leifeld L., Lafrenz M., Baumgarten R., Spengler U., Zeuzem S., Pape G. R., Hopf U. Efficacy of a short-term ribavirin plus interferon-α combination therapy followed by interferon-α alone in previously untreated patients with chronic hepatitis C: a randomized multicenter trial. Liver. 2000;20:427–436. doi: 10.1034/j.1600-0676.2000.020006427.x. [DOI] [PubMed] [Google Scholar]
- 49.Boucher E., Jouanolle H., Andre P., Ruffault A., Guyader D., Moirand R., Turlin B., Jacquelinet C., Brissot P., Deugnier Y. Interferon and ursodeoxycholic acid combined therapy in the treatment of chronic viral C hepatitis: results from a controlled randomized trial in 80 patients. Hepatology. 1995;21:322–327. [PubMed] [Google Scholar]