

Abstract
Background
Toxoplasma gondii is among the most common protozoan parasites of humans. Both attachment to and invasion of host cells by T.gondii are necessary for infection, yet little is known about the molecular mechanisms underlying these processes. T.gondii’s etiological importance and its role as a model organism for studying invasion in related parasites necessitate a means to quantitatively assay host cell attachment and invasion.
Methods
We present here Laser Scanning Cytometer (LSC)-based assays of T.gondii invasion and attachment. The invasion assay involves automated counting of invaded and non-invaded parasites, differentially labeled with distinct fluorochromes. The attachment assay compares the relative binding of differentially labeled parasites. The assays were evaluated using treatments known to decrease invasion or attachment.
Results
The LSC-based assays are robust and reproducible, remove operator bias, and significantly increase the sample size that can be feasibly counted compared to other currently available microscope-based methods. In the first application of the new assays, we have shown that parasites attach to fixed and unfixed host cells using different mechanisms.
Conclusions
The LSC-based assays represent useful new methods for quantitatively measuring attachment and invasion by T.gondii, and can be readily adapted to study similar processes in other host-pathogen systems.
Keywords: Toxoplasma gondii, invasion, attachment, laser scanning cytometer
Introduction
Toxoplasma gondii is an obligate intracellular parasite, and the highly invasive asexual stage, the tachyzoite, exhibits an extraordinary promiscuity in the range of mammalian host cells that it is capable of infecting. The disease caused by an acute T. gondii infection, toxoplasmosis, is of considerable medical importance as it can lead to birth defects and death in the congenitally-infected fetus and can have devastating consequences in the immunocompromised host.
Relatively little is known about the molecular mechanisms by which T. gondii attaches to and invades host cells, although there appears to be substantial conservation in the invasive strategies of T. gondii and other medically important parasites of the phlyum Apicomplexa, such as Plasmodium (the causative agent of malaria) and Cryptosporidium (a significant worldwide cause of waterborne illness). T. gondii is considered a good model for studying apicomplexan invasion due to both the ease with which T. gondii can be cultured and its amenability to molecular genetic manipulation. A primary focus of efforts to prevent and treat diseases caused by apicomplexan parasites involves inhibiting host cell invasion. Given the therapeutic significance, the relative lack of information regarding T. gondii invasion, and the usefulness of T. gondii as a model for other apicomplexan parasites, there is significant interest in studying host cell attachment and invasion by T. gondii.
Invasion by T. gondii has been measured in a number of ways, including plaque assays (e.g., ref 1); incorporation of 3H-uracil (e.g., ref 2,3); β-galactosidase activity (e.g., ref 4); vacuole growth assays (e.g., ref 5); counting intracellular parasites by phase microscopy (e.g., ref 6); quantitative real-time PCR (e.g., ref 7); and fluorescence imaging of intracellular vs. extracellular parasites labeled differentially with fluorochromes (e.g., ref 8). Each of these assays has serious limitations. Some (e.g., PCR and β-galactosidase-based assays) are complicated by the need to either remove or kill all extracellular parasites for accurate counting of those that have invaded (4,7). Others (e.g., plaque assays, vacuole growth assays, and 3H-uracil incorporation) measure a combination of invasion and other post-invasion aspects of the parasite’s life cycle. A decrease in plaque formation, for example, can result from a defect in invasion, but also from defects in intracellular growth, parasite replication, host cell lysis, parasite egress, or any combination of these processes. In contrast, differential fluorescent staining of intracellular vs. extracellular parasites effectively isolates invasion from other aspects of the parasite life cycle. In our experience, however, this microscope-based assay suffers from significant field-to-field variability. This variability is compounded by the extensive hands-on time required for manual counting, and the resulting limited sample sizes that can be feasibly obtained. The most widely used assays for parasite attachment are similarly based on manual counts of fluorescently labeled parasites (8). These assays suffer not only from the same random field-to-field variability as the invasion assay, but also from variations in wash stringency between and within coverslips.
To circumvent these limitations, we have developed novel Laser Scanning Cytometer (LSC)-based assays of T. gondii invasion and attachment. The LSC combines the discriminatory power of fluorescence microscopy with the sampling strengths of flow cytometry. In LSC analysis, samples affixed to a slide are excited by a laser beam and the resulting fluorescence emission is measured at various wavelengths, while retaining the sample for viewing microscopically (reviewed in 9,10). Here, we use the LSC to automatically count differentially labeled invaded or attached parasites within a preset scan area. The LSC-based assays overcome the limitations of the traditional microscope-based assays by reducing operator time and bias, while simultaneously increasing the size of the area and the number of parasites that can be counted. Application of the attachment assay to the analysis of parasite interaction with fixed vs. unfixed host cells reveals previously unrecognized complexities in the mechanisms of host cell attachment. The methods described here fill a need for a means to accurately and quantitatively assay invasion and attachment in T. gondii and related parasites.
Materials and Methods
Parasite and host cell culture
T. gondii (RH strain) and human foreskin fibroblast (HFF) cells were cultured as previously described (11). For all experiments, parasites from freshly lysed, infected HFF cells were recovered by scraping, passage through a 27.5 gauge needle, filtration with a 3μm Nuclepore membrane (Whatman Inc., Clifton, NJ), and centrifugation (1000 x g for 4 minutes). Pelleted parasites were resuspended in HHFCS (Hanks balanced salt solution, 10mM HEPES, pH 7.0, 1% [vol/vol] fetal calf serum [FCS]), and counted. Monolayers of HFFs used for invasion and attachment assays were grown to confluence on circular (25mm diameter) glass coverslips.
Invasion assay
1.5x10⁶ parasites were incubated for 10min at 23°C in 3ml HHFCS with or without 1μM Cytochalasin D (CytD). The parasites were added to HFF monolayers on coverslips in 6 well plates and incubated at 37°C for 1 hour. All subsequent incubations were carried out at 23°C. The coverslips were washed 3 times with PBS, fixed with 3.1% (vol/vol) formaldehyde and 0.06% (vol/vol) glutaraldehyde for 30 minutes, and washed immediately 3 times with PBS. After blocking for 10 min in PBS containing 2% (wt/vol) bovine serum albumin (BSA; PBS-2XBSA), samples were labeled for 25 minutes with a mouse monoclonal antibody (Argene, North Massapequa, NY) against the major glycosylphosphatidylinositol-anchored surface protein of the parasite (designated SAG1 or P30; (12,13); the antibody was diluted to 0.5 μg/ml in PBS containing 1% [wt/vol] BSA (PBS-BSA). Samples were washed 3 times with PBS and labeled for 25 minutes with goat anti-mouse R-phycoerythrin (“orange”; DAKO, Carpenteria, CA) diluted 1/400 from product stock in PBS-BSA. After washing 3 times with PBS, samples were permeabilized in PBS containing 0.25% (vol/vol) Triton X-100 for 30 minutes, washed 3 times with PBS, and blocked in PBS-2XBSA for 10 minutes. Samples were then labeled with mouse anti-SAG1 as above, washed, and labeled with goat anti-mouse IgG conjugated to Alexa 647 (“long-red”; Molecular Probes, Eugene OR) diluted to 4 μg/ml in PBS-BSA. Coverslips were washed 3 times in PBS and mounted on slides in PBS.
Attachment assay
Parasites were preincubated for 10 min at 23°C in HHFCS with or without 80μM 1,2-bis(2-aminophenoxy)ethane-N,N,N,N-tetraacetic acid–acetoxymethyl ester (BAPTA-AM) (Molecular Probes) and 5mM ethylene glycol-bis-(2-aminoethyl)-N,N,N',N'-tetraacetic acid (EGTA) (Sigma), centrifuged, resuspended in fresh HHFCS with or without BAPTA-AM/EGTA and incubated an additional 10 min at 23°C. Alternatively, parasites were incubated at 23°C (control) or 60°C for 30 minutes. All parasites were collected by centrifugation and resuspended in HHFCS. Parasites were labeled for 15 minutes at 23°C with anti-SAG1 that had been directly conjugated to either Alexa 488 (“green”) or Alexa 647 (“long-red’) according to the manufacturer’s instructions (Molecular Probes). Parasites were centrifuged, resuspended in HHFCS and counted. 106 fluorescently-labeled parasites from each preparation (untreated, BAPTA-AM/EGTA-treated, or heat-treated), labeled either green or long-red, were added pairwise to either unfixed HFF monolayers (pre-blocked 30 min in PBS–2XBSA), or HFF monolayers that had been fixed for 30 minutes in 2.5% (vol/vol) formaldehyde, 0.05% (vol/vol) glutaraldehyde, and blocked at 4°C overnight with 0.16M ethanolamine. After allowing the parasites to settle and attach for 15 min at 37°C, coverslips were washed immediately. “Low stringency” washing consisted of 3 washes, 3mls of PBS each, directed gently against the wall of the 6-well plate. “Medium stringency” washing consisted of “low stringency” washing followed by an additional 6 ml wash, delivered directly from a 25 ml pipette onto the center of the coverslip. “High stringency” washing consisted of “medium stringency” washing plus two additional 6 ml washes. The coverslips were then fixed in methanol on ice for 10 min, washed 3 times in PBS, and mounted on slides in PBS.
Laser Scanning Cytometry
Samples were analyzed on a CompuCyte Laser Scanning Cytometer (CompuCyte, Cambridge, MA) equipped with a BX50 upright fluorescence microscope (Olympus America, Melville, NY), 20x objective (N.A. 0.5), argon ion (488 nm) and helium/neon (633 nm) lasers, and three filter blocks/photomultiplier tubes (530–555nm [green], 600–640nm [orange], and 650nm [long-red]). Data were acquired and analyzed using Wincyte 3.4 Software (CompuCyte).
Invasion
Since all parasites, intracellular and extracellular, were labeled long-red (LR), total parasites were counted by contouring on long-red events. Dual labeled (extracellular) parasites were counted by detecting orange (OR) spots within long-red events, using the Wincyte algorithms designed for analyzing FISH spots. Event-contouring threshold (LR 800), PMT voltage (LR 30%, OR 40%), and offset (LR 2048, OR 2121) were set using monolayers infected with parasites labeled with only one fluorochrome (OR or LR). A minimum area of 4μm2 was used for long-red events and orange FISH spots, and 2 pixels were added to ensure coverage of the entire long-red parasite. For background subtraction, the area between 4 and 6 pixels away from the event fluorescence was used. To accurately count two parasites that may be too close to create separate contours, final parasite counts were determined by counting orange (threshold 1100) and long-red (theshhold 1100) FISH spots within the long-red contour.
Attachment
Separate program files were created with contours set around long-red or green parasites on fixed and unfixed host cells. The same area of the coverslip was scanned twice, once using the green program file and once using the long-red program file. Event-contouring threshold (LR 1250, Fixed Green 2500, unfixed Green 1250), PMT voltage (LR 39, Green 45), and offset (LR 2048, Green 2100) were set using monolayers infected with parasites labeled with only one fluorochrome (green or long-red). A minimum area of 4μm2 was used for LR and Green events, and 2 pixels were added to ensure coverage of the entire parasite. For background subtraction, the area between 4 and 6 pixels away from the event fluorescence was used. To accurately count two parasites that may be too close to create separate contours, final parasite counts were determined by counting the FISH spots within the same colored contour (threshold LR 1050, green fixed 2000, green unfixed 1250).
Results
LSC-based invasion assay
The invasiveness of untreated and CytD-treated parasites was compared using the LSC-based invasion assay. Previous studies have shown that CytD inhibits T. gondii invasion (but not attachment) by disrupting parasite actin polymerization and, consequently, parasite motility (14). Figure 1A shows representative scatterplots from invasion assay scans for untreated (panel 1) and CytD-treated (panel 2) parasites. In the assay, all parasites are labeled with Alexa 647 (long-red fluorescence); extracellular parasites are also labeled with R-phycoerythrin (orange fluorescence). Parasites that fluoresce long-red but not orange are therefore parasites that have invaded. Such parasites have a high long-red maximum pixel value but a low orange maximum pixel value and cluster along the Y-axis in panels 1 and 2. Dual labeled (extracellular) parasites cluster along a diagonal from the origin in panels 1 and 2. Panels 3 and 4 show the distribution of singly labeled parasites (red spots on the figure) and dual labeled parasites (white spots) throughout the corresponding 3.5mm2 scan areas. It is readily apparent from a comparison of either panels 1 and 2 or panels 3 and 4 that there are fewer invaded (long-red only) and more extracellular (dual labeled) parasites in the CytD-treated sample (panels 2 and 4) than in the untreated sample (panels 1 and 3).
Fig. 1. Effect of CytD on invasion, as measured by the LSC-based assay.
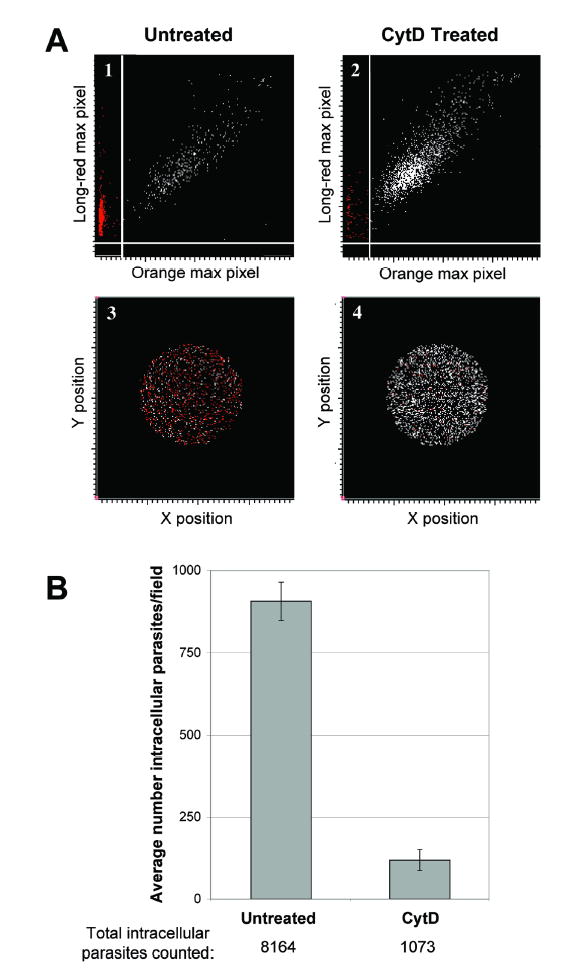
A. Representative scatterplots from the LSC comparing host cell invasion by untreated (panels 1 and 3) vs. CytD-treated (panels 2 and 4) parasites. Extracellular parasites (labeled both long-red-and orange) are represented by white spots; intracellular parasites (labeled long-red only) are represented by red spots. Panels 1 and 3 plot the long-red maximum pixel values against orange maximum pixel values. Panels 3 and 4 show the position of each parasite in the corresponding 3.5mm2 circular scan areas.
B. Subtracting the number of extracellular (dual labeled) parasites from the total number of parasites (long-red) yields the number of intracellular parasites. Three identically sized areas were scanned within each coverslip, and experiments were performed in triplicate. The average number of intracellular parasites per scan is shown; error bars represent the standard deviation between all nine scans. The total number of intracellular parasites counted is shown below the graph.
Subtracting the number of extracellular (dual labeled) parasites from the total number of parasites (long-red) in a given scan area yields the number of intracellular parasites. Each 3.5mm2 scan area contains 3356 +/− 123 confluent host cells. Using the average number of intracellular parasites per scan area as a measure of invasion, CytD treatment is seen to cause a >85% decrease in the invasiveness of parasites (Fig. 1B, p<0.005), as expected. The total number of intracellular parasites counted for each treatment is displayed below the graph, illustrating the sampling power of the LSC. Traditional assays that rely on manual counts typically record data from hundreds of parasites, while the LSC can readily count thousands of parasites.
When identical scan areas of the same coverslip were assayed multiple times, the number of parasites counted was found to vary by less than 0.1%. The optimal size and location of the scan areas were also determined. Setting the diameter of a circular scan area at approximately 3.5mm2 and selecting areas around the center of the coverslip resulted in the minimum field-to-field variability. The variability between coverslips was determined to be four times greater than the variability of different fields within the same coverslip; to increase statistical significance, more samples should therefore be counted from separate coverslips than from within the same coverslip.
LSC-based attachment assay
In the attachment assay, two populations of parasites, each labeled with either a long-red or green fluorescent antibody, are plated in a 1:1 ratio onto the same monolayer and the number of long-red and green parasites within the same field are counted using the LSC (Fig. 2). Comparing the attachment of the two parasite populations within the same field on the same coverslip ensures that they are subjected to the same local variations in distribution and wash conditions, yielding an accurate and highly reproducible measure of relative attachment.
Fig. 2. Overview of attachment assay.
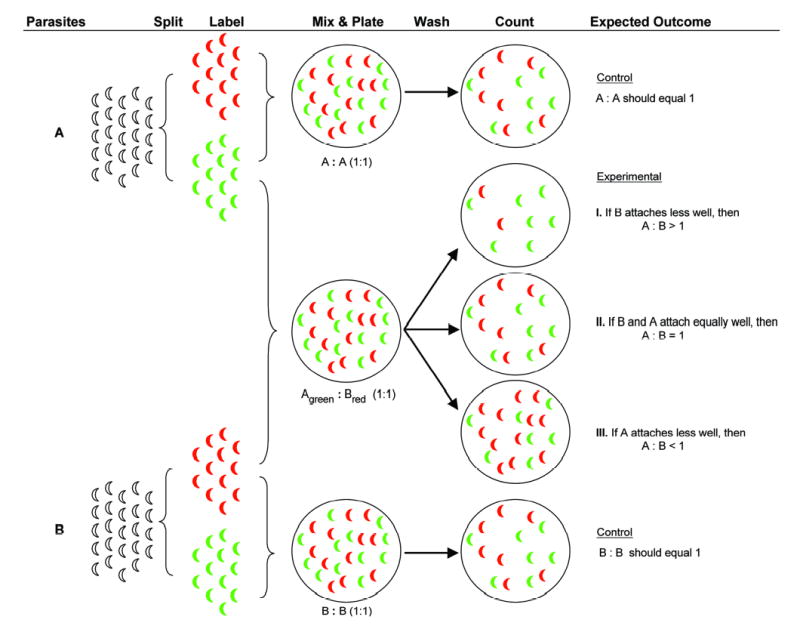
To compare the ability of two different populations of parasites (A, B) to attach to host cells, each population is first split in two and labeled with either long-red or green antibody. To verify accurate counting and to control for any differential effects of long-red vs. green labeling, long-red and green parasites from the same population are mixed in a 1:1 ratio, and plated onto HFF monolayers. After 15 min at 37°C, the monolayers are washed and the number of attached long-red and green parasites are counted using the LSC. The ratio of long-red:green parasites in the control samples should equal 1; if the average ratio is either <0.9 or >1.1, data from that experiment are discarded. Mixing parasites from the two different populations can result in one of three outcomes: if B attaches less well than A, the A:B ratio as scored by the LSC will be greater than one; if there is no difference in the attachment of B and A, the A:B ratio will equal one, and if B attaches to a greater extent than A, the A:B ratio will be less than one.
To evaluate the quantitative accuracy of the assay, a single population of parasites was divided in two, labeled either long-red or green, mixed in different ratios, and plated onto HFF monolayers. After 15 min at 37°C, the coverslips were washed and the number of long-red and green parasites in multiple fields counted on the LSC. An excellent correlation is observed between the ratio of long-red:green parasites plated onto to the monolayer and the ratio of long-red:green parasites subsequently scored as attached by the LSC (Fig. 3). These data also demonstrate that there is no detectable difference between the effects of long-red vs. green labeling on the ability of the labeled parasites to attach. Additional experiments showed that labeled parasites and unlabeled parasites attach equivalently to fixed and unfixed host cells (data not shown). Absolute counts of the number of attached parasites can differ by as much as 7-fold from field-to-field on the same coverslip (data not shown), consistent with our previous experience using standard attachment assays. This observation underscores the advantage of measuring the relative number of attached parasites, rather than attempting to measure the absolute number.
Fig. 3. The ratio of parasites scored as attached is directly proportional to the ratio of parasites added.
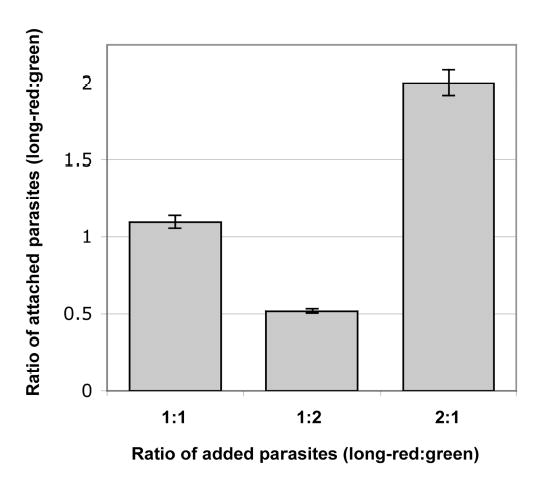
A single preparation of parasites was divided in two and labeled either long-red or green as described in the text. Long-red and green parasites were mixed together in different ratios, plated onto live HFF monolayers and incubated at 37°C for 15 minutes. Samples were washed and fixed, and the total number of long-red and green attached parasites was counted using the LSC. Three identically sized areas were scanned within each coverslip. Error bars represent the standard deviation between scan areas.
To further evaluate the assay, coverslips plated with a 1:1 ratio of identical parasites, labeled either long-red or green, were washed with different stringencies (Fig. 4). The absolute number of attached parasites decreased with more forceful washing, as expected, but the ratio of attached parasites remained approximately one. The relative attachment of the two parasite populations is therefore unaffected by variations in wash strength; such variations represent a significant source of error in absolute measurements of attachment.
Fig. 4. Wash stringency affects the absolute number but not the ratio of attached parasites.
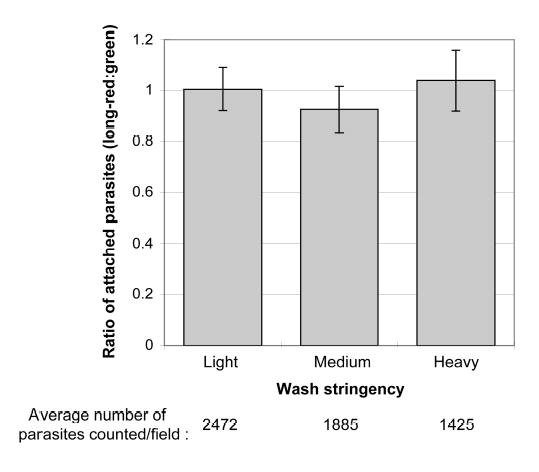
A single preparation of parasites was divided in two and labeled either long-red or green as described in the text. Long-red and green parasites were mixed in a 1:1 ratio, plated onto live HFF monolayers, and incubated at 37°C for 15 minutes. Coverslips were washed with different stringencies, fixed, and the number of long-red and green parasites attached to the monolayer determined using the LSC. More stringent washes decrease the total number of parasites attached, but do not affect the ratio of long-red:green parasites attached. Three identically sized areas were scanned within each coverslip and replicate experiments were performed. Error bars represent the standard deviation between all of the scans.
To determine whether the LSC-based assay could detect differences in attachment between parasite populations, we tested treatments predicted to reduce the ability of parasites to attach to host cells. Since we were mixing different parasite populations on the same host cell monolayer, the treatments chosen had to affect the parasites but not the host cells. Therefore, parasites were either treated with BAPTA-AM and EGTA, to decrease intracellular calcium (15), or heat killed by a 30 min incubation at 60°C (16). Figure 5 shows the relative ability of untreated, BAPTA/EGTA-treated, and heat-treated parasites to attach to fixed or unfixed host cells. In each case, parasites from the same population that were labeled either long-red or green, counted and then recombined in a 1:1 ratio were found to attach to fixed and unfixed monolayers with the expected 1:1 ratio (shown for the untreated parasites, left bars, Fig. 5). This confirms that attachment was not differentially affected by long-red vs. green labeling, and it serves as an important control for accurate counting of the parasite suspensions under test. Compared to untreated controls, BAPTA/EGTA treatment was found to significantly reduce attachment of parasites to fixed, but not to unfixed, host cells (Fig. 5, middle bars). Conversely, heat treatment significantly reduced attachment of parasites to unfixed, but not fixed, monolayers (Fig. 5, right bars). Additional experiments with unfixed monolayers showed that increased wash stringency further decreases the ratio of heat-treated to untreated parasites (data not shown), demonstrating that more vigorous washing removes proportionally more heat-treated than untreated parasites.
Fig. 5. BAPTA/EGTA and heat treatment differentially inhibit attachment to fixed and unfixed host cells.
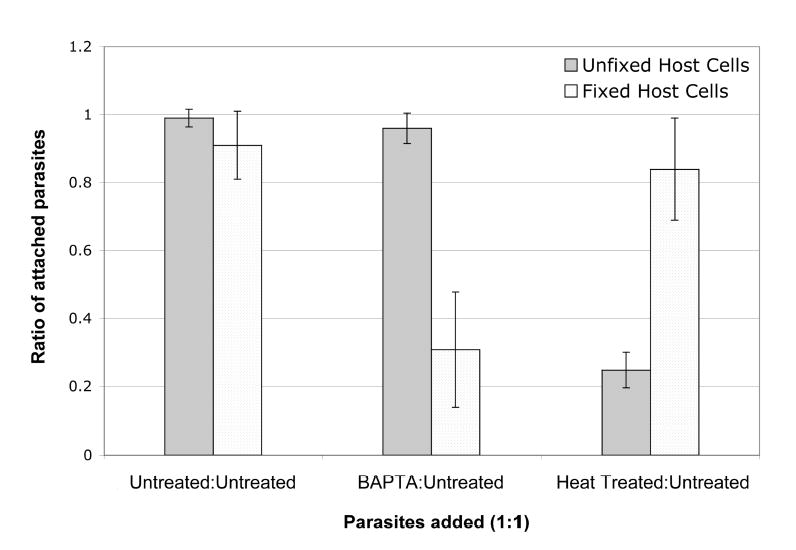
Parasites were treated with BAPTA/EGTA or incubated at 60°C for 30 min to reduce their ability to attach to host cells. Each population of treated and untreated (control) parasites was divided in half and labeled either long-red or green as described in the text. Labeled parasites were mixed pairwise in a 1:1 ratio, plated onto either fixed host cells (gray bars) or unfixed host cells (stippled bars), and incubated for 15 minutes at 37°C. Samples were then washed, fixed, and counted using the LSC. When long-red parasites were mixed with green parasites from the same original population, the resulting ratio was in each case ~1 (combined data for untreatedlong-red:untreatedgreen are shown in the left 2 bars). Three identically sized areas within each coverslip were scanned in duplicate experiments. Error bars represent the standard deviation for each set of counts.
Discussion
The LSC-based assays described in this report offer several advantages over traditional microscope-based T. gondii invasion and attachment assays. Most importantly, the use of the LSC to automate the counting process eliminates operator bias and significantly increases the number of parasites that can be feasibly counted, increasing the reproducibility and statistical power of the assay. In the course of developing these assays, a variety of fluorescent labels, fixatives, and labeling conditions were tested to determine the optimum conditions (highest sensitivity and selectivity with least spectral overlap) for LSC-based detection of parasites. The ability of the LSC to recall and microscopically examine and confirm each data point greatly enhanced our ability to optimize reagents and instrument settings. It should be noted, however, that since each sample requires scanning of multiple fields on independent coverslips, these assays are not well suited to the analysis of many samples at one time (e.g., high-throughput screening). This is particularly true for the attachment assay, which compares parasite populations pairwise. Rather, the strength of the assays lies in their ability to measure invasion and attachment with a high degree of accuracy and reproducibility. Possible applications of the assay include phenotypic analysis of parasites containing disruptions in specific, invasion-related genes (e.g., ref17), and quantitative dose-response analysis of pharmacological inhibitors of invasion (18). In situations where an LSC is not available, it may be possible to adapt these assays for analysis by flow cytometry (19).
Both fixed (20–22) and unfixed (20,22–24) host cells have previously been used as target cells in attachment assays, and each offers advantages and disadvantages. The major advantage to fixed cells is that, because they cannot be invaded [(22) and data not shown], all parasites that remain associated with a fixed monolayer after washing are extracellular and, by definition, attached. The major disadvantage to fixed cells is that chemical fixation may alter the properties of surface molecules that function in the process of attachment. The use of unfixed monolayers circumvents this problem, but determining the total number of parasites that attach to an unfixed monolayer during the course of an experiment requires counting both extracellular attached parasites and intracellular invaded parasites (since the parasites attach before invading). Antibody-labeled parasites are less fluorescent after they invade, due to partial stripping of the labeled antibody during invasion [(25) and data not shown]; this, combined with the fact that fixing monolayers generates background autofluorescence in the green channel, requires that different optimal instrument settings be determined for accurately measuring attachment to fixed and unfixed monolayers.
BAPTA-AM/EGTA treatment significantly reduces secretion from the parasite’s micronemes, organelles whose discharge is associated with invasion (4). Our observation that BAPTA-AM/EGTA treatment has little effect on parasite attachment to unfixed cells differs from a previously published report in which attachment was completely abolished by BAPTA-AM pretreatment (8). However, a range of effects of BAPTA-AM on attachment/invasion have been reported, from complete inhibition to only marginal effects (e.g., ref 4,8,26). While some of these differences may be due to differences in experimental procedure, the range of results reported underscores both the need for a reliable, reproducible attachment assay and the importance of looking at relative rather than absolute levels of attachment.
The results presented here demonstrate that BAPTA/EGTA treatment and heat treatment differentially affect the parasite’s ability to attach to fixed vs. unfixed monolayers. Heat treatment kills parasites by mechanisms that have yet to characterized (16); the biological relevance of attachment of heat-killed parasites is therefore unknown. Nonetheless, the data show that parasites attach to fixed and unfixed host cells using different mechanisms; otherwise, the decreases in attachment caused by BAPTA/EGTA and/or heat treatment should be similar for fixed and unfixed host cells. Similarly, the finding that more heat treated than untreated parasites wash off with increased wash stringency emphasizes the fact that “attachment” is an operational definition, and that data from any one attachment assay need to be interpreted with caution in terms of their biological relevance.
The LSC-based assays described in this report fill an important experimental need in the study of T. gondii, by providing a means to quantitatively measure attachment and invasion. Furthermore, these assays can be readily adapted to study similar processes in any pathogenic microorganism for which antibodies against surface markers are available.
Acknowledgments
We thank Jeff Buzas and Alan Howard (University of Vermont Statistical Consulting Clinic) for their assistance with statistical analysis, and Mariana Matrajt, Vern Carruthers, and members of the Ward laboratory for comments on the manuscript. This work was supported by PHS grants AI054961 and AI063276 (GW), the Burroughs Wellcome Fund (GW), a Kauffman fellowship from the University of Vermont College of Medicine (JM), and in part by grant P30 CA22435 from the National Cancer Institute (contents of this article are solely the responsibility of the authors and do not necessarily represent the official views of the NCI).
References
- 1.Pfefferkorn ER, Pfefferkorn LC. Toxoplasma gondii: isolation and preliminary characterization of temperature-sensitive mutants. Experimental Parasitology. 1976;39(3):365–76. doi: 10.1016/0014-4894(76)90040-0. [DOI] [PubMed] [Google Scholar]
- 2.Saffer LD, Long Krug SA, Schwartzman JD. The role of phospholipase in host cell penetration by Toxoplasma gondii. Am J Trop Med Hyg. 1989;40(2):145–9. doi: 10.4269/ajtmh.1989.40.145. [DOI] [PubMed] [Google Scholar]
- 3.Hehl AB, Lekutis C, Grigg ME, Bradley PJ, Dubremetz JF, Ortega-Barria E, Boothroyd JC. Toxoplasma gondii Homologue of Plasmodium Apical Membrane Antigen 1 Is Involved in Invasion of Host Cells. Infect Immun. 2000;68(12):7078–7086. doi: 10.1128/iai.68.12.7078-7086.2000. [DOI] [PMC free article] [PubMed] [Google Scholar]
- 4.Carruthers VB, Giddings OK, Sibley LD. Secretion of micronemal proteins is associated with Toxoplasma invasion of host cells. Cellular microbiology. 1999;1(3):225–235. doi: 10.1046/j.1462-5822.1999.00023.x. [DOI] [PubMed] [Google Scholar]
- 5.Meissner M, Schluter D, Soldati D. Role of Toxoplasma gondii myosin A in powering parasite gliding and host cell invasion. Science. 2002;298(5594):837–40. doi: 10.1126/science.1074553. [DOI] [PubMed] [Google Scholar]
- 6.Ryning FW, Remington JS. Effect of cytochalasin D on Toxoplasma gondii cell entry. Infect Immun. 1978;20(3):739–43. doi: 10.1128/iai.20.3.739-743.1978. [DOI] [PMC free article] [PubMed] [Google Scholar]
- 7.Naguleswaran A, Muller N, Hemphill A. Neospora caninum and Toxoplasma gondii: a novel adhesion/invasion assay reveals distinct differences in tachyzoite-host cell interactions. Exp Parasitol. 2003;104(3–4):149–58. doi: 10.1016/s0014-4894(03)00137-1. [DOI] [PubMed] [Google Scholar]
- 8.Lovett JL, Sibley LD. Intracellular calcium stores in Toxoplasma gondii govern invasion of host cells. J Cell Sci. 2003;116(Pt 14):3009–16. doi: 10.1242/jcs.00596. [DOI] [PubMed] [Google Scholar]
- 9.Tarnok A, Gerstner AO. Clinical applications of laser scanning cytometry. Cytometry. 2002;50(3):133–43. doi: 10.1002/cyto.10099. [DOI] [PubMed] [Google Scholar]
- 10.Darzynkiewicz Z, Bedner E, Li X, Gorczyca W, Melamed MR. Laser-scanning cytometry: A new instrumentation with many applications. Exp Cell Res. 1999;249(1):1–12. doi: 10.1006/excr.1999.4477. [DOI] [PubMed] [Google Scholar]
- 11.Roos DS, Donald RG, Morrissette NS, Moulton AL. Molecular tools for genetic dissection of the protozoan parasite Toxoplasma gondii. Methods in Cell Biology. 1994;45:27–63. doi: 10.1016/s0091-679x(08)61845-2. [DOI] [PubMed] [Google Scholar]
- 12.Nagel SD, Boothroyd JC. The major surface antigen, P30, of Toxoplasma gondii is anchored by a glycolipid. J Biol Chem. 1989;264(10):5569–74. [PubMed] [Google Scholar]
- 13.Kasper LH, Crabb JH, Pfefferkorn ER. Purification of a major membrane protein of Toxoplasma gondii by immunoabsorption with a monoclonal antibody. J Immunol. 1983;130(5):2407–12. [PubMed] [Google Scholar]
- 14.Dobrowolski JM, Sibley LD. Toxoplasma invasion of mammalian cells is powered by the actin cytoskeleton of the parasite. Cell. 1996;84(6):933–9. doi: 10.1016/s0092-8674(00)81071-5. [DOI] [PubMed] [Google Scholar]
- 15.Carruthers VB, Sibley LD. Mobilization of intracellular calcium stimulates microneme discharge in Toxoplasma gondii. Mol Microbiol. 1999;31(2):421–8. doi: 10.1046/j.1365-2958.1999.01174.x. [DOI] [PubMed] [Google Scholar]
- 16.Sibley LD, Weidner E, Krahenbuhl JL. Phagosome acidification blocked by intracellular Toxoplasma gondii. Nature. 1985;315(6018):416–9. doi: 10.1038/315416a0. [DOI] [PubMed] [Google Scholar]
- 17.Mital J, Meissner M, Soldati D, Ward GE. Conditional Expression of Toxoplasma gondii Apical Membrane Antigen-1 (TgAMA1) Demonstrates That TgAMA1 Plays a Critical Role in Host Cell Invasion. Mol Biol Cell in Press, published July 6, 2005 as 10.1091/mbc.E05-04-0281. [DOI] [PMC free article] [PubMed]
- 18.Carey KL, Westwood NJ, Mitchison TJ, Ward GE. A small-molecule approach to studying invasive mechanisms of Toxoplasma gondii. Proc Natl Acad Sci U S A. 2004;101(19):7433–8. doi: 10.1073/pnas.0307769101. [DOI] [PMC free article] [PubMed] [Google Scholar]
- 19.Gay-Andrieu F, Cozon G, Ferrandiz J, Kahi S, Peyron F. Flow Cytometric Quantification of Toxoplasma Gondii Cellular Infection and Replication. J Parasitol. 1999;85(3):545–549. [PubMed] [Google Scholar]
- 20.Huynh MH, Rabenau KE, Harper JM, Beatty WL, Sibley LD, Carruthers VB. Rapid invasion of host cells by Toxoplasma requires secretion of the MIC2-M2AP adhesive protein complex. EMBO. 2003;22(9):2082–90. doi: 10.1093/emboj/cdg217. [DOI] [PMC free article] [PubMed] [Google Scholar]
- 21.Ortega-Barria E, Boothroyd JC. A Toxoplasma Lectin-like Activity Specific for Sulfated Polysaccharides Is Involved in Host Cell Infection. J Biol Chem. 1999;274(3):1267–1276. doi: 10.1074/jbc.274.3.1267. [DOI] [PubMed] [Google Scholar]
- 22.Mineo JR, McLeod R, Mack D, Smith J, Khan IA, Ely KH, Kasper LH. Antibodies to Toxoplasma gondii major surface protein (SAG-1, P30) inhibit infection of host cells and are produced in murine intestine after peroral infection. J Immunol. 1993;150(9):3951–64. [PubMed] [Google Scholar]
- 23.Kieschnick H, Wakefield T, Narducci CA, Beckers C. Toxoplasma gondii attachment to host cells is regulated by a calmodulin-like domain protein kinase. J Biol Chem. 2001;276(15):12369–77. doi: 10.1074/jbc.M011045200. [DOI] [PubMed] [Google Scholar]
- 24.Jacquet A, Coulon L, De Neve J, Daminet V, Haumont M, Garcia L, Bollen A, Jurado M, Biemans R. The surface antigen SAG3 mediates the attachment of Toxoplasma gondii to cell-surface proteoglycans. Mol Biochem Parasitol. 2001;116(1):35–44. doi: 10.1016/s0166-6851(01)00297-3. [DOI] [PubMed] [Google Scholar]
- 25.Dubremetz JF, Rodriguez C, Ferreira E. Toxoplasma gondii: redistribution of monoclonal antibodies on tachyzoites during host cell invasion. Exp Parasitol. 1985;59(1):24–32. doi: 10.1016/0014-4894(85)90053-0. [DOI] [PubMed] [Google Scholar]
- 26.Song HO, Ahn MH, Ryu JS, Min DY, Joo KH, Lee YH. Influence of calcium ion on host cell invasion and intracellular replication by Toxoplasma gondii. Korean J Parasitol. 2004;42(4):185–93. doi: 10.3347/kjp.2004.42.4.185. [DOI] [PMC free article] [PubMed] [Google Scholar]