Abstract
When treated with DNA-damaging chemotherapy agents, many cancer cells, in vivo and in vitro, undergo a terminal growth arrest and acquire a senescence-like phenotype. We investigated the molecular basis for this in breast cancer cells following a 2-hour treatment with 1 μM doxorubicin. Treated cells arrested in G1 and G2 phases of the cell cycle, with concomitant reductions in S-phase and G2-M regulatory genes. p53 and p21 protein levels increased within hours after treatment and were maintained for 5 to 6 days but were reduced 8 days posttreatment, though the cells remained growth arrested. Levels of p130 rose after drug treatment, and it was the primary RB family member recruited to the S-phase promoters cyclin A and PCNA and G2-M promoters cyclin B and cdc2, remaining present for the entire 8-day time period. In contrast, p107 protein and promoter occupancy levels declined sharply after drug treatment. RB was recruited to only the PCNA promoter. In MCF-7 cells with p130 knockdown, p107 compensated for p130 loss at all cell cycle gene promoters examined, allowing cells to retain the growth arrest phenotype. Cells with p130 and p107 knockdown similarly arrested, while cells with knockdown of all three family members failed to downregulate cyclin A and cyclin B. These results demonstrate a mechanistic role for p130 and compensatory roles for p107 and RB in the long-term senescence-like growth arrest response of breast cancer cells to DNA damage.
Many cancer cell types exposed to genotoxic stress undergo permanent cell cycle arrest and acquire a senescence-like phenotype (SLP). Treatment with DNA-damaging agents, such as many of the commonly used chemotherapy agents, induces phenotypic changes in cell cultures of cancer cells similar to those observed in replicative senescence of normal human cells (6). These include an enlarged, flattened morphology, positive staining for β-galactosidase at low pH (i.e., senescence-associated β-galactosidase [SA β-Gal]) (6, 9), induction of p21 (7, 17, 43), reductions in expression of cell cycle-regulatory genes (17), hypophosphorylation of RB (17, 43), and a permanent growth arrest while maintaining viability. Recent evidence now suggests that the SLP is an important outcome in treatment of cancers with many chemotherapy reagents (2, 10).
The senescence program is executed by changes in gene expression that are mediated by transcription factors (33). Several studies have shown that the presence of functional p53 and its transcriptional target, p21, is important for the senescence-like response to genotoxic stress induced by DNA-damaging agents and, when either gene is inactivated or deleted, cells preferentially undergo apoptosis rather than senescence (7, 9, 17).
Because E2F transcription factors regulate expression of cell cycle target genes (3), negative regulation of E2F targets is an important component for initiating and maintaining arrest. The product of the retinoblastoma (RB) gene is a major transcriptional regulator of E2F target genes involved in cell cycle progression and, hence, can mediate growth arrest states (18). RB and its homologous family members, RBL1/p107 and RBL2/p130 (herein referred to as p107 and p130), operate by association with E2F transcription factors and other proteins to alter gene expression and inhibit cell cycle progression (18). RB family members then regulate gene expression by recruiting cofactors that repress transcription by directing changes in chromatin structure (15). These chromatin changes can be implemented by recruiting histone deacetylases (HDACs), histone methyltransferases, SWI/SNF complex members, and, less well characterized, DNA methyltransferases and polycomb proteins (12).
In the absence of mitogenic signals, RB family members are hypophosphorylated and capable of binding E2Fs at target sites (18). Stein et al. found that RB was in its active, hypophosphorylated form in senescent normal cells and could not be phosphorylated upon serum stimulation (38). Numerous studies have since shown RB to be involved in the senescence program (reviewed in reference 4). Much less work has been performed in determining the roles of the other family members, p107 and p130, in cellular senescence.
In addition to the substantial in vitro data, this phenomenon of chemotherapy-induced the SLP in cancer cells has been observed in vivo (31). Studies have shown that cells of breast or lung tumors resected from patients who had received neoadjuvant chemotherapy had markers of senescence, including positive staining for SA β-Gal, while normal surrounding tissue or tumors resected from untreated patients did not (30, 43). Further, positive SA β-Gal staining was associated with low-level p53 staining (indicative of wild-type p53; mutant p53 accumulates due to its inability to transactivate the p53 negative regulator MDM2) and increased p16 staining, suggesting a cell cycle arrest similar to the one observed in vitro (43). Schmitt et al. used transgenic c-myc to induce lymphomas in mice in various genetic backgrounds and also introduced further genetic modifications in tumor explants using retrovirus (32). They found that tumors lacking genes involved in the SLP, such as p53 and p16, had decreased disease-free and overall survival following treatment with a DNA-damaging chemotherapy agent. Drug-treated lymphomas with wild-type p53, in the presence of an apoptotic block, were growth arrested and exhibited the classic characteristics of the SLP, including SA β-Gal staining. They concluded that the SLP was induced in vivo after chemotherapy treatment with DNA-damaging agents, resulting in tumor stasis and improved outcome (32). These studies demonstrate the importance of the SLP in cancer treatment; however, the molecular mechanisms have not been well defined.
Here, we describe molecular events in the induction of the SLP in breast cancer cells that involve a p53-p21 response early after drug treatment (4 h to 6 days) followed by p130 recruitment to key promoters regulating cell cycle transitions, histone deacetylation at those promoters, and gene repression, resulting in a long-term growth-arrested state. Further, we show that p107 compensated for ablation of p130 by dramatically increasing its levels at the cell cycle gene promoters. Knockdown of all three RB family members was required in order to bypass the downregulation of cell cycle genes in response to drug treatment. These data suggest that loss of more than one RB family member, and probably all three, would be necessary for bypass of the growth arrest/senescence response to chemotherapy drugs.
MATERIALS AND METHODS
Cell culture.
ZR-75 cells were from the American Type Culture Collection (Manassas, VA), and MCF-7 cells were a gift of C. K. Osborne, Baylor College of Medicine (Houston, TX). Cells were cultured regularly in minimal essential medium with Earle's salts (Invitrogen, Carlsbad, CA), 10% fetal bovine serum (HyClone, Logan, UT), nonessential amino acids, and, occasionally, for a limited number of passages, penicillin-streptomycin (Invitrogen). For treatments, cells were plated at 4 million cells/150-mm dish, and doxorubicin (Calbiochem, San Diego, CA) was added to a final concentration of 1 μM for 2 h, followed by a wash with phosphate-buffered saline (PBS) and reapplication of complete growth medium.
Cell cycle analysis.
After treatments as indicated in the figure legends, cells in 10-cm dishes were trypsinized and pelleted by centrifugation, washed twice with PBS, and then fixed in 70% ethanol. After two additional PBS washes, the pellet was resuspended in 400 μl low-salt stain (0.03 g/ml polyethylene glycol, 0.05 mg/ml propidium iodide, 4 mM sodium citrate and 0.1% Triton X-100), followed by the addition of 20 μg of RNase A and a 20-min incubation at 37°C. High-salt stain (400 μl; 0.03 g/ml polyethylene glycol, 0.05 mg/ml propidium iodide, 400 mM NaCl, and 0.1% Triton X-100) was then added, and samples were analyzed by the UTHSCSA/SACI FACScan core facility.
Western blotting.
After treatments, cells were washed twice with cold PBS and then harvested in TNESV lysis buffer (50 mM Tris [pH 7.4], 1% NP-40, 2 mM EDTA, 100 mM NaCl, 0.1% sodium dodecyl sulfate [SDS], 10 mM sodium orthovanadate, plus 100× protease inhibitor cocktail). Protein concentration was determined by the copper-bicinchoninic acid method with a Pierce Laboratory (Rockford, IL) kit, and then 50 μg of total protein was loaded onto 8% or 10% polyacrylamide gels (Bio-Rad, Hercules, CA) and transferred to nitrocellulose (Bio-Rad), and immunoblotting was performed essentially as previously described (20). Antibodies used were as follows: for RB, C15 or IF8; for p107, C18; for p130, C20; for cyclin A, C19 or BF683; for cyclin B1, GNS1; for cdc2, H-297; for cyclin E, C19 (Santa Cruz Biotech, Santa Cruz, CA); and PCNA (Dako, Copenhagen, Denmark). Horseradish peroxidase-linked secondary antibodies to mouse or rabbit immunoglobulin were from Amersham Pharmacia Biotech (Arlington Heights, IL). All dilutions were 1 μg/ml for primary antibodies and 2,000:1 for secondary antibodies, in 5% nonfat dried milk in TBST (0.15 M NaCl; 0.01 M Tris HCl, pH 7.4; and 0.05% Tween 20).
Chromatin immunoprecipitation.
Chromatin immunoprecipitations were performed essentially as previously described (14, 40). Antibodies used were acetylated histone H3 (06-599, Upstate Biotech Inc., Charlottesville, VA), C15 (for RB), C18 (for p107), C20 (for p130), and D01 (for p53) (Santa Cruz Biotech), each previously characterized for chromatin immunoprecipitation (27, 39, 45). Briefly, after chromatin was cross-linked by addition of formaldehyde, fixation was stopped by the addition of glycine. Plates (150 mm) were harvested in SDS buffer (100 mM NaCl; 50 mM Tris-HCl, pH 8.1; 5 mM EDTA, pH 8.0; 0.02% NaN3; and 0.5% SDS, plus protease inhibitors). Cells were pelleted and then resuspended in 0.75 ml (per T150 flask) ice-cold immunoprecipitation (IP) buffer (100 mM Tris, pH 8.6; 0.3% SDS; 1.7% Triton X-100; 5 mM EDTA) for sonication to an average length of 300 to 1,000 bp by pulsing 5 times for 20 s at power setting 3 and 100% duty cycle on a Branson Sonifier 450. Sonication was confirmed by agarose gel electrophoresis. A protein assay was performed as described above, and triplicates of 1 to 1.5 mg of protein in 1 ml of IP buffer were precleared with 25 μl of salmon sperm/protein A agarose beads (UBI, 16-157C). A 25-μl portion of the 1-ml IP solution was saved as an input control. Primary antibody (2 μg) was added overnight at 4°C, and immune complexes were captured by incubation with salmon sperm/protein A agarose, followed by washes as described previously (14). Input controls and washed immune complex pellets were resuspended in 250 μl of 1% SDS, 0.1 M NaHCO3, and samples were incubated overnight at 65°C to elute immune complexes and to reverse the cross-links. Digestion with proteinase K was followed by phenol-chloroform-isoamyl alcohol extraction and ethanol precipitation. Pelleted chromatin was resuspended in 200 to 300 μl of H2O. Real-time PCR was performed in a 384-well plate on a ABI Prism 7900HT with 5 μl 2× SYBR green PCR master mix (Applied Biosystems), 1 μl each of 8 μM forward and reverse primers, and 3 μl of the template. Primers for acetylcholine receptor (AchR), MCM4 (E2F site, −208 relative to transcription start site), PCNA (E2F site, +547) (40), and p21 (5′ site) (22) were previously published. Other primers, designed using Primer Express (Applied Biosystems) (each is within 100 bp of the E2F sites), were cdc2 forward (starting at −140 relative to transcription start site; TTC CTC TTT CTT TCG CGC TCT A), cdc2 reverse (AGC CAA TCA GAG CCC AGC TA), Cyclin B1 forward (starting at −34; GGC AGC CGC CAA TGG), Cyclin B1 reverse (CTC CCT CCT TAT TGG CCT GTT), Cyclin A forward (starting at −100; GCG CTT TCA TTG GTC CAT TT), and Cyclin A reverse (GCG GCT GTT CTT GCA GTT C). Data were presented as percentages of the total, calculated exactly as previously published (14).
Reverse transcriptase real-time PCR.
RNA was extracted using Trizol reagent (Invitrogen) and treated with DNase (New England Biolabs, Ipswich, MA) according to the manufacturer's instructions. cDNAs were synthesized from 4 μg of RNA in a 40-μl volume using the TaqMan kit (N808-0234; Applied Biosystems, Foster City, CA) according to the manufacturer. The PCR program was 25°C for 10 min, 48°C for 30 min, 95°C for 5 min. cDNAs were serially diluted 10:1 four times in 40 μl. Six microliters of the four dilutions, plus undiluted and no template control (six reactions/gene), was mixed with 8.4 μl of water, 16.6 μl of 2× SYBR master mix, and 0.65 μl of 10 μM forward and reverse primers. Ten microliters was transferred to wells of a 384-well plate, and PCR was performed: 50°C for 2 min, 95°C for 10 min, and 40 repetitions of 95°C for 15 s and 60°C for 1 min. Relative RNA abundance was calculated according to Pfaffl et al. using actin mRNA as a reference (29). Real-time PCR primers for cyclin A and cyclin B (11), cdc2 (16), and PCNA (40) have been described.
Stable transfections.
p130 short hairpin RNA (shRNA) (targeting GAG CAG AGC UUA AUC GAA UUU) was cloned into pSilencer 3.1-H1 neo (catalog no. 5770) according to the manufacturer's instructions (Ambion, Austin, TX). MCF-7 cells were plated at 106 cells/10-cm dish. The next day, 24 μl of Plus reagent (Invitrogen, Carlsbad, CA) was added to 4 μg of either the p130 shRNA plasmid or control shRNA-expressing plasmid in 400 μl of OptiMEM (Invitrogen, Carlsbad, CA), mixed gently, and then incubated at room temperature for 15 min. This mixture was added to 400 μl of OptiMEM with 16 μl Lipofectamine (Invitrogen), followed by gentle mixing and further incubation for 15 min, and finally the 800 μl was added dropwise to cells in 5 ml of complete medium. After 3 h, the medium was changed. The next day, cells were split 5:1, and the following day they were changed to G418 (400 μg/ml, Invitrogen)-containing medium. After approximately 2 weeks, individual colonies were picked, expanded, and screened for knockdown.
Transient siRNA transfections.
Cells were plated in a six-well plate (300,000 per well) in complete growth medium. The next day, a total concentration of 80 nM small interfering RNA (siRNA) (Dharmacon, Lafayette, CO) (control only, control plus target, or two targets), 100 μl of OptiMEM (Invitrogen), and 12 μl of Plus Reagent (Invitrogen) were gently mixed and then incubated at room temperature for 15 min, followed by addition of a 100-μl OptiMEM/9 μl Lipofectamine (Invitrogen) mix and further incubation for 15 min. The transfection mixture (200 μl per well) was added dropwise to cells on 1 ml of OptiMEM. After a 3-h incubation, the medium was changed to complete growth medium. Sequences of siRNAs (Dharmacon) were as follows: p107 (siRNA 05), CAA GAG AAG UUG UGG CAU AUU; p107 (siRNA 06), CAC AGC ACU CCA UUU AUA UU; RB (siRNA 05), GAA AGG ACA UGU GAA CUU AUU; and RB (siRNA 06), GAA GAA GUA UGA UGU AUU GUU. siCONTROL nontargeting siRNA was from Dharmacon, catalog number D-001210-02-05.
RESULTS
Breast cancer cells arrest in G1 and G2 after doxorubicin treatment.
Many cancer cell lines, including MCF-7 breast cancer cells, undergo a terminal cell cycle arrest resembling replicative senescence after treatment with DNA-damaging agents, including the topoisomerase inhibitor doxorubicin (6, 9). MCF-7 cells adopt a large, flattened morphology, fail to incorporate BrdU or divide, and stain positively for senescence-associated β-galactosidase (6, 9; also data not shown).
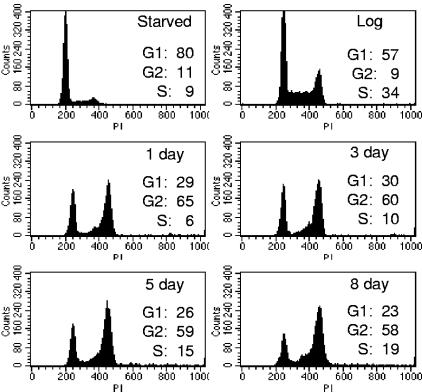
In our investigation of the cellular mechanisms responsible for this SLP, we treated asynchronously growing MCF-7 cells with 1 μM doxorubicin for 2 h, then reapplied complete growth medium, and harvested cells for further study at various time points. To determine the cell cycle fraction of treated cells, we performed flow cytometry analysis on propidium iodide-stained cells. Serum-starved cells contained predominantly a 2N content of DNA, indicating G0/G1 phase, while the S-phase fraction increased significantly in cells growing asynchronously in log phase, from 9% to 34% (Fig. 1). After drug treatment, MCF-7 cells arrested with both 2N and 4N DNA content, indicating cells in G1 and G2-M phases of the cell cycle, respectively (Fig. 1). This arrest was accompanied by the familiar morphological changes (data not shown) observed by others (6, 9, 43) and was maintained for at least 10 days after drug removal. An increase in apoptosis, as evidenced by cells with a sub-G1 content, was observed at all drug treatment time points and in serum-starved cells, reaching approximately 20% of the treated cell population by day 8 (data not shown). Over the treatment time course, we observed a modest loss of G1 and G2 cells and the appearance of “S-phase-fraction” cells in some experiments, including that whose results are shown in Fig. 1. The S-phase cells appeared to result from the emergence of a “shoulder” at the G2 peak, possibly representing some DNA degradation in G2 cells. Likewise, the loss of cells from G1 could also be due to a fraction of the population undergoing apoptosis. However, apoptotic cells were a minority of the population, as has been previously observed for MCF-7 cells treated with DNA-damaging agents (43), and the treated cells with the SLP generally maintained confluence across the bottom of the well (data not shown). A similar pattern of G1 and G2 arrest following a 2-h doxorubicin treatment was also observed in ZR-75 breast cancer cells (data not shown).
FIG. 1.
MCF-7 cells arrest in G1 and G2 after doxorubicin treatment. Doxorubicin-treated (1 μM for 2 h, followed by a PBS wash and replacement with fresh media, harvested at indicated time points), serum-starved (2 days), or asynchronously growing (Log) MCF-7 monolayers were harvested for propidium iodide staining and flow cytometry to determine cell cycle fraction. Data are representative of at least three independent experiments.
Transient activation of the p53 pathway following doxorubicin treatment.
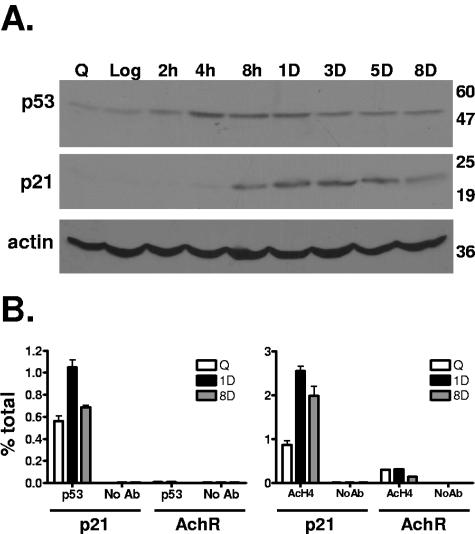
We began our investigation into the mechanism of permanent arrest in breast cancer cells by studying the p53 pathway. MCF-7 and ZR-75 cells have wild-type p53 and RB (25, 46). In agreement with previous reports, p53 protein accumulated rapidly after drug treatment, with an increase evident just 2 to 4 h posttreatment (Fig. 2A; data not shown for ZR-75). Levels of the cyclin-dependent kinase inhibitor p21, a direct transcriptional target of p53, rose in a delayed fashion, approximately 8 h posttreatment (Fig. 2A).
FIG. 2.
Drug treatment activates the p53-p21 pathway in breast cancer cells. (A) Subconfluent MCF-7 monolayers, serum starved for 2 days (Q), asynchronously growing (Log), or treated with 1 μM doxorubicin for 2 h, followed by a change to fresh media for the indicated times, were harvested for Western blotting or chromatin immunoprecipitation according to Materials and Methods. p53, p21, and actin immunoblots show increased p53 and p21 levels early after drug treatment, diminishing 8 days after drug treatment. Molecular weight markers are indicated at the right. (B) Chromatin immunoprecipitations with p53 (left chart), acetylated histone H4 (right chart), and a no-antibody control were performed on MCF-7 cells treated as indicated. Real-time PCR analysis was performed using primers for the p21 or acetylcholine receptor (AchR) promoter regions as indicated, and results are expressed as percentages of the input. Error bars represent standard errors of the mean for triplicates. Data are representative of at least two independent experiments.
The increased p53 and p21 levels were maintained posttreatment, 3 to 5 days in MCF-7 cells (Fig. 2A and data not shown) and 8 days in ZR-75 cells (data not shown). Interestingly, at later time points posttreatment (day 6 to 7 for MCF-7, day 9 to 10 for ZR-75), p53 and p21 levels had decreased significantly, although the cells did not reenter the cell cycle. We performed p53 chromatin immunoprecipitation (ChIP) in treated MCF-7 cells and found that p53 occupancy of the p21 promoter rose acutely in cells after drug treatment but decreased by 8 days, in concordance with total protein levels of p53 and p21 (Fig. 2B, left). p53 was not enriched at the negative control acetylcholine receptor promoter, and immunoprecipitations without primary antibody failed to bring down any p21 promoter DNA, demonstrating the specificity of the experiment (Fig. 2B, left). ChIP with acetylated histone H4 antibody showed that the increase in p21 protein was accompanied by an increase in the amount of histone H4 acetylation at the p21 promoter, followed by a modest but reproducible decrease in histone acetylation at 8 days (Fig. 2B, right). Histone H3 acetylation was also increased 1 day following drug treatment but, interestingly, was not reduced at 8 days (data not shown). The negative control acetylcholine receptor promoter, which is not expressed, had low levels of histone acetylation (Fig. 2B, right). These findings prompted us to investigate the regulation of other cell cycle proteins to determine the cause of the continued arrest and the SLP despite the reduction in p21 levels.
Reduced protein, mRNA, and promoter histone acetylation of cell cycle regulatory genes following doxorubicin treatment.
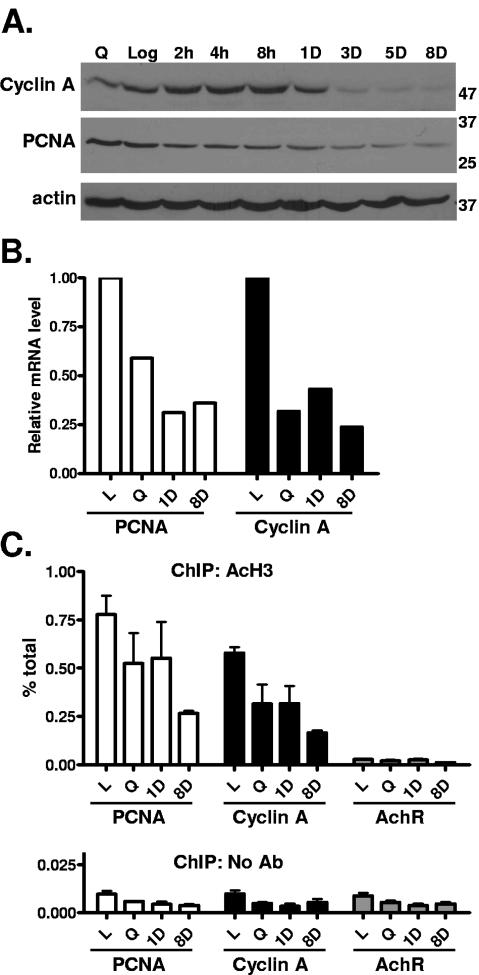
Because doxorubicin-treated MCF-7 and ZR-75 cells arrested in both G1 and G2-M, we investigated the regulation of genes involved in these cell cycle transitions. We found that protein and mRNA levels of S-phase genes for cyclin A and PCNA were greatly reduced in the treated MCF-7 cells (Fig. 3A and B) and ZR-75 cells (data not shown), whereas actin levels were relatively unchanged (Fig. 3A, bottom). Similar to cyclin A, protein levels of another key regulator of G1-S transition, cyclin E, were also found to be reduced at 3, 5, and 8 days posttreatment (data not shown). ChIP experiments revealed that histone H3 acetylation at these S-phase promoters was reduced as early as 1 day following treatment and markedly reduced in the SLP cells 8 days after treatment, below the level observed in serum-starved cells (Fig. 3C). Histone acetylation of the promoters was highest in asynchronously growing log-phase cells, when protein and mRNA expression levels were also maximal, and was low and relatively unchanged by treatment at the negative control acetylcholine receptor promoter (Fig. 3C).
FIG. 3.
Downregulation of S-phase regulatory genes in doxorubicin-treated breast cancer cells. MCF-7 cells were treated and harvested as for Fig. 2. (A) Western blotting for cyclin A, PCNA, and an actin control was performed. Molecular weight markers are indicated at the right. (B) mRNA levels of cell cycle genes were determined using reverse transcriptase real-time PCR. (C) Chromatin immunoprecipitations with acetylated histone H3 antibody or a no-antibody control were performed on MCF-7 cells treated as indicated, followed by real-time PCR analysis using primers for the cyclin A, PCNA, and AchR promoters. Data are expressed as percentages of the input, and error bars represent standard errors of the mean for triplicates. Data are representative of at least two independent experiments.
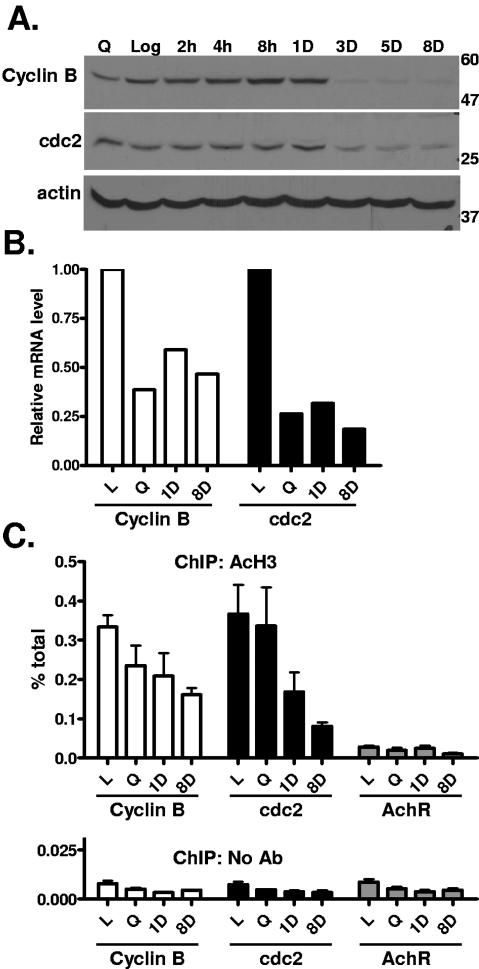
Investigating the G2 arrest, we found that protein and mRNA levels of the key regulators cyclin B and cdc2 were sharply reduced in MCF-7 cells (Fig. 4A and B) and ZR-75 cells (data not shown) with the drug-induced SLP, and ChIP experiments showed a concomitant reduction in histone H3 acetylation at these promoters (Fig. 4C). Of note, cdc2 (Fig. 4A) and PCNA (Fig. 3A) protein levels remained relatively elevated in serum-starved cells, but mRNA levels appeared reduced, suggesting the possibility of regulation at the level of protein stability. Expression of the protein actin was not changed by drug treatment (Fig. 4A, bottom), and levels of histone acetylation at the acetylcholine receptor promoter were low and not changed significantly by drug treatment (Fig. 4C).
FIG. 4.
Downregulation of G2-M regulatory genes in doxorubicin-treated breast cancer cells. MCF-7 cells were treated and harvested as for Fig. 2. (A) Western blotting for cyclin B, cdc2, and an actin control was performed. Molecular weight markers are indicated at the right. (B) mRNA levels of cell cycle genes were determined using reverse transcriptase real-time PCR. (C) Chromatin immunoprecipitations with acetylated histone H3 antibody or a no-antibody control were performed on MCF-7 cells treated as indicated, followed by real-time PCR analysis using primers for the cyclin B, cdc2, and AchR promoters. Data are expressed as percentages of the input, and error bars represent standard errors of the mean for triplicates. Data are representative of at least two independent experiments.
Differential expression of RB family members after drug treatment.
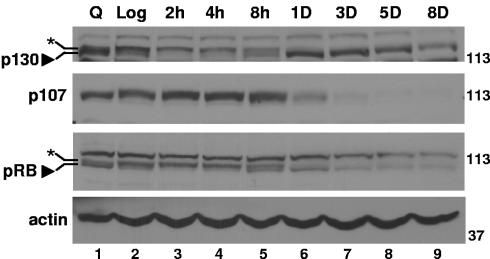
RB has been implicated in the senescence program in numerous experimental model systems (4). Further, RB and its family members, p107 and p130, are known to regulate cell cycle transitions by interacting with E2Fs and recruiting corepressors to E2F target sites (3, 8, 24, 47). We found that levels of the RB family member p130 increased approximately 1 day after treatment in MCF-7 cells compared to log-phase cells and remained elevated for at least 5 to 8 days (Fig. 5, top; also evident in lighter exposures). p130 was predominantly in its slower-migrating, hyperphosphorylated form in asynchronously growing log-phase cells and in cells treated for 2 or 4 h (Fig. 5, top, lanes 2 to 4, indicated by asterisk). Eight hours following drug treatment, coinciding with increased p21 levels (Fig. 2A), p130 appeared as a doublet representing both hyper- and hypophosphorylated forms (Fig. 5, top, lane 5) and, 1 day to 8 days later, predominated in the hypophosphorylated form (Fig. 5, top, lanes 6 to 9, indicated by arrowhead). Not surprisingly, p107 levels decreased after drug treatment (Fig. 5, second panel), as p107 is itself an E2F target (48). No changes in p107 phosphorylation status were detected by changes in migration position; however, the drastic reduction in protein level would make a change difficult to detect. RB levels declined (Fig. 5, third panel; also evident in Fig. 7A), although, as with p130, treatment did result in an increase in the faster-migrating hypophosphorylated band (indicated by arrowhead), first appearing as a doublet at 8 h (Fig. 5, third panel, lane 5) compared to the hyperphosphorylated form, which was prominent in log-phase cells and cells treated for 2 or 4 h (Fig. 5, third panel, lane 2, indicated by asterisk). Drug-treated ZR-75 cells behaved similarly: p107 levels declined, p130 increased, and RB levels were somewhat reduced, with an increase in hypophosphorylated RB (data not shown). These data demonstrate that the protein levels of RB family members change differentially with drug treatment, but they do not indicate which RB family member(s) actively mediates changes in histone acetylation status at promoters and regulates gene expression. Therefore, we next investigated RB family occupation of the promoters of the S-phase and G2-M regulatory genes.
FIG. 5.
Changes in levels and phosphorylation status of RB family members in doxorubicin-treated breast cancer cells. MCF-7 cells were treated and harvested as for Fig. 2, and then Western blotting for p130, p107, RB, and an actin control was performed. Molecular weight markers are indicated at the right. Data are representative of at least three independent experiments.
FIG. 7.
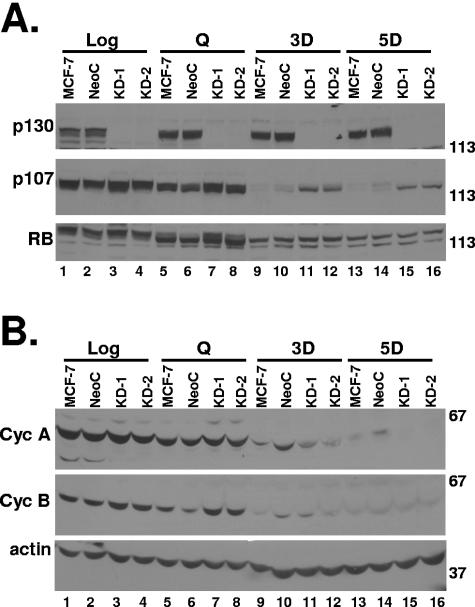
MCF-7 cells with shRNA-mediated p130 knockdown retain arrest phenotype. MCF-7 parental cells, a clone expressing a nonsense shRNA (NeoC3), and two independent clones expressing shRNA targeting p130 (KD-1 and KD-2) were treated as indicated in the figure and then harvested for Western blotting with the indicated antibodies. Molecular weight markers are indicated at the right. Similar data were found for five of five p130 KD clones tested.
p130 is recruited to S-phase and G2-M promoters after drug treatment.
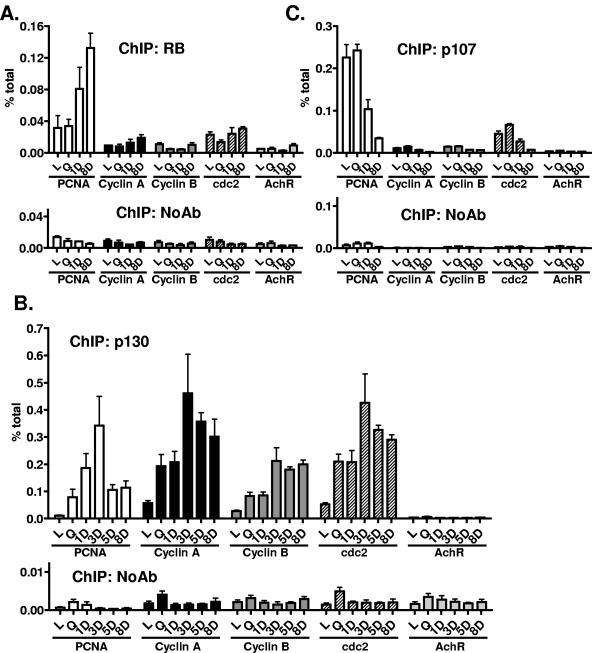
We performed ChIP experiments at the various gene promoters using previously well-characterized antibodies (27, 39). RB antibody immunoprecipitated DNA only from the PCNA promoter, and levels there did increase 1 and 8 days after drug treatment (Fig. 6A). RB was not present at levels significantly greater than those in the no-antibody control at the promoters of the S-phase genes and E2F targets cyclin A (Fig. 6A) and MCM4 (data not shown) or the G2-M regulators cyclin B and cdc2 (Fig. 6A). As expected, RB was absent at the acetylcholine receptor promoter (Fig. 6A).
FIG. 6.
RB family recruitment to cell cycle regulatory gene promoters in doxorubicin-treated MCF-7 cells. MCF-7 cells were treated and harvested at the time points indicated in the figure, and then chromatin immunoprecipitations with (A) RB, (B) p130, and (C) p107, each with accompanying no-antibody controls, were performed. Real-time PCR analysis was then performed using primers for the PCNA, cyclin A, cyclin B, cdc2, or AchR promoters as indicated. Data are expressed as percentages of the input, and error bars represent standard errors of the mean for triplicates. Data are representative of at least two independent experiments.
In contrast, ChIP experiments following drug treatment demonstrated that p130 occupancy at the promoters of the S phase and G2-M cell cycle genes was low in log-phase cells, but after serum starvation or drug treatment, levels rose dramatically (Fig. 6B). p130 recruitment was maximal 3 days following drug treatment and remained high for the entire 8-day time course, generally higher than in serum-starved cells. p130 was not present at the acetylcholine receptor promoter (Fig. 6B).
Protein levels of the third RB family member, p107, declined after drug treatment (Fig. 5). In concordance, p107 occupancy of cell cycle genes also decreased sharply 1 day or 8 days after drug treatment (Fig. 6C). p107 levels at the acetylcholine receptor promoter were low and not affected by drug treatment.
Similar data were obtained in ZR-75 cells treated with doxorubicin: RB was present at only the PCNA promoter, whereas p130 levels were elevated at each of the cell cycle promoters after 8 days of drug treatment (data not shown).
Compensation by p107 and RB for loss of p130.
Because p130 was the RB family member recruited to the promoters of cell cycle genes and likely responsible for their repression, we next used an shRNA construct stably expressed in MCF-7 to knock down p130 levels and test the response to drug treatment. p130 levels were identical in MCF-7 parental cells and MCF-7 cells expressing a control shRNA construct (NeoC) and undetectable in two independent clones of p130 knockdown cells (KD-1 and KD-2 [Fig. 7A, top; compare lanes 1 and 2 and lanes 3 and 4]). p130 levels remained undetectable in the KD cells after serum starvation or drug treatment for 3 or 5 days, day 5 being a time point when repression of cell cycle genes was maximal in parental cells (Fig. 7A, top, lanes 7 and 8, 11 and 12, and 15 and 16). Furthermore, in contrast to control cells, p130 KD cells failed to fully downregulate p107 after drug treatment (Fig. 7A, middle, compare lanes 9 and 10 and lanes 13 and 14 to lanes 11 and 12 and lanes 15 and 16). p107 levels remained considerably higher at day 3 or 5 posttreatment in the p130 KD cells (Fig. 7A). The p130 KD cells had levels and phosphorylation status of RB before and after drug treatment identical to those in MCF-7 parental or control shRNA-expressing cells (Fig. 7A, bottom). Despite the fact that p130 was the RB family member recruited to the promoters of cell cycle genes in control cells, flow cytometry analysis showed that the p130 KD cells arrested in G1 and G2-M of the cell cycle and adopted the same morphological changes as the p130-expressing control cells (data not shown). Concordantly, the p130 KD cells down-regulated cyclin A and cyclin B protein levels after drug treatment just as efficiently as the control cells (Fig. 7B). Actin levels were relatively equal in p130 KD and control cells and were unaltered by drug treatment (Fig. 7B, bottom). Similar results were observed with three additional p130 KD clones (data not shown).
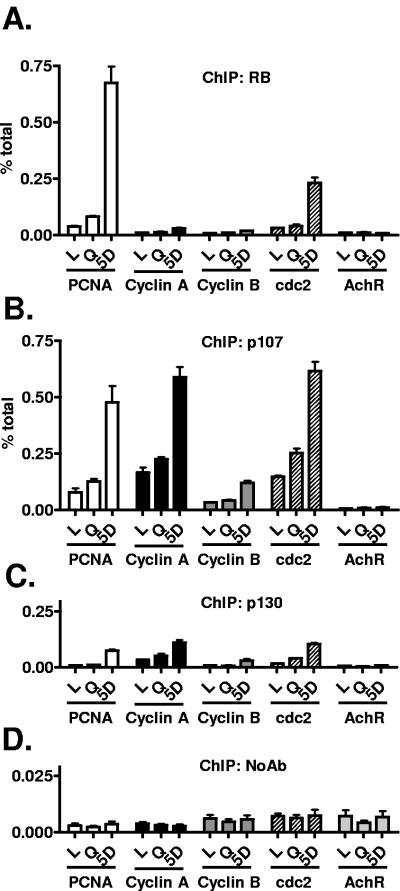
To investigate how the p130 KD cells were able to down-regulate cell cycle genes and arrest with a minimal amount of p130 available to be recruited to promoters, we performed ChIP at the cell cycle gene promoters 5 days after drug treatment, a time point when cell cycle genes were maximally repressed (Fig. 3, 4, and 7). In p130 KD cells, we found an apparent increase in recruitment of RB to only the PCNA and cdc2 promoters after drug treatment (Fig. 8A). p107, whose protein levels (Fig. 5) and recruitment to cell cycle gene promoters (Fig. 6C) had declined precipitously in drug-treated MCF-7 parental cells, now increased occupancy of each of the cell cycle gene promoters after drug treatment in the p130 KD-1 cells (Fig. 8B), clearly demonstrating compensation for the reduction of p130. As expected, p130 antibody and the no-antibody control immunoprecipitated low levels of promoter DNA in the knockdown cells (Fig. 8C and D). An identical pattern of p107 compensation was observed in the p130 KD-2 clone (data not shown).
FIG. 8.
p107 compensates for loss of p130 in MCF-7 cells. p130KD-1 cells were treated as indicated in the figure and then harvested for chromatin immunoprecipitation with (A) RB, (B) p107, (C) p130, or (D) a no-antibody control. Real-time PCR analysis was then performed using primers for the PCNA, cyclin A, cyclin B, cdc2, and AchR promoters as indicated. Data are expressed as percentages of the input, and error bars represent standard errors of the mean for triplicates. Essentially identical data were found with the KD-2 clone.
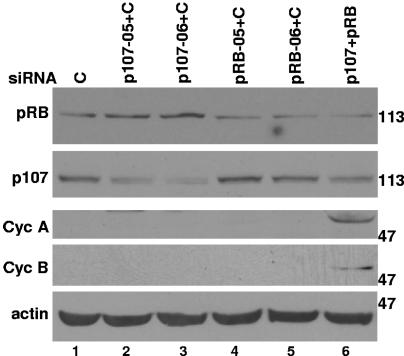
In order to determine if knockdown of p107 in combination with p130 knockdown was sufficient to allow cells to bypass arrest, we transiently transfected p130 KD-1 cells with siRNAs targeting p107 and/or RB and then treated them with doxorubicin for 5 days, a time point when parental and KD-1 cells repress cell cycle genes (Fig. 3, 4, and 7). We found that cells with double knockdown of p130 and p107 (Fig. 9, lanes 2 and 3) or p130 and RB (Fig. 9, lanes 4 and 5) efficiently downregulated the cell cycle regulatory genes cyclin A and cyclin B and assumed the SLP (Fig. 9 and data not shown). These data suggest that the presence of any one of the RB family members was sufficient for growth arrest following drug treatment. Transient knockdown of RB and p107 in the p130 KD-1 stable knockdown cells, resulting in a triple knockdown, allowed cells to bypass downregulation of cell cycle genes (Fig. 9, lane 6). The data from the p130/p107 double knockdown suggest that RB compensated for the loss of p107 and p130, although we have been unable to obtain stable p107 knockdowns or enough transient knockdown cells to perform ChIP for RB at the cell cycle gene promoters. As would be expected from our data obtained with the p130 KD-1 cells, knockdown of RB and p107 in MCF-7 cells, alone or in combination, was not sufficient to allow cells to bypass gene downregulation following drug treatment (data not shown).
FIG. 9.
Knockdown of all three RB family members is required to bypass cell cycle gene down-regulation following doxorubicin treatment. Twenty-four hours following transient transfection with control, p107, and/or RB siRNAs, p130KD-1 cells were treated with doxorubicin and then harvested 5 days later for Western blotting with RB, p107, cyclin A, cyclin B, and actin antibodies. These data are representative of two independent experiments.
DISCUSSION
Previous studies have shown that the induction of a senescence-like state in tumor cells after treatment with DNA-damaging agents occurs in vitro and in vivo, and understanding the mechanisms involved may eventually help predict response to common chemotherapy treatments (6, 30-32, 43). Here, we have begun to elucidate the mechanism of cell cycle gene repression after doxorubicin treatment that results in a permanent growth arrest and senescence-like phenotype. Interestingly, p130, but not RB or p107, appears to play a major role in the silencing of cell cycle genes in the SLP, at least when all three family members are present, as they are in MCF-7 and ZR-75 breast cancer cell lines. For extended periods of time after drug treatment (at least 8 days), p130 was bound to promoters of genes that are essential for S phase (cyclin A, PCNA) and entry into mitosis (cdc2, cyclin B). This binding was concomitant with a sharp decline in histone acetylation and gene expression as well as a prolonged arrest in both G1 and G2.
While p130 is not a classic tumor suppressor per se, p130 expression is negatively regulated in several types of cancers, including small-cell lung, endometrial, ovarian, and breast cancers and lymphoma, and mutations have been detected in nasopharyngeal carcinomas and lung cancers (reviewed in reference 28). These studies show a potential role for p130 in cancer formation and/or progression in a limited number of cancer types. Our data indicate that primarily p130, and/or p107 and RB, may also play important roles in the establishment of growth arrest and the SLP of existing cancers in response to genotoxic stress, ultimately determining the response to various treatments.
p130 has previously been implicated in acute G1 arrest in various cell model systems. p130 levels were found to be highest in quiescent cells and lowest in cycling cells of rodent or human origin (35), which we also observed (Fig. 5). This is likely due to the combination of a specific phosphorylation of p130 in G0, stabilizing it, and the lack of a separate phosphorylation event by cyclin D-cdk4/6 that occurs when cells enter the cell cycle, promoting its degradation (26, 42). Indeed, we did find differences in p130 phosphorylation status in log-phase and drug-treated or serum-starved cells. Inhibition of cdk activity by the rapid induction of p21 in the treated MCF-7 and ZR-75 cells was probably partly responsible for the increased p130 protein levels we observed (Fig. 5 and 7). The p107 promoter is positively regulated by E2F and negatively by the RB family (48); thus, p107 levels follow an opposite pattern: lowest during quiescence and highest during the cell cycle. Others have noted that RB levels remain relatively stable throughout the cell cycle (36), although in our study we observed an apparent decrease in total RB protein levels after drug treatment (Fig. 5 and 7). Takahashi et al. showed that p130 and E2F4, but, surprisingly, not RB or p107, were bound to G1-S promoters (including cyclin A and b-myb) in quiescent T98G cells, coincidental with histone deacetylation at these promoters (39). After release from quiescence, p130 rapidly diminished at these promoters by late G1, coincident with histone acetylation and increased gene transcription (39).
Previous studies have indicated a role for the RB family in acute G1 arrest following DNA damage, and this arrest was p53 dependent (5, 19, 23, 34). The question of which RB family members are responsible for the arrest has been addressed by several different techniques and in several different model systems. In one study of cellular senescence induced by oncogenic Ras in normal human fibroblasts, RB, but not p107 or p130, was shown to increase occupancy at the cyclin A and PCNA promoters (27). Other studies, using mouse embryo fibroblasts (MEFs), have also suggested that RB is the mediator of cell cycle arrest (5, 19, 23, 34). RB-null MEFs failed to arrest following exposure to genotoxic stress, while p107-null, p130-null, or p107/p130 double-null MEFs arrested in G1 similar to wild-type cells (19), although, at least in one study, the RB knockout MEFs did retain some ability to arrest, possibly due to p107 or p130 (34).
In the breast cancer cells used in our study, we found p130 to be the predominant RB family member recruited to promoters of S-phase genes following exposure to doxorubicin and, based on its well-described promoter regulatory functions, to be the likely mediator of gene down-regulation and arrest. We found that RB, in addition to high levels of p130, bound to only the PCNA promoter and none of the other cell cycle genes (Fig. 6A). Further, when p130 levels were diminished by shRNA targeting in MCF-7, p107 had the primary compensatory role at the promoters, not RB. The apparent differences observed in our study of breast cancer cells exposed to DNA damage and MEFs indicate the need to consider cell type specificities when interpreting data for RB family members, particularly in response to genotoxic stress. Differences in the experimental approaches in our study and the studies using MEFs also make direct comparisons difficult.
Our findings also implicate p130 as the primary RB family member regulating G2-M regulatory genes after genotoxic stress. Others have shown that G2 arrest is dependent on RB family members, although there is a paucity of data addressing which individual members are involved. Studies using MEFs have suggested that G2 arrest and cdc2 down-regulation are mediated by all three RB family members in somewhat overlapping roles (21, 41), although these studies showed a larger primary role for RB in G2 arrest than was suggested by our data in breast cancer cells (21, 41). We found the presence of any one of the RB family members was sufficient to allow cells to arrest following drug treatment.
In human cell lines, the G2 arrest observed has also been shown to be p53 dependent (13, 37). Linking the RB family to the arrest, RKO cells or normal human fibroblasts with inactivation of the RB family using human papilloma virus E7 protein failed to down-regulate G2-M regulators after genotoxic stress, in contrast to control cells (1, 13). Neither study addressed the contribution of individual RB family members, or what factors were bound in vivo at cell cycle promoters. Our study would suggest that E7-mediated inactivation of all three was required.
p130 was implicated as a possible player in G2-M arrest when it was shown that p130 from quiescent fibroblasts or in p53-null cells with ectopic p53 induction (ostensibly mimicking a genotoxic stress response) could bind cdc2 promoter oligonucleotides in in vitro electrophoretic mobility shift assays (44). We show here that p130 bound in vivo to the cdc2 promoter after drug treatment in MCF-7 and ZR-75 cells, as well as to promoters of genes that regulate S phase, and this occupancy was maintained over an extended period of time as cells underwent morphological and gene expression changes associated with permanent arrest.
Surprisingly, MCF-7 cells retained the ability to undergo arrest and induction of the SLP in response to DNA damage with very little or absent p130. Cell cycle genes were repressed, and cell cycle distribution and morphology of the knockdown cells were identical to those of control cells, as p107 now occupied the promoters of cell cycle genes. Further, cells actually required the knockdown of all three RB family members simultaneously in order to bypass cell cycle gene repression following drug treatment. It is interesting that the arrest/senescence program in MCF-7 cells has multiple backup mechanisms present. This would suggest that more than one, and more likely three, genetic or epigenetic event resulting in reduced/inactivated protein would be required within the RB family in order to bypass the arrest response to DNA damage.
Also of note, p107 levels were much lower in drug-treated p130 KD cells (and MCF-7 parental cells) than in serum-starved cells (Fig. 5 and 7A); however, p107 recruitment to promoters (Fig. 8B) and gene repression (Fig. 7B) were much greater in the drug-treated cells. One possible explanation for this is that posttranslational modifications of p107 that we were unable to detect by normal gel electrophoresis exist in drug-treated cells but not serum-starved cells, resulting in a conversion of latent p107 to an active form. Alternatively, or in addition to this possibility, p107 might associate with and recruit different gene-repressive cofactors in the drug-treated cells. Indeed, one group has found that RB mediates different modifications of chromatin in senescent versus quiescent cells (27).
In summary, we have identified p130 as the RB family member recruited to the promoters of S phase and G2-M regulatory genes that are down-regulated during the induction of the senescence-like phenotype in doxorubicin-treated breast cancer cells. Further, we have demonstrated mechanistically how these cells can compensate for loss of p130 via other RB family members. Gathering evidence suggests that growth arrest and cellular senescence is an important outcome in cancer treatment; thus, understanding the roles of individual RB family members in mediating the arrest will prove critical to predicting drug response.
Acknowledgments
We acknowledge Johanna Echigo for assistance in screening p130 knockdown clones, Stefan Taubert and the Bruno Amati lab for technical advice and correspondence on the chromatin immunoprecipitations, Charles Thomas of the UTHSCSA/SACI FACS core facility for help with flow cytometry studies, James R. Smith for helpful scientific discussions, and Sandra N. Garcia for critical reading of the manuscript.
This work was supported by a grant from the Department of Defense Breast Cancer Research Program (DAMD17-03-1-0324) (J.G.J.) and NIA PO1AG2752 and the Ellison Medical Foundation (O.M.P.-S.).
REFERENCES
- 1.Baus, F., V. Gire, D. Fisher, J. Piette, and V. Dulic. 2003. Permanent cell cycle exit in G2 phase after DNA damage in normal human fibroblasts. EMBO J. 22:3992-4002. [DOI] [PMC free article] [PubMed] [Google Scholar]
- 2.Berns, A. 2002. Senescence: a companion in chemotherapy? Cancer Cell 1:309-311. [DOI] [PubMed] [Google Scholar]
- 3.Blais, A., and B. D. Dynlacht. 2004. Hitting their targets: an emerging picture of E2F and cell cycle control. Curr. Opin. Genet. Dev. 14:527-532. [DOI] [PubMed] [Google Scholar]
- 4.Bringold, F., and M. Serrano. 2000. Tumor suppressors and oncogenes in cellular senescence. Exp. Gerontol. 35:317-329. [DOI] [PubMed] [Google Scholar]
- 5.Brugarolas, J., K. Moberg, S. D. Boyd, Y. Taya, T. Jacks, and J. A. Lees. 1999. Inhibition of cyclin-dependent kinase 2 by p21 is necessary for retinoblastoma protein-mediated G1 arrest after gamma-irradiation. Proc. Natl. Acad. Sci. USA 96:1002-1007. [DOI] [PMC free article] [PubMed] [Google Scholar]
- 6.Chang, B. D., E. V. Broude, M. Dokmanovic, H. Zhu, A. Ruth, Y. Xuan, E. S. Kandel, E. Lausch, K. Christov, and I. B. Roninson. 1999. A senescence-like phenotype distinguishes tumor cells that undergo terminal proliferation arrest after exposure to anticancer agents. Cancer Res. 59:3761-3767. [PubMed] [Google Scholar]
- 7.Chang, B. D., Y. Xuan, E. V. Broude, H. Zhu, B. Schott, J. Fang, and I. B. Roninson. 1999. Role of p53 and p21waf1/cip1 in senescence-like terminal proliferation arrest induced in human tumor cells by chemotherapeutic drugs. Oncogene 18:4808-4818. [DOI] [PubMed] [Google Scholar]
- 8.Dalton, S. 1992. Cell cycle regulation of the human cdc2 gene. EMBO J. 11:1797-1804. [DOI] [PMC free article] [PubMed] [Google Scholar]
- 9.Elmore, L. W., C. W. Rehder, X. Di, P. A. McChesney, C. K. Jackson-Cook, D. A. Gewirtz, and S. E. Holt. 2002. Adriamycin-induced senescence in breast tumor cells involves functional p53 and telomere dysfunction. J. Biol. Chem. 277:35509-35515. [DOI] [PubMed] [Google Scholar]
- 10.Erdmann, J. 2005. Cancer's big sleep: senescence may be potential target for cancer therapies. J. Natl. Cancer Inst. 97:89-91. [DOI] [PubMed] [Google Scholar]
- 11.Eward, K. L., M. N. Van Ert, M. Thornton, and C. E. Helmstetter. 2004. Cyclin mRNA stability does not vary during the cell cycle. Cell Cycle 3:1057-1061. [PubMed] [Google Scholar]
- 12.Ferreira, R., I. Naguibneva, L. L. Pritchard, S. Ait-Si-Ali, and A. Harel-Bellan. 2001. The Rb/chromatin connection and epigenetic control: opinion. Oncogene 20:3128-3133. [DOI] [PubMed] [Google Scholar]
- 13.Flatt, P. M., L. J. Tang, C. D. Scatena, S. T. Szak, and J. A. Pietenpol. 2000. p53 regulation of G2 checkpoint is retinoblastoma protein dependent. Mol. Cell. Biol. 20:4210-4223. [DOI] [PMC free article] [PubMed] [Google Scholar]
- 14.Frank, S. R., M. Schroeder, P. Fernandez, S. Taubert, and B. Amati. 2001. Binding of c-Myc to chromatin mediates mitogen-induced acetylation of histone H4 and gene activation. Genes Dev. 15:2069-2082. [DOI] [PMC free article] [PubMed] [Google Scholar]
- 15.Frolov, M. V., and N. J. Dyson. 2004. Molecular mechanisms of E2F-dependent activation and pRB-mediated repression. J. Cell Sci. 117:2173-2181. [DOI] [PubMed] [Google Scholar]
- 16.Grill, C., F. Gheyas, P. Dayananth, W. Jin, W. Ding, P. Qiu, L. Wang, R. J. Doll, and J. M. English. 2004. Analysis of the ERK1,2 transcriptome in mammary epithelial cells. Biochem. J. 381:635-644. [DOI] [PMC free article] [PubMed] [Google Scholar]
- 17.Han, Z., W. Wei, S. Dunaway, J. W. Darnowski, P. Calabresi, J. Sedivy, E. A. Hendrickson, K. V. Balan, P. Pantazis, and J. H. Wyche. 2002. Role of p21 in apoptosis and senescence of human colon cancer cells treated with camptothecin. J. Biol. Chem. 277:17154-17160. [DOI] [PubMed] [Google Scholar]
- 18.Harbour, J. W., and D. C. Dean. 2000. The Rb/E2F pathway: expanding roles and emerging paradigms. Genes Dev. 14:2393-2409. [DOI] [PubMed] [Google Scholar]
- 19.Harrington, E. A., J. L. Bruce, E. Harlow, and N. Dyson. 1998. pRB plays an essential role in cell cycle arrest induced by DNA damage. Proc. Natl. Acad. Sci. USA 95:11945-11950. [DOI] [PMC free article] [PubMed] [Google Scholar]
- 20.Jackson, J. G., P. St Clair, M. X. Sliwkowski, and M. G. Brattain. 2004. Blockade of epidermal growth factor- or heregulin-dependent ErbB2 activation with the anti-ErbB2 monoclonal antibody 2C4 has divergent downstream signaling and growth effects. Cancer Res. 64:2601-2609. [DOI] [PubMed] [Google Scholar]
- 21.Jackson, M. W., M. K. Agarwal, J. Yang, P. Bruss, T. Uchiumi, M. L. Agarwal, G. R. Stark, and W. R. Taylor. 2005. p130/p107/p105Rb-dependent transcriptional repression during DNA-damage-induced cell-cycle exit at G2. J. Cell Sci. 118:1821-1832. [DOI] [PubMed] [Google Scholar]
- 22.Kaeser, M. D., and R. D. Iggo. 2002. Chromatin immunoprecipitation analysis fails to support the latency model for regulation of p53 DNA binding activity in vivo. Proc. Natl. Acad. Sci. USA 99:95-100. [DOI] [PMC free article] [PubMed] [Google Scholar]
- 23.Knudsen, K. E., D. Booth, S. Naderi, Z. Sever-Chroneos, A. F. Fribourg, I. C. Hunton, J. R. Feramisco, J. Y. Wang, and E. S. Knudsen. 2000. RB-dependent S-phase response to DNA damage. Mol. Cell. Biol. 20:7751-7763. [DOI] [PMC free article] [PubMed] [Google Scholar]
- 24.Knudsen, K. E., A. F. Fribourg, M. W. Strobeck, J. M. Blanchard, and E. S. Knudsen. 1999. Cyclin A is a functional target of retinoblastoma tumor suppressor protein-mediated cell cycle arrest. J. Biol. Chem. 274:27632-27641. [DOI] [PubMed] [Google Scholar]
- 25.Lee, E. Y., H. To, J. Y. Shew, R. Bookstein, P. Scully, and W. H. Lee. 1988. Inactivation of the retinoblastoma susceptibility gene in human breast cancers. Science 241:218-221. [DOI] [PubMed] [Google Scholar]
- 26.Litovchick, L., A. Chestukhin, and J. A. DeCaprio. 2004. Glycogen synthase kinase 3 phosphorylates RBL2/p130 during quiescence. Mol. Cell. Biol. 24:8970-8980. [DOI] [PMC free article] [PubMed] [Google Scholar]
- 27.Narita, M., S. Nunez, E. Heard, A. W. Lin, S. A. Hearn, D. L. Spector, G. J. Hannon, and S. W. Lowe. 2003. Rb-mediated heterochromatin formation and silencing of E2F target genes during cellular senescence. Cell 113:703-716. [DOI] [PubMed] [Google Scholar]
- 28.Paggi, M. G., and A. Giordano. 2001. Who is the boss in the retinoblastoma family? The point of view of Rb2/p130, the little brother. Cancer Res. 61:4651-4654. [PubMed] [Google Scholar]
- 29.Pfaffl, M. W. 2001. A new mathematical model for relative quantification in real-time RT-PCR. Nucleic Acids Res. 29:e45. [DOI] [PMC free article] [PubMed] [Google Scholar]
- 30.Roberson, R. S., S. J. Kussick, E. Vallieres, S. Y. Chen, and D. Y. Wu. 2005. Escape from therapy-induced accelerated cellular senescence in p53-null lung cancer cells and in human lung cancers. Cancer Res. 65:2795-2803. [DOI] [PubMed] [Google Scholar]
- 31.Roninson, I. B. 2002. Tumor senescence as a determinant of drug response in vivo. Drug Resist. Update 5:204-208. [DOI] [PubMed] [Google Scholar]
- 32.Schmitt, C. A., J. S. Fridman, M. Yang, S. Lee, E. Baranov, R. M. Hoffman, and S. W. Lowe. 2002. A senescence program controlled by p53 and p16INK4a contributes to the outcome of cancer therapy. Cell 109:335-346. [DOI] [PubMed] [Google Scholar]
- 33.Shay, J. W., and I. B. Roninson. 2004. Hallmarks of senescence in carcinogenesis and cancer therapy. Oncogene 23:2919-2933. [DOI] [PubMed] [Google Scholar]
- 34.Slebos, R. J., M. H. Lee, B. S. Plunkett, T. D. Kessis, B. O. Williams, T. Jacks, L. Hedrick, M. B. Kastan, and K. R. Cho. 1994. p53-dependent G1 arrest involves pRB-related proteins and is disrupted by the human papillomavirus 16 E7 oncoprotein. Proc. Natl. Acad. Sci. USA 91:5320-5324. [DOI] [PMC free article] [PubMed] [Google Scholar]
- 35.Smith, E. J., G. Leone, J. DeGregori, L. Jakoi, and J. R. Nevins. 1996. The accumulation of an E2F-p130 transcriptional repressor distinguishes a G0 cell state from a G1 cell state. Mol. Cell. Biol. 16:6965-6976. [DOI] [PMC free article] [PubMed] [Google Scholar]
- 36.Smith, E. J., G. Leone, and J. R. Nevins. 1998. Distinct mechanisms control the accumulation of the Rb-related p107 and p130 proteins during cell growth. Cell Growth Differ. 9:297-303. [PubMed] [Google Scholar]
- 37.Stark, G. R., and W. R. Taylor. 2004. Analyzing the G2/M checkpoint. Methods Mol. Biol. 280:51-82. [DOI] [PubMed] [Google Scholar]
- 38.Stein, G. H., M. Beeson, and L. Gordon. 1990. Failure to phosphorylate the retinoblastoma gene product in senescent human fibroblasts. Science 249:666-669. [DOI] [PubMed] [Google Scholar]
- 39.Takahashi, Y., J. B. Rayman, and B. D. Dynlacht. 2000. Analysis of promoter binding by the E2F and pRB families in vivo: distinct E2F proteins mediate activation and repression. Genes Dev. 14:804-816. [PMC free article] [PubMed] [Google Scholar]
- 40.Taubert, S., C. Gorrini, S. R. Frank, T. Parisi, M. Fuchs, H. M. Chan, D. M. Livingston, and B. Amati. 2004. E2F-dependent histone acetylation and recruitment of the Tip60 acetyltransferase complex to chromatin in late G1. Mol. Cell. Biol. 24:4546-4556. [DOI] [PMC free article] [PubMed] [Google Scholar]
- 41.Taylor, W. R., A. H. Schonthal, J. Galante, and G. R. Stark. 2001. p130/E2F4 binds to and represses the cdc2 promoter in response to p53. J. Biol. Chem. 276:1998-2006. [DOI] [PubMed] [Google Scholar]
- 42.Tedesco, D., J. Lukas, and S. I. Reed. 2002. The pRb-related protein p130 is regulated by phosphorylation-dependent proteolysis via the protein-ubiquitin ligase SCF(Skp2). Genes Dev. 16:2946-2957. [DOI] [PMC free article] [PubMed] [Google Scholar]
- 43.te Poele, R. H., A. L. Okorokov, L. Jardine, J. Cummings, and S. P. Joel. 2002. DNA damage is able to induce senescence in tumor cells in vitro and in vivo. Cancer Res. 62:1876-1883. [PubMed] [Google Scholar]
- 44.Tommasi, S., and G. P. Pfeifer. 1995. In vivo structure of the human cdc2 promoter: release of a p130-E2F-4 complex from sequences immediately upstream of the transcription initiation site coincides with induction of cdc2 expression. Mol. Cell. Biol. 15:6901-6913. [DOI] [PMC free article] [PubMed] [Google Scholar]
- 45.Wang, L., Q. Wu, P. Qiu, A. Mirza, M. McGuirk, P. Kirschmeier, J. R. Greene, Y. Wang, C. B. Pickett, and S. Liu. 2001. Analyses of p53 target genes in the human genome by bioinformatic and microarray approaches. J. Biol. Chem. 276:43604-43610. [DOI] [PubMed] [Google Scholar]
- 46.Wosikowski, K., J. T. Regis, R. W. Robey, M. Alvarez, J. T. Buters, J. M. Gudas, and S. E. Bates. 1995. Normal p53 status and function despite the development of drug resistance in human breast cancer cells. Cell Growth Differ. 6:1395-1403. [PubMed] [Google Scholar]
- 47.Zhang, H. S., and D. C. Dean. 2001. Rb-mediated chromatin structure regulation and transcriptional repression. Oncogene 20:3134-3138. [DOI] [PubMed] [Google Scholar]
- 48.Zhu, L., E. Xie, and L. S. Chang. 1995. Differential roles of two tandem E2F sites in repression of the human p107 promoter by retinoblastoma and p107 proteins. Mol. Cell. Biol. 15:3552-3562. [DOI] [PMC free article] [PubMed] [Google Scholar]


