

Abstract
Objective
To provide detailed methodological guidelines for using the Drug Abuse Treatment Cost Analysis Program (DATCAP) and Addiction Severity Index (ASI) in a benefit-cost analysis of addiction treatment.
Data Sources/Study Setting
A representative benefit-cost analysis of three outpatient programs was conducted to demonstrate the feasibility and value of the methodological guidelines.
Study Design
Procedures are outlined for using resource use and cost data collected with the DATCAP. Techniques are described for converting outcome measures from the ASI to economic (dollar) benefits of treatment. Finally, principles are advanced for conducting a benefit-cost analysis and a sensitivity analysis of the estimates.
Data Collection/Extraction Methods
The DATCAP was administered at three outpatient drug-free programs in Philadelphia, PA, for 2 consecutive fiscal years (1996 and 1997). The ASI was administered to a sample of 178 treatment clients at treatment entry and at 7-months postadmission.
Principal Findings
The DATCAP and ASI appear to have significant potential for contributing to an economic evaluation of addiction treatment. The benefit-cost analysis and subsequent sensitivity analysis all showed that total economic benefit was greater than total economic cost at the three outpatient programs, but this representative application is meant to stimulate future economic research rather than justifying treatment per se.
Conclusions
This study used previously validated, research-proven instruments and methods to perform a practical benefit-cost analysis of real-world treatment programs. The study demonstrates one way to combine economic and clinical data and offers a methodological foundation for future economic evaluations of addiction treatment.
Keywords: Benefit-cost analysis, addiction treatment, DATCAP, ASI
Although government policy agencies, insurance companies, managed care organizations, and the public at large are concerned about the costs and benefits of health care interventions in general, particular concern exists regarding the funding of substance abuse treatment interventions. First, substance abuse is not universally recognized as a disease or a health problem (McLellan et al. 2000). Second, substance abuse treatment remains heavily subsidized, while the social and health benefits of substance abuse treatments are not well understood (French 2000). Third, the majority of substance abuse treatment is financed with public funds and is therefore subject to frequent scrutiny and debate. For all of these reasons, a great need exists for scientifically sound, but practical economic evaluations of contemporary substance abuse treatments.
To reinforce standardized methods and promote consistency across studies, health economists have published several books and scientific articles on proper techniques for economic evaluation of health care programs (e.g., Drummond et al. 1997; Hargreaves et al. 1998; Johannesson 1996; Kenkel 1997; Sloan 1996; Tolley, Kenkel, and Fabian 1994). Most significant, the U.S. Public Health Service recently commissioned an expert panel to reach consensus on appropriate methods for conducting cost-effectiveness analyses of health care programs. The result of this project was a comprehensive book (Gold et al. 1996) that serves as a valuable reference document for researchers and policymakers.
Despite considerable methodological and empirical developments in economic evaluation studies of primary health care programs, economic techniques have rarely been adapted to studies of addiction treatment. Advances in economic analyses of addiction treatment have lagged behind other areas of health care partly because of the variety of substance abuse treatment approaches and the complexity and multiplicity of treatment outcomes so often demanded of addiction treatments (e.g., improvements in drug use, crime, employment, health). Consequently, methodological guidelines for substance abuse researchers are scarce (Cartwright 1998; French 1995, 2000; Zarkin et al. 1994), and some of the existing empirical studies do not conform to accepted principles and techniques of economic evaluation (Drummond et al. 1997). Thus, policymakers, treatment managers, and treatment evaluators could benefit from a clearly articulated methodological framework for conducting economic evaluations of contemporary substance abuse treatments.
This article addresses methodological and empirical gaps in the economic evaluation literature by developing systematic research guidelines and by then applying these guidelines to estimate the costs and economic benefits of addiction treatment at three outpatient drug-free programs in Philadelphia. To enhance feasibility and adaptability, the proposed estimation techniques use data that are collected through two broadly accessible data collection instruments: the Drug Abuse Treatment Cost Analysis Program (DATCAP) and the Addiction Severity Index (ASI). These instruments are the most frequently used cost and clinical instruments among addiction researchers. Each has proven reliable and valid in numerous treatment and research settings (French, Dunlap, Zarkin, et al. 1997; Salomé and French, 2001; McLellan et al. 1980; McLellan, Kushner, Metzger, et al. 1992). In addition, the approach suggested here is clinically and administratively practical within contemporary substance abuse treatment settings. For example, the ASI is widely used by treatment programs across the country for admission assessments and for posttreatment clinical evaluations of improvement and outcome. Similarly, the DATCAP has been used in a variety of real-world treatment settings for economic evaluations.
Overview of Economic Evaluation Methods and Applications
Several established economic evaluation methods and techniques have been used primarily by health economists to evaluate health care programs, services, or interventions. The first technique, and one that is incorporated into all others, is economic cost analysis. Economic cost analysis estimates the opportunity cost of a program from a societal perspective. Opportunity cost refers to the market value (i.e., the value of the next best alternative application) of all resources used in the delivery of a program (Drummond et al. 1997). A societal perspective implies that opportunity costs are included for all participants or stakeholders in the program (without double counting), such as organizations, patients, taxpayers, and insurance companies (Sindelar and Manning 1997). For program evaluation, the societal perspective is advocated over a private perspective (e.g., insurance company) because the former is neutral across stakeholders and more comparable across programs (Gold et al. 1996).
When two or more programs generate the same outcome, cost-minimization analysis can be used to guide resource allocation decisions. By estimating and comparing the costs of alternative programs, the analyst can identify which program costs least to achieve a given outcome. Cost minimization is a handy technique, but it is rarely used to evaluate addiction treatment because most services involve multiple outcomes with varying levels of success.
Although cost-effectiveness analysis is the most popular economic evaluation method employed in health care research, it is also often misunderstood. Simply stated, cost-effectiveness analysis compares ratios of incremental (opportunity) cost and incremental outcome of two or more alternative programs when outcomes are measured along a single scale. Incremental analysis relates to the additional cost or outcome that would arise if a program were implemented. For example, the incremental cost of an enhanced services intervention is the cost of adding this component to standard or baseline services, not the combined cost of standard plus enhanced services. This technique is usually not intended for evaluating a single program or multiple types of outcomes. This limitation is problematic when evaluating substance abuse treatment as multiple outcomes (e.g., employment, crime, drug use, health) are routinely expected (Institute of Medicine, 1990; Lamb, Greenlick, and McCarty 1998; McLellan, Woody, Metzger, et al. 1996).
The most powerful economic evaluation method is benefit-cost analysis (Cartwright 1998; French 1995, 2000; Kenkel 1997). This technique compares the opportunity cost of a program to its economic benefit (measured in monetary terms, such as dollars). Results are expressed as a benefit-cost ratio or net benefit estimate (benefit minus cost), and an intervention is usually cost beneficial if the benefit-cost ratio exceeds unity or if the net benefit estimate is positive. However, even if the benefit-cost test implies that intervention benefits exceed intervention costs, one cannot conclude that an efficient use of scarce resources is taking place without similar information from alternative uses of the same resources.
The health care evaluation literature sometimes refers to two other types of economic evaluation methods. Cost-utility analysis compares the incremental cost and the incremental change in utility (e.g., quality of life) of two or more programs, with results mostly expressed in terms of cost per quality-adjusted life-year. The quality-adjusted life-year represents a common health output measure that captures both reduced morbidity and mortality (Drummond et al. 1997). Quality adjustment factors, used to determine quality-adjusted life-years, are weights usually ranging from 0 to 1 and are representing various health conditions. Cost-utility analysis is becoming increasingly popular for evaluating pharmaceutical products (Drummond et al. 1997) but is rarely used in addiction treatment evaluations (Barnett 1999). Alternatively, cost-offset analysis is often referred to in the addiction treatment literature as a distinct method of economic evaluation (Holder 1987; Holder et al. 1991). In reality, cost-offset analysis is a partial benefit-cost analysis because it compares the cost of a program with the dollar value of a single outcome (i.e., avoided future health care costs). Because it is a partial analysis, this technique may not be suitable for guiding policy decisions.
Unlike the abundant literature with a psychological or clinical scope, few studies have performed economic analysis to determine the cost, cost-effectiveness, or net benefit of addiction treatment (e.g., Anderson et al. 1998; French and McGeary 1997; Goodman, Nishiura, Hankin, et al. 1996; Harwood et al. 1995; Plotnick 1994; Rajkumar and French 1997; Barnet et al. 2001; Zarkin et al. 2001). This economic study, to our knowledge, is one of the first within the addiction treatment field to include a comprehensive spectrum of treatment outcomes similar to the range typically requested by state and other government agencies (Institute of Medicine, 1990; Lamb, Greenlick, and McCarty 1998). This research is also one of the first studies to employ the DATCAP and ASI in a representative benefit-cost analysis of addiction treatment and, subsequently, to test the usefulness of these instruments in an economic application (French et al. 2000, in press a, in press b).
Proposed Benefit-Cost Guidelines
Economic Costs of Treatment Services
Resource use and cost information at participating programs can be obtained by administering the DATCAP (French 2001a, 2001b, www.DATCAP.com). The DATCAP is an onsite data-collection instrument that estimates the economic costs of treatment services. The instrument is structured along standard resource categories, including personnel, supplies and materials, contracted services, buildings and facilities, equipment, and miscellaneous items. The essence of the DATCAP is the concept of economic, or opportunity cost, which denotes the payment required to keep the resource in its present use or, alternatively, the amount the resource would be worth in its next best application. Accounting cost, on the other hand, is based on actual expenditures and standard depreciation schedules and may be less representative of the “replacement cost” of treatment resources. The DATCAP allows estimation of total annual economic and accounting costs per individual cost category as well as for the program as a whole. Similarly, average cost estimates can be calculated by dividing total program cost by the average program capacity, or static caseload. DATCAP also allows computation of the average cost of a treatment episode, permitting cost comparisons across programs. A detailed explanation of the DATCAP method as well as a summary of some of its empirical findings can be found in French, Dunlap, Galinis, et al. (1996), French, Dunlap, Zarkin, et al. (1997), French and McGeary (1997), and Salomé and French (2001), as well as at www.DATCAP.com.
Economic Benefits of Treatment Services
Economic (dollar) benefits can be derived from patient self-reported information collected at treatment entry and postadmission using the ASI (McLellan, Kushner, Metzger, et al. 1992; McLellan et al. 1980). The ASI is a 45- to 60-minute structured clinical interview developed to diagnose and evaluate lifetime as well as recent (past 30 days) severity of addiction-related problems in the following areas: medical status, employment, alcohol and drug use, legal status, family and social relationships, and psychiatric symptoms. The admission version of the ASI covers both the past 30 days and lifetime experiences. The follow-up version is usually readministered 6 months following treatment discharge, measuring the same variables for either the entire 6-month period or the most recent 30 days. Most clinical evaluations employing the ASI compare mean values on important variables (e.g., days of drug use, employment, crime) during the 30-day period preceding the admission and the follow-up interviews (see McLellan, Hagan, Levine, et al. 1998; McLellan, Kushner, Metzger, et al. 1992). The differences in mean values between admission and follow-up for selected ASI variables can be translated into a corresponding dollar equivalent to allow comparison with cost data. In the discussion that follows, estimation techniques are described for translating various ASI measures into economic (dollar) benefits of addiction treatment. The monetary conversion factors (i.e., unit cost estimates) cited later pertain to the Philadelphia Target Cities evaluation. Future applications of this method will obviously need to be extended to obtain monetary conversion factors that apply directly to the specific sample(s) being evaluated and the location(s) of the intervention.
Because the ASI is primarily administered for clinical purposes, most of the measures cannot be used in a benefit-cost analysis. Lifetime severity measures relating to the behavior of the subject leading up to admission (e.g., number of lifetime arrests) as well as measures collected only at baseline cannot be compared with a follow-up measure. Other variables cannot be associated with a monetary equivalent due either to the unavailability of reasonable estimates (e.g., family conflicts) or because of monetary irrelevance (e.g., client demographics).
The proposed methodological guidelines recommend including the following ASI variables in a benefits analysis: number of days in a medical hospital, number of days in a psychiatric hospital, number of days in a residential or hospital substance abuse treatment program, number of days experiencing medical problems, income received from employment, money spent on alcohol, money spent on drugs, number of days engaged in illegal activities, and number of days experiencing psychiatric problems. For each selected ASI variable, the statistical significance of the mean change from baseline to follow-up should be determined by performing a Wilcoxon matched-pairs signed-rank test (Siegel and Castellan 1988). The difference in mean values (30 days) between admission and follow-up for each variable can then be multiplied by a monetary conversion factor (i.e., unit cost estimate) to obtain the average posttreatment benefit. This average posttreatment benefit, measuring past 30-day experience, should then be extrapolated to cover the full follow-up period (in the Application that follows, the follow-up period was 7 months).
The ASI variable “number of days in a controlled environment” includes three settings that are important for the benefits analysis: inpatient medical hospital, inpatient psychiatric hospital, and residential addiction treatment. The cost of a day of inpatient medical care ($1,029.77 [1996 dollars]) was set equal to the average daily expenses for metropolitan community hospitals in Pennsylvania (American Hospital Association 2000). The cost of one inpatient psychiatric care day ($193.69 [1996 dollars]) was obtained by taking the sum of the average fee for evaluation and management services provided to a patient in a psychiatric residential treatment center and the average fee for individual psychotherapy for the State of Pennsylvania (American Medical Association 1999). Finally, the average cost of one day in residential addiction treatment ($90.69 [1996 dollars]) was calculated from published and unpublished data on all residential treatment programs that completed the DATCAP. Again, future analyses should obtain unit cost estimates that are representative and appropriate for the population being analyzed.
The cost of a day experiencing medical problems was estimated through the following formula (French et al. 1996):
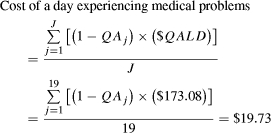 |
The quality adjustment factors (QA j) in equation 1 correspond to a set of 19 medical conditions that are prevalent among drug abusers, such as acute hepatitis B, HIV/AIDS, hypertension, bacterial pneumonia, sexually transmitted diseases (e.g., chlamydia, syphilis, and gonorrhea), and tuberculosis. The dollar value of a quality-adjusted life-day ($173.08) was based on a $1-million valueş of life estimate (Viscusi 1993) for a 38-year-old White male with an average life expectancy (5 percent discount rate) (Appendix Table A-1, available on request, provides further details).
The ASI variable “income received from employment” is already expressed in dollars. Money spent on alcohol and illicit drugs reflects the value of changes in the consumption of these substances. It can be argued, however, that benefits of reduced consumption have moral rather than economic implications. Moreover, consumption of illicit substances may generate social welfare by supporting a parallel economy. On the other hand, substance use may lead to negative externalities, such as violent behavior and crime. It is certainly difficult to value precisely the loss to society caused by the consumption of substances, and the proposed method suggests money spent on alcohol and drugs as a proxy.
The ASI also collects information on the number of days engaged in illegal activities (excluding drug use or possession), which can be used to estimate the reduction in crime-related costs. According to a recent study, crime-related costs account for nearly one third of the total cost of substance abuse (Harwood, Fountain, and Livermore 1998). Estimates of the cost of various criminal acts associated with substance abuse were obtained from Rajkumar and French (1997). The weighted average cost of an “undefined” crime for drug abusers, where the weights are the relative probabilities of committing each type of act, was estimated at $687.45 (Appendix Table A-2, available on request, provides further details).
To apply the cost of an undefined crime to the number of days engaged in illegal activities, an assumption had to be made about the number of crimes an average subject would commit during 1 day of illegal activity. Although some studies report up to five addiction-related crimes per day for an active drug abuser (see Ball and Ross 1991), a safe and conservative assumption for this study seemed to limit the number of acts to one per day. The sensitivity analysis that follows sets the lower bound value to one act for every 2 days of reported illegal activity (i.e., including 1 day of planning or prospecting for each completed illegal act). Finally, the cost of a day experiencing psychiatric problems was estimated through equation 1 in a similar way as a day experiencing medical problems. Applying the value of a quality-adjusted life-day ($173.08) and assuming that the individual ordinarily is in good health prior to experiencing psychiatric problems, the cost associated with a day experiencing psychiatric problems amounted to $7.62.
Benefit-Cost Analysis of Treatment Services
The proposed benefit-cost analysis weighs the costs of resources allocated to treatment, as estimated through the DATCAP, against the benefits yielded through treatment, obtained by monetizing selected ASI outcome variables. All data used for the analysis were converted into constant dollars to adjust for inflation (Bureau of Labor Statistics 1999). For the benefit-cost ratio and the net benefit estimates, 95 percent confidence intervals were derived using bootstrap estimates (1,000 repetitions) with the bias-corrected approximation method (StataCorp 1999).
Conducting a Sensitivity Analysis
Performing a sensitivity analysis is a critical component of an economic evaluation when the assumptions and parameter estimates applied in the analysis have uncertain precision. As discussed earlier, two or more approaches were sometimes available to monetize certain variables. Other outcome variables could arguably be dropped from the benefits estimation.
A sensitivity analysis can be conducted and reported in a variety of ways (Drummond et al. 1997; Gold et al. 1996). Two approaches were employed in the proposed economic evaluation strategy. The first approach derived 95 percent confidence intervals using bootstrap estimates (1,000 repetitions) with the bias-corrected approximation method (StataCorp 1999) to develop a statistical range for the benefit estimates and the benefit-cost statistics. The second approach calculated a lower and upper bound estimate, whenever relevant, for the outcome variables used in the benefit calculations. Similarly, lower and upper bound estimates were calculated for total benefit. The lower and upper bound estimates formed confidence intervals for the midrange (i.e., suggested) values. Furthermore, the three total benefit estimates (lower, mid, upper) were used in sensitivity calculations of the benefit-cost statistics and are demonstrated in the empirical application that follows.
Methodological Limitations
Several limitations are inherent to the proposed guidelines. First, outcome data from the ASI are derived from patient self-reported information, which may be less dependable than sources such as administrative records or physical specimens. However, several studies found self-reported data to be quite accurate in drug abuse treatment settings (Rouse, Kozel, and Richards 1985; Turner, Lessler, and Devore 1992).
Second, most ASI measures pertain to behaviors and events during the previous 30 days. The practice of multiplying the benefits accrued during a 30-day period by 7 to estimate treatment benefits for the full 7-month follow-up period in this study implies that progress is uniform across all 7 months, a scenario that is rather unlikely. Some studies have shown that treatment outcome measures (e.g., drug use, health care costs) “ramp up” before treatment admission and then “ramp down” soon afterward (Holder and Blose 1986, 1992; Holder, Cisler, Longabaugh, et al. 2000; Stout et al. 1999; Zywiak, Hoffman, Stout, et al. 1999). Conversely, the typical posttreatment follow-up interval for the ASI is rather short (e.g., 7-months postadmission), and there is evidence that improvements often extend beyond this period (Hubbard, Craddock, Flynn, et al. 1997).
Third, not all economically important treatment outcomes are included in the ASI (e.g., emergency room visits, outpatient clinic visits), and thus, the present total benefit estimate is an incomplete value of the actual total benefit. In addition, program costs may be slightly underestimated as well because costs specifically incurred by program clients are currently not included in the DATCAP.
Fourth, it could be argued that any analysis that does not include a no-treatment control group could possess some degree of selection bias. Substance abusers voluntarily seeking treatment are likely to be more motivated than substance abusers not seeking treatment, which by itself may (partially) explain their treatment success. Thus, motivated patients may improve even without formal treatment (Holder and Blose 1992). On the other hand, approximately 60 percent of admissions to addiction programs have been forced into treatment by the legal or welfare systems or by a spouse or employer (Lamb, Greenlick, and McCarty 1998). Moreover, for ethical reasons, it may be infeasible to include a matched sample of patients not receiving treatment.
Fifth, a related confounding factor is “regression to the mean.” Many substance abusers enter treatment at the point when their behaviors have become intolerable. Under these conditions, some of the improvement attributed to treatment may actually be occurring through a natural progression of the illness. Although potential solutions to this estimation problem (e.g., assembling a control group, correcting statistically for selection bias, or analyzing the stability of substance use behaviors) were not possible in this study, future treatment evaluations may be able to address this issue.
Application of the Benefit-Cost Guidelines
The Treatment Research Institute recently performed a controlled, quasi-experimental field study (henceforth referred to as the “Philadelphia Target Cities Project”) to examine the feasibility and effectiveness of providing enhanced social services with standard outpatient substance abuse treatment. The Treatment Research Institute performed the evaluation of the clinical effectiveness of this project over a 4-year period, extending from July 1992 to January 1997, and included three waves of patients. All patients volunteered to participate in the study and were recruited at admission to treatment or to a central intake unit. An “intent-to-treat” design was used in all three waves with no exclusions. The research found that patients receiving enhanced services showed significantly better outcomes, such as reduced alcohol and drug use, and fewer physical and mental health problems compared with the patient group treated with standard services only (see McLellan, Hagan, Levine, et al. 1998, for details of the methods and results).
As an empirical application of the methods proposed earlier, a representative benefit-cost analysis was conducted using data from three of the enhanced outpatient drug-free programs in the Philadelphia Target Cities Project. Economic cost data were collected for a period of 2 consecutive fiscal years, 1996 and 1997, using the DATCAP (French, Dunlap, Zarkin, et al. 1997). Economic (dollar) benefits were derived from patient self-reported information at treatment entry as well as at 7-months postadmission using variables measured through the ASI (McLellan, Hagan, Levine, et al. 1998).
Cost Analysis
Table 1 summarizes the cost estimates obtained through the DATCAP (fiscal years 1996 and 1997) for three outpatient drug-free programs from the Philadelphia Target Cities Project. All three programs had a private, not-for-profit structure but were supported with public funds. Total annual economic cost ranged from a low of $573,697 (program 2, 1997) to a high of $1,116,491 (program 1, 1996). Weekly economic cost per client, representing a more equitable comparison across programs, ranged from a low of $58 (program 3, 1997) to a high of $85 (program 1, 1996). Economic cost per treatment episode represents the product of the average length of stay and the weekly economic cost per client. The cost per episode ranged from $233 (program 3, 1997) to $338 (program 1, 1996). The average number of weeks in treatment was obtained from client records rather than using estimates provided by treatment administrators. The weighted average values for all of the cost estimates are reported at the bottom of Table 1.
Table 1.
Economic Cost Estimates for Fiscal Years 1996 and 1997 (1996 Dollars)
| Outpatient Program | Fiscal Year | Average Length of Stay (Weeks)* [1] | Average Daily Census [2] | Total Annual Economic Cost ($) [3] | Weekly Economic Cost Per Client ($)[3]/ [2]/52=[4] | Economic Cost Per Treatment Episode ($)†[1]×[4]=[5] |
|---|---|---|---|---|---|---|
| Program 1 | 1996 | 4 | 254 | 1,116,491 | 85 | 338 |
| 1997 | 4 | 280 | 985,698 | 68 | 271 | |
| Program 2 | 1996 | 4 | 165 | 620,826 | 72 | 289 |
| 1997 | 4 | 165 | 573,697 | 67 | 267 | |
| Program 3 | 1996 | 4 | 200 | 608,325 | 58 | 234 |
| 1997 | 4 | 200 | 605,032 | 58 | 233 | |
| Program | 1996 | 4 | 206 | 781,187 | 72 | 288 |
| average ‡ | 1997 | 4 | 214 | 720,117 | 64 | 228 |
Length of stay estimates were approximated from client records at each program.
Economic cost per treatment episode may not exactly equal the product of weekly cost per client and average length of stay due to rounding.
Represents the weighted average of the three outpatient drug-free programs, where the weights are the number of clients at each program.
Benefit Analysis
Table 2 provides an overview of the change in the matched pairs of the selected ASI variables as well as the corresponding average treatment benefits for the 7-month follow-up period. The number of days in residential addiction treatment, income received from employment, money spent on alcohol, money spent on drugs, and number of days experiencing psychiatric problems all showed a statistically significant change from baseline to follow-up (p <0.01). The direction of change in variable means in each case corresponded to positive benefits. Average treatment benefits are presented in column 3 of the table, by outcome, and in the aggregate. For the ASI variables not expressed in dollar terms, the number of units of change was multiplied by a monetary value (i.e., the most reliable unit cost estimate available) to obtain the corresponding average posttreatment benefit.
Table 2.
Average (Per Client) Treatment Benefits Accrued During 7-Month Follow-Up Period for Selected Outcomes (n=178) (1996 Dollars)
| Outcome (ASI Variable) | Difference in Admission and Follow-Up Means [1] | Monetary Value Per Unit Change ($) [2] | Average Treatment Benefit ($)1[1]×[2]×7=[3] |
|---|---|---|---|
| General information section | |||
| Number of days in a controlled environment (inpatient medical) | 0.12 | 1,029.77 2 (1,127.43) | 891 [ −972; 3,847] |
| Number of days in a controlled environment (inpatient psychiatric) | 0.00 | 193.69 3 (184.63) | N/A |
| Number of days in a controlled environment (inpatient addiction treatment) | 0.87* | 90.69 4 | 553 [ −275; 1,241] |
| Medical status | |||
| Number of days experiencing medical problems | 0.09 | 19.73 5 | 12 [ −231; 221] |
| Employment/Support status | |||
| Income received from employment | 56.74* | 1.00 6 | 397 [ −636; 1,175] |
| Drug/Alcohol use | |||
| Money spent on alcohol | 14.79* | 1.00 6 | 104 [51; 166] |
| Money spent on drugs | 145.71* | 1.00 6 | 1,020 [628; 1,472] |
| Legal status | |||
| Number of days engaged in illegal activities | 0.33 | 687.45 7 | 1,576 [ −612; 4,309] |
| Psychiatric status | |||
| Number of days experiencing psychiatric problems | 4.19* | 7.62 5 | 224 [140; 317] |
| Total benefit per client | 4,643* [2,131; 7,755] | ||
| [2,131; 7,755] |
Note: Bracketed values are 95 percent confidence intervals derived from bootstrap estimates (1,000 repetitions) using the bias-corrected approximation method (StataCorp 1999). Unit cost estimates in parentheses are national averages. N/A=not applicable.
Significantly greater than zero, p <0.01, Wilcoxon signed-rank test.
Benefits for the past 30 days were multiplied by 7 to cover benefits accrued during the 7-month follow-up period.
The average daily expenses (1996 dollars) for metropolitan community hospitals in Pennsylvania (American Hospital Association 2000). The amount in parentheses represents this same value for all metropolitan community hospitals in the United States (American Hospital Association 2000).
The sum of the average fee (1996 dollars) for evaluation and management services provided to a patient in a psychiatric residential treatment center and the average fee for individual psychotherapy for the State of Pennsylvania (American Medical Association 1999). The amount in parentheses represents this same calculation for the United States (American Medical Association 1999).
Mean average cost per day for inpatient residential treatment among programs that completed DATCAP (French et al. 1996, 1997; and other unpublished data).
Refer to equation 1. Estimated value of a statistical life=$1 million.
Because the ASI variable is already expressed in monetary units, the conversion factor equals 1.
The value represents the weighted cost of crimes associated with substance abuse. The number of crimes is assumed to be one act per day.
As shown in column 3 of Table 2, total treatment benefit per client over the 7-month follow-up amounted to $4,643 (p <0.01, 95 percent CI, $2,131, $7,755). As expected, the reduction in number of days engaged in illegal activities accounted for the largest share of total benefit ($1,576), followed by money spent on drugs ($1,020) and days of inpatient medical care ($891).
Sensitivity Analysis of Benefit Estimates
Results of additional sensitivity analyses for all variables included in the benefit calculations are reported in Table 3. Based on alternative assumptions and unit cost estimates, lower bound and upper bound values were calculated to demonstrate the range associated with estimation uncertainty. The lower and upper bound estimates can be compared with the mid range (i.e., suggested values) reported earlier in Table 2.
Table 3.
Sensitivity Analysis of Average (Per Client) Treatment Benefits (1996 Dollars)
| Outcome (ASI variable) | Difference in Admission and Follow-Up Means [1] | Monetary Value per Unit Change ($) (Lower Bound) [2] | Average Treatment Benefit ($)1(Lower Bound) [1]×[2]×7=[3] | Monetary Value per Unit Change ($) (Upper Bound) [4] | Average Treatment Benefit ($)1(Upper Bound) [1]×[4]×7=[5] |
|---|---|---|---|---|---|
| General information section | |||||
| Number of days in a controlled environment (inpatient medical) | 0.12 | 979.82 2 | 848 | 1,029.77 3 | 890 |
| Number of days in a controlled environment (inpatient psychiatric) | 0.00 | 193.69 4 | N/A | 193.69 4 | N/A |
| Number of days in a controlled environment | |||||
| (residential addiction treatment) | 0.87 | 69.64 5 | 424 | 116.29 6 | 709 |
| Medical status | |||||
| Number of days experiencing medical problems | 0.09 | 9.87 7 | 6 | 98.65 8 | 60 |
| Employment/Support status | |||||
| Income received from employment | 56.74 | 1.00 9 | 397 | 1.00 9 | 397 |
| Drug/alcohol use | |||||
| Money spent on alcohol | 14.79 | 0.00 10 | 0.00 | 1.00 9 | 104 |
| Money spent on drugs | 145.71 | 0.00 10 | 0.00 | 1.00 9 | 1,020 |
| Legal status | |||||
| Number of days engaged in illegal activities | 0.33 | 343.73 11 | 788 | 3,437.25 12 | 7,880 |
| Psychiatric status | |||||
| Number of days experiencing psychiatric problems | 4.19 | 3.81 7 | 112 | 38.08 8 | 1,117 |
| Total benefit per client | 2,197* | 14,565* |
Note: N/A=not applicable. *Significantly greater than zero, p <0.01, Wilcoxon signed-rank test.
Benefits for the past 30 days were multiplied by 7 to cover benefits accrued during the 7-month follow-up period.
The average daily expenses (1996 dollars) for community hospitals (metropolitan and nonmetropolitan) in Pennsylvania (American Hospital Association 2000).
The average daily expenses (1996 dollars) for metropolitan community hospitals in Pennsylvania (American Hospital Association 2000).
The sum of the average fee (1996 dollars) for evaluation and management services provided to a patient in a psychiatric residential treatment center and the average fee for individual psychotherapy for the State of Pennsylvania (American Medical Association 1999).
The lowest cost per day for inpatient residential treatment among programs that completed DATCAP (French et al. 1996, 1997; other unpublished data).
The highest cost per day for inpatient residential treatment among programs that completed DATCAP (French et al. 1996, 1997; and other unpublished data).
Refer to equation 1. Estimated value of a statistical life=$500,000.
Refer to equation 1. Estimated value of a statistical life=$5 million.
Because the ASI variable is already expressed in monetary units, the conversion factor equals 1.
The conversion factor is set equal to 0 to remove this benefit from the calculations.
Value represents the weighted cost of crimes associated with substance abuse. Number of crimes is assumed to be one act for every two days of illegal activity (i.e., including one day of planning or prospecting for each completed act).
Value represents the weighted cost of crimes associated with substance abuse. Number of crimes is assumed to be five acts per day.
Some important results from the sensitivity analysis merit discussion. First, the benefit estimate associated with reduced criminal activity was highly dependent on the assumed number of crimes committed per day of illegal activity, ranging from $788 (1 crime every other day) to $7,880 (5 crimes per day). Second, the estimated value of a statistical life (from $500,000 to $5 million) led to wide intervals for the benefits associated with improved medical and psychiatric status. Third, eliminating the benefits from less money spent on alcohol and drugs resulted in a drop of $1,124 in total benefit. Finally, factoring in the full-sensitivity analysis, the total benefit per client ranged from $2,197 to $14,565.
Benefit-Cost Analysis
Table 4 compares the total cost and total benefit of outpatient addiction treatment at three programs. Consistent with the sensitivity analysis for the benefit estimates, benefit cost statistics are also reported for the mid range, lower bound, upper bound, and 95 percent confidence interval. The estimate in column 1 is the weighted average economic cost per treatment episode and represents the average of fiscal years 1996 and 1997 (Table 1). Average net benefit for each category was obtained by deducting average economic cost (column 1) from the average economic benefit (column 2). Net benefit estimates ranged from $1,939 (lower bound) to $14,307 (upper bound), with a 95 percent CI of $2,067 to $7,697. Benefit-cost ratios displayed a similar distribution, ranging from $9 (lower bound) to $56 (upper bound) and a 95 percent CI of $9 to $31. The midrange benefit-cost ratio for all three programs amounted to $18, implying that, on average, for this sample, each dollar invested in outpatient drug-free treatment yielded $18 in economic benefit.
Table 4.
Comparison of Treatment Costs and Benefits (1996 Dollars)
| Measure | Average Economic Cost ($)1[1] | Average Economic Benefit ($)[2] | Average Net Benefit ($) [2]–[1]=[3] | Benefit-Cost Ratio ($) [2]/[1]=[4] |
|---|---|---|---|---|
| Mid range | 258 | 4,643* | 4,385* [2,067; 7,697] | 18 † [9; 31] |
| Lower bound | 258 | 2,197* | 1,939* | 9 † |
| Upper bound | 258 | 14,565* | 14,307* | 56 † |
Note: Bracketed values are 95 percent confidence intervals derived from bootstrap estimates (1,000 repetitions) using the bias-corrected approximation method (StataCorp 1999).
Significantly greater than zero, p <0.01, Wilcoxon signed-rank test.
Significantly greater than one, p <0.01, Wilcoxon signed-rank test.
The weighted average economic cost per treatment episode of the three outpatient drug-free programs (fiscal years 1996 and 1997), where the weights are the number of clients at each program.
Discussion and Conclusion
The overarching goals of this article were (1) to describe methodological guidelines for evaluating the costs and benefits of addiction treatment, employing proven health economics methods and validated clinical and economic instruments, and (2) to demonstrate the feasibility of the proposed guidelines through a representative benefit-cost analysis of real-world outpatient addiction treatment programs in Philadelphia. The proposed cost analysis technique uses resource use and cost data collected through the DATCAP. The proposed approach for estimating economic benefits is based on data from the ASI. Both instruments have been tested in numerous settings and are widely administered in substance abuse research.
This article offers evidence that the proposed methodological guidelines are both practical to apply in standard treatment programs and are capable of measuring economic costs and benefits. Therefore, the contributions of this research are both methodological and empirical, showing one approach for performing a rigorous economic evaluation using clinical as well as financial data collection instruments, and factoring in a broad spectrum of treatment outcomes.
The specific benefit-cost statistics reported here support earlier research, which determined that social services coupled with addiction counseling are “necessary and sufficient” conditions for truly effective treatment (McLellan, Hagan, Levine, et al. 1998). However, it is important to emphasize that the practical application of the economic evaluation approach was primarily included to determine the viability of these methods in real-world settings. The subject programs and their clinical and economic outcomes cannot be considered representative of the larger population of contemporary public treatments (e.g., Avants, Margolin, Sindelar, et al. 1999). The benefit-cost results presented here should therefore be viewed as suggestive rather than indicative.
Notwithstanding the limitations and qualifications discussed, the methodological guidelines and empirical application provide a foundation for future economic studies of substance abuse treatment. Although every evaluation project must collect specific and current data to estimate treatment costs and benefits, the instruments and techniques discussed here could be instructive and supportive.
Footnotes
Financial assistance for this study was provided by grants (P50 DA07705 and R01 DA11506) from the National Institute on Drug Abuse. The collection of the outcome data was financed by a Target Cities grant from the Center for Substance Abuse Treatment (4U95TI00008). This research was completed while Michael French was a visiting professor at the Research Center for Health and Economics, Department of Economics, Pompeu Fabra University, Barcelona, Spain. Brenda Booth, William Cartwright, George DeLeon, Michael Dennis, Constance Weisner, and two anonymous referees provided helpful suggestions. We are particularly grateful to Carmen Martinez and Silvana Zavala for their research and editorial assistance. The authors are entirely responsible for the research conducted in this article, and their position or opinions do not necessarily represent those of National Institute on Drug Abuse, Center for Substance Abuse Treatment, the University of Miami, the University of Pennsylvania, or Yale University.
References
- American Hospital Association. Hospital Statistics. Chicago: Author; 2000. [Google Scholar]
- American Medical Association. Medicare Physician Fee Schedule. Chicago: Author; 1999. [Google Scholar]
- Anderson DW, Bowland BJ, Cartwright WS, Bassin G. “Service-Level Costing of Drug Abuse Treatment.”. Journal of Substance Abuse Treatment. 1998;15:201–11. doi: 10.1016/s0740-5472(97)00189-x. [DOI] [PubMed] [Google Scholar]
- Avants SK, Margolin A, Sindelar JL, Rounsanville BJ, Schottenfield R, Stine S, Cooney NL, Rosenheck RA, Li SH, Kosten TR. “Day Treatment Versus Enhanced Standard Methadone Services for Opioid-Dependent Patients: A Comparison of Clinical Efficiency and Cost.”. American Journal of Psychiatry. 1999;156(1):27–33. doi: 10.1176/ajp.156.1.27. [DOI] [PubMed] [Google Scholar]
- Ball JC, Ross A. The Effectiveness of Methadone Maintenance Treatment. New York: Springer Verlag; 1991. [Google Scholar]
- Barnett PG. “The Cost-Effectiveness of Methadone Maintenance as a Health Care Intervention.”. Addiction. 1999;94(4):479–88. doi: 10.1046/j.1360-0443.1999.9444793.x. [DOI] [PubMed] [Google Scholar]
- Barnett PG, Zaric GS, Brandeau ML. “The Cost-Effectiveness of Buprenorphine Maintenance Therapy for Opiate Addiction in the U.S.”. Addiction. 2001;96(Sept):1267–78. doi: 10.1046/j.1360-0443.2001.96912676.x. [DOI] [PubMed] [Google Scholar]
- Bureau of Labor Statistics Data. 1999 Available at http://146.142.24/cgi-bin/surveymost.
- Cartwright WS. “Cost-Benefit and Cost-Effectiveness Analysis of Drug Abuse Treatment Services.”. Evaluation Review. 1998;22(5):609–36. doi: 10.1177/0193841X9802200503. [DOI] [PubMed] [Google Scholar]
- Drummond MF, O'Brien BJ, Stoddart GL, Torrance GW. Methods for the Economic Evaluation of Health Care Programmes. New York: Oxford University Press; 1997. [Google Scholar]
- French MT. “Economic Evaluation of Drug Abuse Treatment Programs: Methodology and Findings.”. American Journal of Drug and Alcohol Abuse. 1995;21:111–35. doi: 10.3109/00952999509095233. [DOI] [PubMed] [Google Scholar]
- French MT. “Economic Evaluation of Alcohol Treatment Services.”. Evaluation and Program Planning. 2000;23(1):27–39. [Google Scholar]
- French MT. Drug Abuse Treatment Cost Analysis Program (DATCAP): Program Version. 7th. Coral Gables: University of Miami; 2001a. [Google Scholar]
- French MT. Drug Abuse Treatment Cost Analysis Program (DATCAP): Program Version User's Manual. 7th. Coral Gables: University of Miami; 2001b. [Google Scholar]
- French MT, Dunlap LJ, Galinis DN, Rachal JV, Zarkin GA. “Health Care Reforms and Managed Care for Substance Abuse Services: Findings from 11 Case Studies.”. Journal of Public Health Policy. 1996;17(2):181–203. [PubMed] [Google Scholar]
- French MT, Dunlap LJ, Zarkin GA, McGeary KA, McLellan AT. “A Structured Instrument for Estimating the Economic Cost of Drug Abuse Treatment: The Drug Abuse Treatment Cost Analysis Program (DATCAP).”. Journal of Substance Abuse Treatment. 1997;14:1–11. doi: 10.1016/s0740-5472(97)00132-3. [DOI] [PubMed] [Google Scholar]
- French MT, Mauskopf JE, Teague JL, Roland EJ. “Estimating the Dollar Value of Health Outcomes from Drug-Abuse Interventions.”. Medical Care. 1996;34:890–910. doi: 10.1097/00005650-199609000-00003. [DOI] [PubMed] [Google Scholar]
- French MT, McCollister KE, Sacks S, McKendrick K, De Leon G. “Benefit-Cost Analysis of a Modified Therapeutic Community for Mentally Ill Chemical Abusers.”. Evaluation and Program Planning. In press b. [Google Scholar]
- French MT, McGeary KA. “Estimating the Economic Cost of Substance Abuse Treatment.”. Health Economics. 1997;6:539–44. doi: 10.1002/(sici)1099-1050(199709)6:5<539::aid-hec295>3.0.co;2-0. [DOI] [PubMed] [Google Scholar]
- French MT, Salomé HJ, Krupski A, McKay JR, Donovan DM, McLellan AT, Durell J. “Benefit-Cost Analysis of Residential and Outpatient Addiction Treatment in the State of Washington.”. Evaluation Review. 2000;24(6):609–34. doi: 10.1177/0193841X0002400603. [DOI] [PubMed] [Google Scholar]
- French MT, Salomé HJ, Carney M. “Using the DATCAP and ASI to Estimate the Costs and Benefits of Residential Addiction Treatment in the State of Washington.”. Social Science and Medicine. doi: 10.1016/s0277-9536(02)00060-6. In press a. [DOI] [PubMed] [Google Scholar]
- Gold MR, Siegel JE, Russell LB, Weinstein MC, editors. Cost-Effectiveness in Health and Medicine. New York: Oxford University Press; 1996. [Google Scholar]
- Goodman AC, Nishiura E, Hankin JR, Holder HD, Tilford JM. “Long-term Alcoholism Treatment Costs.”. Medical Care Research and Review. 1996;52:441–64. doi: 10.1177/107755879605300404. [DOI] [PubMed] [Google Scholar]
- Hargreaves WA, Shumway M, Hu TW, Cuffel B. Cost-Outcome Methods for Mental Health. San Diego: Academic Press; 1998. [DOI] [PubMed] [Google Scholar]
- Harwood H, Fountain D, Livermore G. The Economic Costs of Alcohol and Drug Abuse in the United States. Rockville, MD: National Institute on Drug Abuse and National Institute on Alcohol Abuse and Alcoholism; 1992. 98-4327. [Google Scholar]
- Harwood HJ, Hubbard RL, Collins J, Rachal JV. “A Cost-Benefit Analysis of Drug Abuse Treatment.”. Research in Law and Policy Studies. 1995;3:191–214. [Google Scholar]
- Holder HD. “Alcoholism Treatment and Potential Health Care Cost Saving.”. Medical Care. 1987;25(1):52–71.. doi: 10.1097/00005650-198701000-00007. [DOI] [PubMed] [Google Scholar]
- Holder HD, Blose JO. “Alcoholism Treatment and Total Health Care Utilization and Costs. A Four Year Longitudinal Analysis of Federal Employees.”. The Journal of the American Medical Association. 1986;256:1456–60. [PubMed] [Google Scholar]
- Holder HD, Blose JO. “The Reduction of Healthcare Costs Associated with Alcoholism Treatment: A 14-Year Longitudinal Study.”. Journal of Studies on Alcohol. 1992;53:293–302. doi: 10.15288/jsa.1992.53.293. [DOI] [PubMed] [Google Scholar]
- Holder HD, Cisler RA, Longabaugh R, Stout RL, Treno AJ, Zweben A. “Alcoholism Treatment and Medical Care Costs from Project MATCH.”. Addiction. 2000;95(7):999–1013. doi: 10.1046/j.1360-0443.2000.9579993.x. [DOI] [PubMed] [Google Scholar]
- Holder HD, Longabaugh R, Miller WR, Rubonis AV. “The Cost Effectiveness of Treatment for Alcoholism: A First Approximation.”. Journal of Studies on Alcohol. 1991;52(6):517–40. doi: 10.15288/jsa.1991.52.517. [DOI] [PubMed] [Google Scholar]
- Hubbard RL, Craddock G, Flynn PM, Anderson J, Etheridge R. “Overview of 1-Year Follow-up Outcomes in the Drug Abuse Treatment Outcome Study (DATOS).”. Psychology of Addictive Behavior. 1997;11:261–78. [Google Scholar]
- Gerstein D, Harwood H, editors. Institute of Medicine. Treating Drug Problems: A Study of the Evolution, Effectiveness, and Financing of Public and Private Drug Treatment Systems. Washington, DC: National Academy Press; 1990. edited by. [PubMed] [Google Scholar]
- Johannesson M. Theory and Methods of Economic Evaluation of Health Care. Dordrecht: Kluwer Academic Publishers; 1996. [PubMed] [Google Scholar]
- Kenkel D. “On Valuing Morbidity, Cost-Effectiveness Analysis, and Being Rude.”. Journal of Health Economics. 1997;16:749–57. doi: 10.1016/s0167-6296(97)00027-1. [DOI] [PubMed] [Google Scholar]
- Lamb S, Greenlick M, McCarty D, editors. Bridging the Gap: Forging New Partnerships in Community-Based Drug Abuse Treatment. Washington DC: National Academy Press; 1998. [PubMed] [Google Scholar]
- McLellan AT, Hagan TA, Levine M, Gould F, Meyers K, Bencivengo M, Durell J. “Supplemental Social Services Improve Outcomes in Public Addiction Treatment.”. Addiction. 1998;93:1489–99. doi: 10.1046/j.1360-0443.1998.931014895.x. [DOI] [PubMed] [Google Scholar]
- McLellan TA, Kushner H, Metzger D, Peters R, Smith I, Grissom G, Pettinati H, Argeriou M. “The Fifth Edition of the Addiction Severity Index.”. Journal of Substance Abuse Treatment. 1992;9:199–213. doi: 10.1016/0740-5472(92)90062-s. [DOI] [PubMed] [Google Scholar]
- McLellan AT, Lewis DC, O'Brien CP, Kleber HD. “Drug Dependence, a Chronic Medical Illness: Implications for Treatment, Insurance, and Outcomes Evaluation.”. Journal of the American Medical Association. 2000;284(13):1689–95. doi: 10.1001/jama.284.13.1689. [DOI] [PubMed] [Google Scholar]
- McLellan AT, Luborsky L, O'Brien CP, Woody GE. “An Improved Diagnostic Instrument for Substance Abuse Patients: The Addiction Severity Index.”. Journal of Nervous and Mental Diseases. 1980;168:26–33. doi: 10.1097/00005053-198001000-00006. [DOI] [PubMed] [Google Scholar]
- McLellan AT, Woody GE, Metzger D, McKay JR, Alterman AI, O'Brien CP. “Evaluating the Effectiveness of Treatments for Substance Use Disorders: Reasonable Expectations, Appropriate Comparisons.”. The Milbank Quarterly. 1996;74(1):51–85. [PubMed] [Google Scholar]
- Plotnick RD. “Applying Benefit-Cost Analysis to Substance Use Prevention Programs.”. International Journal of Addiction. 1994;29:339–59. doi: 10.3109/10826089409047385. [DOI] [PubMed] [Google Scholar]
- Rajkumar AS, French MT. “Drug Abuse, Crime Costs, and the Economic Benefits of Treatment.”. Journal of Quantitative Criminology. 1997;13:291–323. [Google Scholar]
- Rouse B, Kozel N, Richards L, editors. Self-Report Methods of Estimating Drug Use: Meeting Current Challenges to Validity. Rockville MD: National Institute on Drug Abuse; 1985. [Google Scholar]
- Salomé HJ, French MT, Galanter M. “Using Cost and Financing Instruments for Economic Evaluation of Substance Abuse Treatment Services.”. In: Galanter M, editor. Recent Developments in Alcoholism, Volume 15: Services Research in the Era of Managed Care. New York: Kluwer Academic/Plenum Publishers; 2001. pp. 253–69. Section III, edited by. [DOI] [PubMed] [Google Scholar]
- Siegel S, Castellan NJ. Nonparametric Statistics for the Behavioral Sciences. New York: McGraw-Hill; 1988. [Google Scholar]
- Sindelar JL, Manning WG, Jr, Egertson JA, Fox DM, Leshner AI. “Cost-Benefit and Cost-Effectiveness Analysis: Issues in the Evaluation of the Treatment of Illicit Drug Abuse.”. In: Egertson JA, Fox DM, Leshner AI, editors. Treating Drug Abusers Effectively. Malden MA: Blackwell Publishers; 1997. edited by. [Google Scholar]
- Sloan FA, editor. Valuing Health Care. New York: Cambridge University Press; 1996. [Google Scholar]
- StataCorp. Stata Statistical Software: Release 6.0. College Station, TX: Author; 1999. [Google Scholar]
- Stout RL, Zywiak W, Rubin A. Presented at the Scientific Conference of the Research Society on Alcoholism. Santa Barbara CA: 1999. “Time-Course of Health Care Use Before and After Alcohol Treatment.”. [Google Scholar]
- Tolley G, Kenkel D, Fabian R, editors. Valuing Health for Policy: An Economic Approach. Chicago: The University of Chicago Press; 1994. [Google Scholar]
- Turner C, Lessler J, Devore J. Survey Measurement of Drug Use: Methodological Studies National Institute on Drug Abuse. Washington, DC: U.S. Government Printing Office; 1992. “Effects of Mode of Administration and Wording on Reporting of Drug Use.”. [Google Scholar]
- Viscusi WK. “The Value of Risks to Life and Health.”. Journal of Economic Literature. 1993;32:1912–46. [Google Scholar]
- Zarkin GA, French MT, Anderson DW, Bradley CJ. “A Conceptual Framework for the Economic Evaluation of Substance Abuse Interventions.”. Evaluation and Program Planning. 1994;17:409–18. [Google Scholar]
- Zarkin GA, Lindrooth RC, Demiralp B, Wechsberg W. “The Cost and Cost-Effectiveness of an Enhanced Intervention for People with Substance Abuse Problems at Risk for HIV.”. Health Services Research. 2001;36(2):335–56. [PMC free article] [PubMed] [Google Scholar]
- Zywiak WA, Hoffman NG, Stout RL, Hagberg S, Floyd AS, DeHart SS. “Substance Abuse Treatment Cost Offsets Vary with Gender, Age, and Abstinence Likelihood.”. Journal of Health Care Finance. 1999;26(1):33–9. [PubMed] [Google Scholar]