

Abstract
Objective
To assess whether presentation approaches designed to be more meaningful result in greater weighting of quality information in decisions. An emerging body of research indicates that the way information is presented affects how it is interpreted and how it is weighted in decisions. Comparative health plan performance reports are not being used by consumers possibly because the information presented is difficult to use. The next generation of these reports should be designed to support decision making.
Design and Study Participants
The study uses a controlled experimental design. Participants (n = 162) were randomly assigned to different conditions and asked to complete tasks related to using quality information and making health plan selections. Dependent variables included the amount of weight given to quality information in choices and decision accuracy.
Results
Some presentation approaches make it easier for users to process and integrate quality data into their choices. However, other presentation formats influence consumers’ decisions in ways that undermine their self-interest.
Conclusions
Findings indicate that presenting quality data in a more evaluable format increases the weight it carries in consumer decisions. Every change made in the presentation of comparative data has the potential to influence decisions. Those who disseminate information have a responsibility to be aware of how they use that influence and to direct it in productive and defensible ways. The alternative is to manipulate people in ways that are unknown, are not thought out, or are not defensible, but are no less manipulative.
Keywords: Decision making, health plan choice, report cards, consumer information
Increasing the use of quality information by consumers making health plan choices is a principal goal in the dissemination of performance report cards. A rationale for providing quality information to consumers is to ensure that plans do not compete on cost alone but on quality too. Another key goal is to give consumers more influence and control over the kind of care they receive. However, evaluations of report card efforts show that they have little impact on consumer choices and have left many consumers confused (Chernew and Scanlon 1998; Hibbard and Jewett 1997; Knutson et al. 1998; Scanlon, Chernew, and McLaughlin 1999). The next generation of comparative quality reports should be designed specifically to support informed decision making.
Report card formats, when tested, have been evaluated in focus groups or in cognitive interviews to determine their attractiveness to consumers. However, even if a format is attractive, this does not guarantee it helps consumers process information in a way that serves their interests. Controlled experiments can examine how information is integrated into the decision-making process without the confounding factors often present in real-world settings and can help report card designers understand the influence that presentation has on choice. Thus, by using laboratory studies to examine the processing of health plan information, we assess what approaches help consumers use the information effectively.
Related Literature
The dissemination of comparative reports to employees during open enrollment has not influenced health plan choice (Chernew and Scanlon 1998; Knutson et al. 1998). Investigators have posited a number of hypotheses to explain this lack of effect. Consumers may not understand the information, may not have the skills to use it, and/or prefer to rely on more informal and personal sources of information, such as friends or family (Hibbard and Jewett 1997; Scanlon and Chernew 1999). Alternatively, report cards may be sending mixed signals to consumers and thereby may be reducing their perceived value. In comparing different report cards that describe the same health plans, Scanlon et al. (1998) found inconsistencies in how plans were rated across the different reports. The authors speculate that these inconsistencies are confusing and undermine the perceived utility and accuracy of the reports.
Investigators have begun to examine how the information in reports is presented to consumers, as a way to increase their impact. For example, extensive testing was carried out to design a reporting format for the Consumer of Health Plans Study (CAHPS) survey data. Cognitive tests were conducted with consumers to gather their reactions to mock-ups of various approaches to reporting CAHPS survey results (McGee, Kanouse, Sofaer, et al. 1999).
Other investigators have looked at the content of the information included in reports to assess what information influences choices. Spranca, Kanouse, Elliot, et al. (2000) used an experimental design to examine the relative importance of various factors, including CAHPS information, in making a health plan choice. They found that in the absence of CAHPS information, most consumers preferred plans that covered more services, even though they cost more. When CAHPS information was provided, consumers shifted to less-expensive plans covering fewer services if CAHPS ratings identified those plans as high quality.
Using a computer system that provides different plan descriptions and different levels of information, Sainfort and Booske (1996) examined what information was used and valued by consumers in making a health plan choice. They found that presenting new categories of variables stimulates consumers to consider factors they had not previously considered in their choices. Thus, it appears that the topics included in comparative reports, as well as the level of performance (and cost) shown in the reports, influence choices.
Although a variety of reporting formats have been used in different report card efforts, there has been no systematic controlled evaluation of how the reporting format effects whether and how the information is actually used in choice.
Theoretical Framework
Much psychological research shows that preferences are remarkably labile and sensitive to the way a choice is described or framed, even in the absence of intervening time or events. These findings have led to the theory of constructed preference—namely that preferences are often constructed in the process of elicitation or deciding (Slovic 1995). This is quite different from the assumption that individuals possess a fixed and ordered set of preferences. The new conception applies particularly to choices among options that are important, complex, and unfamiliar, like those facing consumers in the current health care environment.
The research presented here examines the influence of information presentation on consumer choices among health plans. Because how information is framed appears to affect strongly the way it is used, as well as the resulting choices, we examine how the presentation of health plan performance (e.g., prevention or consumer satisfaction) may raise (or lower) the importance of those variables in consumer decisions.
Assessing the Decision Process: The Evaluability Principle
Our research uses laboratory studies in which consumers are given reports and asked to interpret the information and make a decision. Consumers will likely want to give weight to both quality and cost factors when evaluating health care plans. However, research suggests that unless quality information is made evaluable through careful attention to context and formatting, it may have far less influence on consumers’ decisions than consumers would like it to have and than they think it actually did have. How could this be? The answer to this question is found in research by Hsee (1995, 1996, 1998) on the concept of evaluability. The evaluability principle asserts that the weight given to an attribute in a choice is proportional to the ease or precision with which the value of that attribute (or a comparison of the attribute across alternatives) creates an affective (good/bad) feeling.
An important feature of evaluability is that it operates outside of the decision maker's conscious awareness. Hsee (1998) found that respondents thought they were giving high weight to an attribute in their choices when in fact they were not. Evaluability determines whether the presentation format helps or hinders decision makers in their attempts to make their choices accurately reflect their desired weighting of attributes. We refer to this quality as decision accuracy.
In summary, research on evaluability is noteworthy because it shows that even very important attributes may not be used unless they can be translated into an affective frame of reference, giving them meaning as being something desirable or undesirable.
The implications of the evaluability principle for judgments about health care plans are direct and powerful. Cost, because it is both precise and familiar, is likely to be more easily evaluable than measures of quality. Quality measures are often difficult for consumers to understand ( Jewett and Hibbard 1996). Even relatively well-understood measures, such as measures of patient satisfaction, are sometimes reported in diffuse terms (e.g., percentage of respondents rating the plan as very satisfactory, somewhat satisfactory, and not satisfactory), potentially lowering the evaluability of the measures. Moreover, self-reports of information use are not valid measures of actual information use. Controlled experimental studies are required to describe accurately the way consumers weigh quality measures in choices.
These studies aim to examine the use of quality information in judgments and decisions about health care plans, building on the body of theory and research described previously here. The specific research questions are as follows:
-
Do presentation approaches designed to increase the evaluability of comparative quality information result in greater weighting of that information in decisions?
Does the use of visual cues (in the form of stars) in comparative reports increase the weighting of quality relative to cost (Experiment I: Visual Cues)?
Does ordering health plans on performance, within cost strata, result in a greater weighting of quality in decisions (Experiment II: Ordering)?
Does the addition of affective cues to trend data in the form of pluses (+) and minuses (−) result in greater use of that data (Experiment III: Trend Data)?
Does summarizing several performance measures into one measure or disaggregating the measures influence decision outcomes (Experiment IV: Summarizing)?
Method
The Study Sample
Study participants were recruited through the benefits office of the City of Eugene, OR. Participation was voluntary, and participants (n = 162) were paid $15. They were required to have had health insurance within the last year. Electronic mail messages and posters were used to recruit employees.
Data Collection
Data collection took place at a central location convenient to most city employees. It took an average of an hour for participants to complete the tasks and the surveys. Because of limited time, approximately 40 percent of the participants took the packet of decision tasks home to complete and returned them the next day.
Design
Each participant was asked to take part in all four of the experiments described later here. Within each experiment, participants were randomly assigned to different conditions and were asked to review information and complete decision tasks related to using comparative information and making health plan selections. Some of the experiments used within-subject designs; others used between-subject designs. Dependent variables included the amount of weight given to quality information or the weight given to quality relative to cost (where weights were derived from choices) and decision accuracy (whether choices reflect desired weighting of attributes). The detailed methods of each experiment are provided later here.
The Sample
The sample was 66 percent female and 34 percent male, with a mean age of 41. Slightly over half the sample (54 percent) had at least a 4-year college degree with another 40 percent having at least some college education. The U.S. Census reports that only 27 percent of the employed adult population holds at least a college-level education, indicating that our sample was biased toward well-educated individuals. Because higher education should mitigate the effects of superficial contextual changes on decision outcomes, this sample provides a conservative test of our hypothesis.
Ninety percent of the sample was White and nearly two-thirds (63 percent) had an annual household income of $40,000 or more. As intended, most participants (98 percent) were working either full- or part-time, and only four individuals (2 percent) did not currently have health insurance.
Over half (56 percent) of the sample reported their health to be excellent or very good, with another 30 percent reporting that their health was good; no one reported poor health. When asked what type of health insurance plan they currently had, 45 percent indicated that they had an HMO-type health insurance. Twenty-nine percent had a preferred provider plan, and 18 percent had a traditional fee-for-service insurance plan (the remaining 8 percent indicated that they did not know).
Experiment I: Visual Cues
Rationale
One way to increase the evaluability of information is to add cues that help the user sort the choices into better and worse options. In this first experiment, we tested the effect of using visual cues (in the form of stars) to present quality information about health plans. We use stars to show whether a health plan is above average in performance (⋆⋆⋆), average (⋆⋆), or below average (⋆). Does adding these visual cues result in a greater weighting of quality data versus cost data in decisions?
Method
Three data-presentation approaches were tested in a within- and between-groups design in which quality information was presented in one of three formats: (1) stacked bar with stars (as shown in Figure 1), (2) stars only, and (3) stacked bar only. Participants in each group chose among the same plans (i.e., the underlying data were the same for all groups, but the data presentation was different in each group). For each of three choices, participants indicated which HMO (of the five presented) that they would be the most likely to choose. In each of the cases, HMO plans differed only in quality of care and premium cost.1
Figure 1.
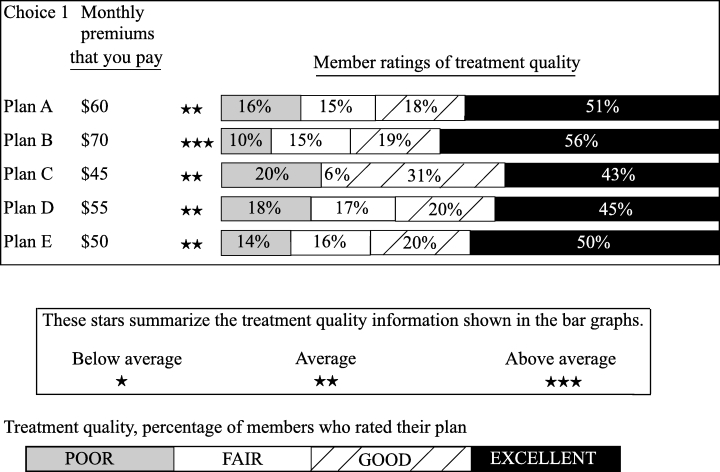
Sample of bar-chart-plus-stars format
Choice 1 included one plan with above-average quality and four average plans. Choice 2 included one above-average plan and four below-average plans. Choice 3 included one above-average plan, two average, and two below-average plans.
Within each of the five-plan choice sets, the highest quality plan (e.g., plan B in Figure 1) was always more expensive than the other plans, and thus, there was no “right” answer. However, we expected that enhancing the evaluability of a plan's quality through the use of stars would lead to more frequent selection of the highest quality plan in the stars-only and the stacked-bar-with-stars conditions.
Results
A repeated-measures analysis of variance using the three choices as the repeated measures and the three conditions as the independent variable indicated that the evaluability manipulation significantly impacted choice, F(2,157)=5.2, p < 0.01. Participants in the stacked-bar-only condition chose the highest quality plans significantly less often than participants in the stars-only and stacked-bar-with-stars conditions (both ps < 0.05); the two evaluability conditions (stars-only and stacked-bar-with-stars) did not differ significantly from one another. Table 1 presents the mean number of choices of the highest quality plan, out of the three choices made. Whereas quality was maximized in only approximately half of the choices in the stacked-bar-only condition, it was maximized in slightly more than two thirds of the choices when stars were displayed.
Table 1.
Mean Number of Choices of the Highest Quality Plan (Maximum = Three Choices)
| Version | n | Mean (Out of Three) | Highest Quality Choices |
|---|---|---|---|
| Stacked bars only | 52 | 1.46 | 49 Percent |
| Stars only | 51 | 2.18 | 73 Percent |
| Stacked bar with stars | 57 | 2.02 | 67 Percent |
Overall F2,157=5.15;p < 0.01.
Means for stars only and for stacked bar with stars differed significantly from stacked bars only at p < 0.05; Tukey's Honestly Significant Difference Test.
Discussion of Experiment I
As hypothesized, results of this experiment demonstrate that the presentation format of quality information influences its weighting in choice. Enhancing evaluability by providing quality information in a stars-only format or a stacked-bar-with-stars format (compared with a stacked-bar-only format) caused participants to give quality information more weight relative to cost when making their choices.
Experiment II: Ordering
Rationale
Another way to make quality information more evaluable, hence more usable, may be to present plans in an ordered display—from high to low quality. Russo, Krieser, and Miyashita (1975) demonstrated the value of this technique in their classic study demonstrating how display format affects the use of unit price information in grocery stores. Russo et al. contended that mere availability of information is insufficient. They distinguished between available information and processable information and showed that before consumers can effectively use unit-price information, a convenient “processable” display of that information is necessary. They found that posting a list that rank ordered products with respect to their unit prices significantly increased the selection of items with lower unit prices. In Experiment II, we extended the Russo paradigm to the domain of health plans. We predicted that making quality data more easily evaluable by listing plans in order from high to low on a summary measure of quality would greatly increase reliance on quality.
Method
A stimulus set was created with 15 plans described on two variables: cost and member satisfaction. Plans with higher percentages of satisfied members were more expensive. Half of the participants were shown the list of plans ordered by cost, as shown in Figure 2. Within each cost stratum, the plans were ordered by member satisfaction. The remaining participants were shown the same list of plans ordered alphabetically. Respondents indicated their first, second, and third preferences among the 15 plans. Participants could make all three of their choices within one cost stratum, or they could make their three choices in different cost strata. We evaluated each choice in terms of whether the highest performing available plan within a cost stratum was chosen.
Figure 2.
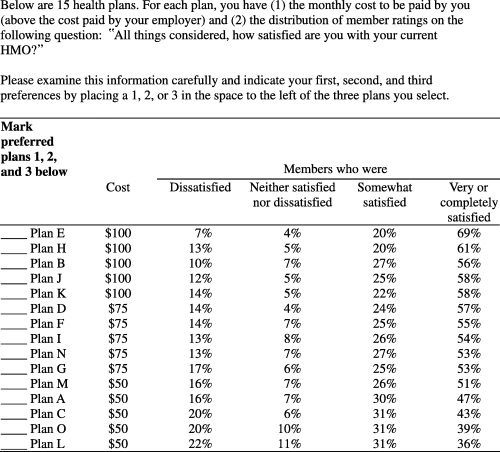
Health plan choices: Ordered by performance within cost strata
Results
The analysis takes into account each individual's pattern of first, second, and third choices. Choice patterns are considered quality maximizing if no inferior option is selected ahead of a superior option within its cost stratum. For example, a participant who chooses plans E, D, and M with their three choices would be quality maximizing, as these are the highest performing plans within each of the cost strata. Similarly, if a participant made all three choices within one cost strata—plan M as their first choice, plan A as their second choice, and plan C as their third choice—they would be making quality-maximizing choices, as they are choosing the highest performing available plan within that one cost stratum. However, if a participant chose plans E, D, and A, this would not be a quality-maximizing choice. Even though plans E and D are the highest performing plan in their respective cost strata, plan A is not the highest performing plan within its cost stratum (the $50 cost stratum).2
Table 2 presents the frequencies of quality-maximizing and non–quality-maximizing patterns for the first choice, first two choices, and for all three choices. Regardless of the number of choices considered, there were approximately twice as many non–quality-maximizing choice patterns in the unordered condition than in the ordered one3 (all χ2 s > 3.8, p s < 0.05).
Table 2.
Quality Maximizing and Non-Quality-Maximizing Choices Among Plans Ordered and Not Ordered on Quality
| Ordered | Not Ordered | ||
|---|---|---|---|
| First Choices | |||
| Non-quality maximizing | 5 | 12 | |
| 6.5 Percent | 16.7 Percent | ||
| χ2 = 3.81 | |||
| p < 0.05 | |||
| Quality maximizing | 72 | 60 | |
| 93.5 Percent | 83.3 Percent | ||
| 77 | 72 | 149 | |
| First and Second Choices | |||
| Non-quality maximizing | 12 | 22 | |
| 15.6 Percent | 30.6 Percent | ||
| χ2 = 4.74 | |||
| p < 0.05 | |||
| Quality maximizing | 65 | 50 | |
| 84.4 Percent | 69.4 Percent | ||
| 77 | 72 | 149 | |
| First, Second, and Third Choices | |||
| Non-quality maximizing | 17 | 31 | |
| 22.1 Percent | 43.1 Percent | ||
| χ2 = 7.50 | |||
| p < 0.01 | |||
| Quality maximizing | 60 | 41 | |
| 77.9 Percent | 56.9 Percent | ||
| 77 | 72 | 149 |
Discussion of Experiment II
These results are consistent with the hypothesis that ordering on quality data leads to choices of higher quality plans. This study bears repeating with more complex choices, described in terms of other nonquality attributes besides cost and also described in terms of multiple quality measures. It seems likely that having to choose among more complex choices, with greater information-processing demands, will lead people to give even greater weight to ordered measures.
Experiment III: Trend Data
Rationale
A key element in the goal of public reporting of health plan performance is to give plans an incentive to continuously improve. Ideally, plans with a positive trend in performance over time would be rewarded with a larger market share. In this experiment, using trend data, we tested a third approach to making performance data evaluable. We examined whether providing trends in performance over time would be evaluable enough to influence choices among health plans or whether trend data would influence choices only when made more evaluable by adding an explicit percent change with valence in the form of a plus (+) or a minus (−).
Method
Participants were asked to compare two HMO plans that differed in cost and in member satisfaction scores. Participants were randomly assigned to one of three conditions. All groups received current-year information about cost and member satisfaction. In condition 2, participants also received member satisfaction information from previous years plus explicit percentage changes with the direction of change shown with (+) or (–) (Figure 3). HMO A had higher scores on member satisfaction in the current year and higher cost ($60 versus $45 a month), but member satisfaction had declined in recent years. HMO B showed a lower current level of member satisfaction and a lower cost, but member satisfaction had improved in recent years. In condition 3, participants received the same information minus the explicit (and evaluable) percentage changes. Participants indicated how likely they were to choose HMO A versus HMO B using the scale shown in Figure 3.
Figure 3.
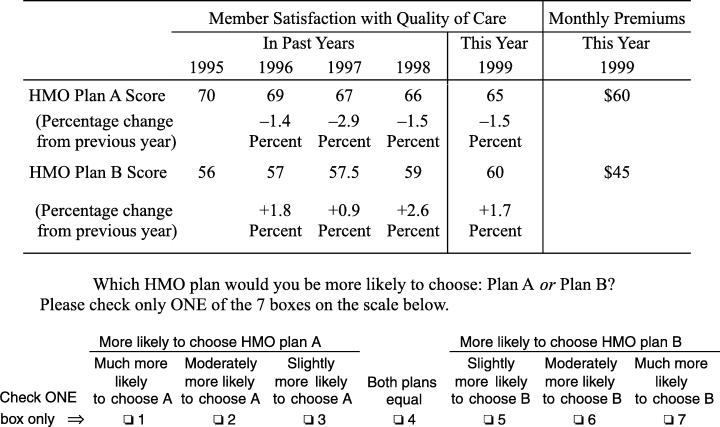
Trends, Explicit-trend-version
Results
A one-way analysis of variance indicated that participant choices in the three conditions were marginally different, F(2,87)=2.4, p < 0.10. Planned comparisons for our two specific hypotheses showed that providing explicit trend information increased the proportion of participants who chose the HMO with a positive trend but lower current performance. Seventy-five percent of participants chose the positive-trend HMO B in the more evaluable explicit-trend condition compared with 61 percent in the current year-only condition (mean choices = 5.4 and 4.3, respectively; t[60]=2.1, one-tailed p < 0.05). Explicit-trend participants also chose positive-trend HMO B more often than did raw-score trend participants who chose it only 59 percent of the time (average choice = 4.5 in the raw-sore trend condition; t [58] =1.8, one-tailed p < 0.05). In a post hoc test, raw-score trend participants did not differ significantly from current year-only participants.
Discussion of Experiment III
Explicit-trend information, in the form of percentage change from previous years, appears to be a more evaluable format for presenting information. The valence signs (+ or −) used to express the direction of the trend may add affective meaning to the information and thus elevate its importance. In the presence of these explicit trends (but not in their absence), participants made choices consistent with giving more weight to the trend information and less weight to current levels of performance.
Experiment IV: Summarizing Data
Rationale
Presenting the consumer with a large number of quality measures, as is common in most report cards, is likely to be overwhelming and confusing. It could lead to neglect of such measures. One proposed way of reducing the complexity is to summarize sets of quality measures rather than presenting data for each individual measure.
However, Birnbaum's (1999) and Lin's (1999) work indicates that summarized attributes may be weighted differently by decision makers than the disaggregated set of subattributes from which the summary is created. Thus, in Experiment IV, we examined whether summarization affects information use in the context of decisions about health care plans.
Method
Participants were given both choice 1 and choice 2, as shown in Figure 4. Half of the study participants did choice 1 first, completed a few unrelated tasks, and then did choice 2. The remaining half of the participants did choice 2 first and later were given choice 1. In both choices, HMOs A and B are described on three quality-related attributes—customer service, preventive medical care, and treatment quality—and each attribute has three measures. In choice 1, the measures for customer service and preventive medical care are summarized into one overall assessment. However, treatment quality is disaggregated into its three component measures. Choice 2 is identical except that customer service is disaggregated and treatment quality is summarized.
Figure 4.
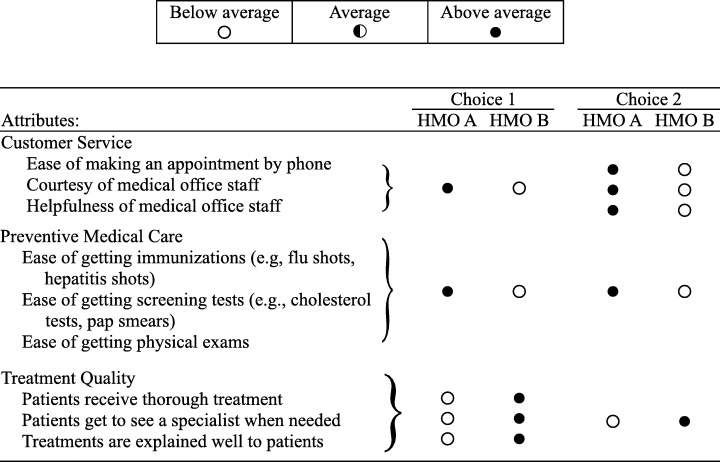
Summarizing and disaggregating performance measures
Participants indicated their preferred plan and marked the strength of their preference using a scale similar to that in Figure 3. After expressing their second preference, participants were asked to divide 100 points over the three attributes (service, preventive care, and treatment quality) to indicate the relative importance of each attribute in determining the choice they had just made.4
Results
Studies in the field of behavioral decision making have found that decision makers are influenced by the number of measures favoring each of their choice options. Thus, in choice 1, we expected the summarization of customer service to result in that attribute being weighted less relative to treatment quality, which was disaggregated. In choice 2, where customer service was disaggregated, we expected that it would be weighted more highly than in choice 1. This change in weighting was expected to lead to a higher preference rating for HMO A in choice 2 than in choice 1. The results confirmed these expected shifts in preference ratings between choice 1 and choice 2. Thirty seven of the 107 participants (35 percent) shifted their preference rating in the predicted direction. These individuals did not necessarily select HMO A in choice 2. Rather, they marked the response scale in a way that showed movement in the direction of greater preference for A, as predicted. Only seven participants (7 percent) moved their preferences on the response scale in the nonpredicted direction. This difference between predicted and nonpredicted changes was statistically significant by sign test (z=3.08, p < 0.001). Thus, approximately one third of our participants changed their second preference in the direction predicted by a simple model that gives equal weight to every filled or open circle, regardless of whether that circle represented a single quality measure or a summary of several measures.
Fourteen persons not only shifted their preferences in the predicted direction, they actually reversed their preferences, choosing plan B in choice 1 and plan A in choice 2, even though these two decisions were made only a few minutes apart. Only four participants reversed their choices in the nonpredicted direction.
According to the mean subjective weighting factors in Table 3, however, respondents thought they had used the attributes similarly in choices 1 and 2. Despite the shifts in preference, participants were not aware of the influence that the display format, summarized versus disaggregated, had on their decisions.
Table 3.
Mean Importance Weights for Three Areas of Performance
| Attribute | Choice 1 | Choice 2 |
|---|---|---|
| Importance of customer service | 19.1 | 18.7 |
| Importance of preventive medical care | 26.7 | 27.2 |
| Importance of treatment quality | 54.9 | 54.2 |
Discussion of Experiment IV
The results indicate that our participants had difficulty weighting various quality factors consistently in their decisions. Although participants believed that they were employing stable attribute weights across conditions, the different ways of summarizing or disaggregating information influenced choices.
Discussion
Results from the four experiments described here indicate that different approaches to the presentation of comparative performance information affected the interpretation and weighting of that information in consumer choices, even with very small changes in the presentation. The results also indicate that some presentation approaches made it easier for decision makers to process the information and to integrate quality data into choices. Specifically, providing visual cues in the presentation of data resulted in more selections of the higher performing plans, even though the higher performing plans cost more. Similarly, it appears that ordering plans by performance within cost strata resulted in more choices of the higher performing plans. Trend data appeared to be weighted more heavily in decisions when they were presented with explicit + and −. Finally, as shown in the summarizing experiment (Experiment IV), consumers had difficulty weighting performance indicators consistently in their choices. Moreover, consumers were not aware of the influence that the display format had on their decisions.
These experiments begin to investigate questions of the evaluability of different data display approaches. There are many other key questions to address, including whether the data display approaches used in current report cards are evaluable and how they may introduce bias into the current decision process. The results reported here are based on experiments with highly educated, employed adults. Older people, such as Medicare beneficiaries, or people with less education or financial resources may respond to these decision tasks differently and may need different displays to support their decision making. Research that focuses specifically on how older people and other special populations process and integrate information into decisions is needed. Furthermore, the extent to which controlled experiments capture actual behavior in the more complex “real world” needs to be examined.
Study Limitations
Using an experimental research design allows for an examination of outcomes when the information remains constant, and only the presentation format varies. The design provides a high degree of internal validity. However, the information that participants used to make decisions and the decisions themselves were contrived to address the research questions and only partially mirror real-world decisions. Controlled experiments may not capture actual behavior. Consumers may base their decisions on what they know about the plans in their market, and other factors (not included in the experiments) may influence their choices. However, laboratory experiments can help inform information disseminators about how to present information. Nonetheless, the lab is only the first step. Approaches that are tested in the lab can then be taken into real-world settings and tested in demonstrations or evaluations.
Similarly, the findings do not address all of the barriers to the use of comparative reports. Consumers may still choose to never look at them at all. Improving the presentation format to make them easier to use may not solve this very basic problem. It is possible that improvements in ease of use may entice more consumers to use report cards.
The use of a convenience sample raises the question of the generalizability of the findings. The cognitive processes that produced the effects have been observed in other studies examining a wide range of individuals and diverse array of decision tasks. They are thus considered fundamental to the way that human beings think and process information. Thus, there is no reason to believe that the effects observed in this sample would vary widely from those observed in any other employed sample. The higher educational levels of the study sample, if it has any effect, would likely be to reduce the impact of presentation format variations on choices. Those with more education may be less susceptible to the influence of changed presentation formats.
Policy Implications
One clear implication of these findings is that we can probably influence consumers to give more weight to quality information in their health plan choices. However, another implication of the findings is that every change we make in the presentation of comparative data may influence the resulting decision. The findings are consistent with the theory of constructed preferences (Slovic 1995).
Until now, the health services research community has viewed its responsibility as providing consumers with valid information so that consumers can make choices that fit their individual needs and preferences. These findings suggest that this community may actually have a different and greater responsibility. Because whatever we do appears to influence people (whether we are conscious of it or not), we have a responsibility to be aware of how we use that influence and to direct it in productive and defensible ways. The alternative is to manipulate people in ways that are unknown and are not thought out or are not defensible, but are no less manipulative.
In the area of health plan choice, we have at least two key goals: to help consumers choose better health care and to improve the overall delivery of medical care. If people cannot differentially weight factors according to their personal values, as we observed in the summarizing experiment, then we should not present comparative information that shows less important measures along with measures that are critically important. Consumers may weight all of them about equally, even if they think they are differentially weighting them.5 Moving to computer-aided decision tools could reduce this problem.
Consistent with our findings, there is an emerging awareness in other arenas of the need to take responsibility for the influence that is inherent in presenting information and to be able to defend the presentations (Hanson and Kysar 1999a, 1999b). Clearly, this has implications for the presentation of other types of health and health care information to consumers. For example, MacLean (1991) points out that physicians cannot escape their responsibilities by turning decisions over to patients. By framing both the decision and the information they provide, physicians are inevitably shaping their patients’ preferences and choices.
If we accept this need to exercise influence consciously, then we should consider what types of influence are justifiable. Given the need to increase consumers’ use of certain information, five areas of explicit influence might be considered.
First, it seems defensible to use presentation approaches that will help consumers weight performance quality more highly in their choices (e.g., by ordering attributes and through the use of visual cues). This would increase agreement between consumers’ actual decisions and their explicitly desired weighting policies.
Second, presenting graded standards of performance (e.g., unacceptable, acceptable, and excellent performance) for each indicator would likely be more evaluable than the relative approach now used. Graded performance information, although more evaluable, would require the use of expert judgment or consensus to determine these grades.
Third, we know that the amount of information presented to consumers can be a barrier to its use. However, we observed that when we summarize multiple indicators into fewer measures, we bias the way that this information is weighted and used in decisions. This suggests that we should present only indicators that are of high importance (e.g., all strongly linked to health outcomes). Expert consensus can be used along with the use of consumer values and preferences in determining priority performance indicators for inclusion in reports. We could defend this exercise of influence, first in determining that the high importance indicators should be strongly linked to health outcomes and second in determining what these few key indicators should be. Summarizing data simply as a way to reduce the information-processing burden on consumers is harder to justify.
The difficulties found in weighting various quality measures consistently imply that the common practice of providing several different quality measures in a single report to serve the interests of multiple subgroups in the population may be counterproductive. Instead, there is a need to guide consumers with special health problems or situations to the key performance indicators that are most important for their needs.
Finally, given the potential to manipulate, consumers need protection from both unscrupulous and naive purveyors of information. For example, an employer could unknowingly “simplify” the information and skew choice in one direction or another. A health plan could manipulate prospective enrollees by displaying comparative data in a format that provides their plan with an advantage relative to other plans. Standardization in how comparative performance is presented would provide an element of protection. Any bias that was inherent in the data-display approach would at least be known. Again, experts, in consultation with consumers, could determine what data displays and inherent biases are acceptable.
The conscious exercise of influence by the information disseminators does not negate the consumer's role in choosing. It simply recognizes the limitations of human judgment and decision making and provides information in ways that strive to result in the achievement of both individual and social goals.
Much effort and resources go into the collection of performance data, and we are just beginning to learn about how the approaches used in presenting those data influence how it is interpreted and used. Just as we are concerned about having valid data to share with consumers and purchasers, we need to be equally concerned that the information be used reasonably. The results from this investigation suggest that there are approaches that will help consumers use the available information more effectively in decisions. Our findings also highlight the need for information disseminators to understand and take responsibility for the influence they have in framing and presenting comparative quality information.
Acknowledgments
We would like to thank the Robert Wood Johnson Foundation's Changes in the Health Care Financing and Organization's initiative for supporting this work. The authors acknowledge Jacquelyn Jewett, Steve Johnson, Donald MacGregor, C. K. Mertz, and Martin Tusler for their contributions to the design of this research, data collection, and data analysis. We also acknowledge two anonymous reviewers for their constructive comments on the manuscript.
Notes
1. Prior to beginning the task, all participants received the following general instructions: “Please choose between five HMOs that differ only in terms of their monthly costs to you and the quality of care they provide their members.” HMO members rated their HMO on survey questions about the quality of treatment they had received.
2. Our definition of a “quality-maximizing choice” is the 2selection of the highest performing available plan within a cost stratum. Performance is based solely on the satisfaction ratings shown in Figure 2.
3. Because of the similarity in their satisfaction ratings, we considered plans B and J as equivalent to plan H and plans N and I as equivalent to plan F.
4. The instructions read as follows: “Please indicate the relative importance of each attribute in determining your preferences by dividing 100 points between the three components. For example, if you think you gave 50% of the weight to one particular component, give it 50 points, then distribute the remaining 50 points to the other two components. Use any values as long as they sum to 100.”
5. If the different measures of quality are positively intercorrelated, equal weighting may not be a serious problem (Dawes and Corrigan 1974). However, if the intercorrelations approach zero or are sometimes negative, the outcome on an equal weighting strategy diverges greatly from what differential weighting would yield.
References
- Birnbaum M. “Testing Critical Properties of Decision Making on the Internet.”. Psychological Science. 1999;10:399–407. [Google Scholar]
- Chernew M, Scanlon DP. “Health Plan Report Cards and Insurance Choice.”. Inquiry. 1998;35:9–22. [PubMed] [Google Scholar]
- Dawes RM, Corrigan B. “Linear Models in Decision Making.”. Psychological Bulletin. 1974;81:95–106. [Google Scholar]
- Hanson JD, Kysar DA. “Taking Behavioralism Seriously: Some Evidence of Market Manipulation.”. Harvard Law Review. 1999a;112:1420–572. [PubMed] [Google Scholar]
- Hanson JD, Kysar DA. “Taking Behavioralism Seriously: The Problem of Market Manipulation.”. New York University Law Review. 1999b;74:630–749. [PubMed] [Google Scholar]
- Hibbard JH, Jewett JJ. “Will Quality Report Cards Help Consumers?”. Health Affairs. 1997;16(3):218–28. doi: 10.1377/hlthaff.16.3.218. [DOI] [PubMed] [Google Scholar]
- Hsee CK. “Elastic Justification: How Tempting but Task-Irrelevant Factors Influence Decisions.”. Organizational Behavior and Human Decision Processes. 1995;62:330–7. [Google Scholar]
- Hsee CK. “The Evaluability Hypothesis: An Explanation for Preference Reversals between Joint and Separate Evaluations of Alternatives.”. Organizational Behavior and Human Decision Processes. 1996;67:247–57. [Google Scholar]
- Hsee CK. “Less Is Better; When Low-Value Options Are Valued More Highly than High-Value Options.”. Journal of Behavioral Decision Making. 1998;11:107–21. [Google Scholar]
- Jewett JJ, Hibbard JH. “Comprehension of Quality Care Indicators: Differences Among Privately Insured, Publicly Insured, and Uninsured.”. Health Care Financing Review. 1996;18:75–94. [PMC free article] [PubMed] [Google Scholar]
- Knutson DJ, Kind EA, Fowles JB, Adlis S. “Impact of Report Cards on Employees: A Natural Experiment.”. Health Care Financing Review. 1998;20:5–27. [PMC free article] [PubMed] [Google Scholar]
- Lin S. Eugene, OR: University of Oregon; 1999. “Sign Theory: A Theory of Preference Construction.”. [Dissertation]. [Google Scholar]
- MacLean D. A Critical Look at Informed Consent. Catonsville, MD: University of Baltimore County; 1991. Unpublished manuscript. [Google Scholar]
- McGee J, Kanouse DE, Sofaer S, Hargraves JL, Hoy E, Kleimann S. “Making Survey Results Easy to Report to Consumers: How Reporting Needs Guided Survey Design in CAHPS.”. Medical Care. 1999;37(3 Suppl):MS32–40. doi: 10.1097/00005650-199903001-00004. MS106–15. [DOI] [PubMed] [Google Scholar]
- Russo JE, Krieser G, Miyashita S. “An Effective Display of Unit Price Information.”. Journal of Marketing. 1975;39:11–9. [Google Scholar]
- Sainfort F, Booske BC. “Role of Information in Consumer Selection of Health Plans.”. Health Care Financing Review. 1996;18(1):31–54. [PMC free article] [PubMed] [Google Scholar]
- Scanlon DP, Chernew M. “HEDIS Measures and Managed Care Enrollment.”. Medical Care Research and Review. 1999;56(2 Suppl):60–84. [PubMed] [Google Scholar]
- Scanlon DP, Chernew M, McLaughlin CG. Chicago, IL: Presented at the Annual Conference, Association for Health Services Research; 1999. “Employee Response to Health Plan Performance Ratings.”. [Google Scholar]
- Scanlon DP, Chernew M, Sheffler S, Fendrick AM. “Health Plan Report Cards: Exploring Differences in Plan Ratings.”. Journal on Quality Improvement. 1998;24(1):5–20. doi: 10.1016/s1070-3241(16)30355-8. [DOI] [PubMed] [Google Scholar]
- Slovic P. “The Construction of Preference.”. American Psychologist. 1995;50:364–71. [Google Scholar]
- Spranca M, Kanouse DE, Elliott M, Short PF, Farley DO, Hays RD. “Do Consumer Reports of Health Plan Quality Affect Health Plan Selection?”. Health Services Research. 2000;35(5 Pt 1):933–47. [PMC free article] [PubMed] [Google Scholar]