Protein synthesis proceeds vectorially in the cell, from N- to C-terminus. Deciphering the parameters governing formation of autonomous native-like structure as a function of chain elongation is a fundamental, yet poorly explored, aspect of protein folding. Due to the slow rates of translation relative to folding,1 nascent polypeptides belonging to small single-domain proteins are likely to sample all the physically accessible conformational space during chain elongation. Therefore, the intrinsic conformational trends of N-terminal chains of different length, in isolation from effects due to the complex cellular environment, are a key starting point for understanding the forces supporting the generation of independent native-like status as proteins are born.
Shortly after the discovery of the vectorial nature of ribosome-assisted translation, Phillips suggested that the N-terminal nascent chains may start folding during biosynthesis.2 As a response to this, Taniuchi and Anfinsen reported that no native-like conformation is detected for the N-terminal fragments of the 149-residue protein staphylococcal nuclease (SNase) until the chain extends beyond 126 residues.3 In addition to these and other pioneering efforts on SNase,4-7 systematic analysis of structure evolution as a function of chain elongation has been carried out for only three other proteins to date, that is, barnase (Bar),8 chymotrypsin inhibitor 2 (CI2),9-13 and apomyoglobin (ApoMb).1,14 Although N-terminal fragments from the above proteins have significantly different behaviors in terms of short-range order and degree of misfolding, they all display little or no native-like tertiary structure until the chain is nearly complete.
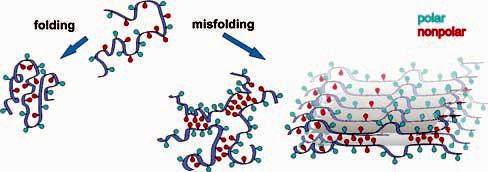
The hydrophobic effect,15-17 leading to the preferential burial of nonpolar surface in aqueous solution, is a major driving force for chain compaction and folding (Figure 1). We show here that this effect plays a seminal role in dictating the progressive generation of native-like structures at late stages of chain elongation.
Figure 1.

Cartoon illustrating the burial of nonpolar groups away from water upon protein folding and misfolding. The blue and red colors denote polar and nonpolar surfaces, respectively.
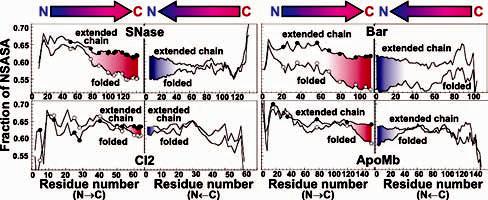
In case the polypeptide chain were to adopt native-like topology at all chain lengths, residues normally buried in the hydrophobic core of a protein would become solvent-exposed as a result of C-terminal amino acid truncations. The hydrophobic effect predicts that a polypeptide chain with a high degree of solvent-exposed nonpolar residues acquires a driving force to bury the nonpolar surface either intra- and/or intermolecularly. This was shown to take place experimentally for N-terminal apoMb fragments of different chain lengths.1 To what extent are the above hypotheses able to predict the experimentally observed chain lengths leading to formation of native-like structure? To test this, we investigated the effect of chain truncation on the exposure of nonpolar solvent-accessible surface area (NSASA) for two limiting hypothetical cases: (a) unfolded state, represented as a fully extended chain, and (b) native-like folded state. The fractions of NSASA calculated for these two cases are displayed in Figure 2 for the four proteins whose experimental behavior is known.
Figure 2.

Fraction of nonpolar solvent-accessible surface area (NSASA) as a function of chain elongation for extended and native-like folded conformations of SNase, Bar, CI2, and ApoMb. The circles indicate chain lengths previously investigated experimentally. The program SurfaceRacer18 was used for calculating NSASA values. Coordinate files for extended chains were created with the software InsightII.
For all four proteins, NSASA does not significantly vary with chain length in the unfolded state. Values for full-length chains range between 0.61 and 0.64. The folded state, however, displays a more rapid decrease in the fraction of NSASA, as chain elongation approaches its completion (red shaded areas in Figure 2). This indicates that native-like topology leads to the selective preferential burial of nonpolar surface at longer chain lengths. This is in remarkable agreement with the experimental data, which show that populating compact native-like structures becomes favorable only as the last C-terminal residues are incorporated into the polypeptide. As chain elongates, the relatively flat free energy landscape of shorter chains becomes sharply tuned. The above clear-cut trend highlights the fact that the last C-terminal residues are very important to channel a protein structure toward its native-like topology. We carried out the same calculations in the opposite direction, from C- to N-terminus. The rough symmetry between the N f C and C f N plots (Figure 2) indicates that the optimal burial of nonpolar surface at late elongation stages has no directional preference. Therefore, achieving autonomous native-like topology is unlikely to have been a determinant factor for the development of the N f C directionality of ribosome-assisted translation, over the course of evolution.
The ApoMb N-terminal polypeptides have strikingly different properties from those of the corresponding incomplete chains of the other three proteins. All the examined ApoMb peptides misfold and self-associate in solution. ApoMb is 100% R-helical. Therefore, β-strand formation serves as a convenient probe for misfolding.1 The fraction of β-strand and self-association correlates with the extent of chain truncation. In contrast, the fragments from the other proteins are soluble and display little or no misfolding.
Nature has devised strategies to assist proper folding and backup methods for peptide degradation in case of misfolding. Just as protein native structure is encoded by amino acid sequence, the conformational behavior of the N-terminal fragments is determined by their amino acid sequence, in any given environment. The physical properties of a polypeptide sequence correlate with aggregation rates under specific experimental conditions.19 Figure 2 shows that, for chain lengths disfavoring the native-like burial of nonpolar surface (i.e., all chains shorter than the red areas in Figure 2), the global nonpolar character expresses the chain's likelihood to aggregate.
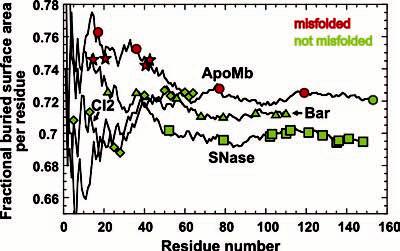
The overall nonpolar nature at given chain lengths was computed as a fraction of surface area buried upon folding per residue (FBA), via the hydrophobicity scale by Rose.17 This parameter is based on the average buried surface for each residue type, evaluated from the protein structures deposited in the databank. In general, the scores for apoMb are higher than those of the other proteins, at most chain lengths. The hydrophobic region of residues 28-40 in CI2 causes significantly high FBA values for this protein. The N-terminal fragments containing this region are known to display conformational heterogeneity and a tendency to self-associate9-13 (Figure 2). ApoMb's residues corresponding to the nonpolar N-terminal helices A and B are responsible for the high hydrophobicity at short chain lengths. ApoMb has two additional local maxima at longer chain lengths (close to residues 75 and 115). Fragments corresponding to these regions were investigated experimentally and found to misfold and self-associate. Hence, the FBA of N-terminal polypeptides correlates with their experimentally observed tendency to misfold (Figure 3), at chain lengths preceding the engagement of the dominant driving forces for intramolecular folding (Figure 2).
Figure 3.

Fraction of surface area buried upon folding per residue (FAB) according to Rose,17 calculated as a function of chain elongation for the amino acid sequences of SNase, Bar, CI2, and ApoMb. The red and green symbols denote chain lengths investigated experimentally. The stars correspond to scores for peptides known to form amyloid-like species.
As an additional test, we calculated FBA for peptides known to misfold and form amyloid fibrils (i.e., amyloid-β(1-40) and (1-42), prion protein(106-126), and AChE peptide). The results are displayed as red stars in Figure 3. The scores for these peptides correlate with their tendency to bury a large fraction of surface area, with resulting self-association. We found that amyloidogenic peptides forming disulfide bridges do not obey the above trend, perhaps due to additional structural constraints. It is worth noting that the rate of formation and detailed molecular structure of amyloid fibrils are also influenced by parameters such as charge state20 and shape complementarity. On the other hand, the FBA parameter appears sufficient, albeit not always necessary, for predicting misfolding leading to either amorphous or structured aggregates.
In summary, we have shown that the major hydrophobic driving forces for native-like structure formation occur preferentially at late chain lengths. This trend can be effectively predicted, even in the absence of matching experiments, provided that the structure of the full length protein is known. While this property was demonstrated here for a small set of proteins whose chain elongation has been studied experimentally, this is likely a general phenomenon applicable to other proteins. At chain lengths bearing no significant driving forces for native-like structure formation, FBA values greater than ca. 0.73 support misfolding and aggregation. This implies that the support machinery of the cell is likely most needed for solvent-exposed N-terminal segments with FBA > 0.73. Co-translationally active chaperones are likely to be necessary here, to prevent the deadly consequences of co-translational misfolding.21,22
Supporting Information Available
Methods for calculating NSASA and FBA; sequences and FBA of amyloidogenic peptides as a function of chain length. This material is available free of charge via the Internet at http://pubs.acs.org.
Supporting Information
Acknowledgment
This work was supported by the National Institutes of Health (Grant GM068535-01A1), Research Corporation (Research Innovation Award to S.C.), and Milwaukee Foundation (Shaw Scientist Award to S.C.).
References
- 1.Chow CC, Chow C, Rhagunathan V, Huppert T, Kimball E, Cavagnero S. Biochemistry. 2003;42:7090–7099. doi: 10.1021/bi0273056. [DOI] [PubMed] [Google Scholar]
- 2.Phillips DC. Proc. Natl. Acad. Sci. U.S.A. 1967;57:483–495. [Google Scholar]
- 3.Taniuchi H. J. Biol. Chem. 1970;245:5459–5468. [PubMed] [Google Scholar]
- 4.Shortle D, Meeker AK. Biochemistry. 1989;28:936–944. doi: 10.1021/bi00429a003. [DOI] [PubMed] [Google Scholar]
- 5.Flanagan JM, Kataoka M, Shortle D, Engelman DM. Proc. Natl. Acad. Sci. U.S.A. 1992;89:748–752. doi: 10.1073/pnas.89.2.748. [DOI] [PMC free article] [PubMed] [Google Scholar]
- 6.Evans PA, Kautz RA, Fox RO, Dobson CM. Biochemistry. 1989;28:362–370. doi: 10.1021/bi00427a050. [DOI] [PubMed] [Google Scholar]
- 7.Jing G, Zhou B, Xie L, Li-jun L, Liu Z. Biochim. Biophys. Acta. 1995;1250:189–196. doi: 10.1016/0167-4838(95)00073-4. [DOI] [PubMed] [Google Scholar]
- 8.Neira JL, Fersht AR. J. Mol. Biol. 1999;287:421–432. doi: 10.1006/jmbi.1999.2602. [DOI] [PubMed] [Google Scholar]
- 9.de Prat Gay G. Arch. Biochem. Biophys. 1996;335:1–7. doi: 10.1006/abbi.1996.0475. [DOI] [PubMed] [Google Scholar]
- 10.de Prat Gay G, Fersht AR. Biochemistry. 1994;33:7957–7963. doi: 10.1021/bi00191a024. [DOI] [PubMed] [Google Scholar]
- 11.de Prat Gay G, Ruiz-Sanz J, Davis B, Fersht AR. Proc. Natl. Acad. Sci. U.S.A. 1994;91:10943–10946. doi: 10.1073/pnas.91.23.10943. [DOI] [PMC free article] [PubMed] [Google Scholar]
- 12.de Prat Gay G, Ruiz-Sanz J, Neira JL, Corrales FJ, Otzen DE, Ladurner AG, Fersht AR. J. Mol. Biol. 1995;254:968–979. doi: 10.1006/jmbi.1995.0669. [DOI] [PubMed] [Google Scholar]
- 13.de Prat Gay G, Ruiz-Sanz J, Neira JL, Itzhaki LS, Fersht AR. Proc. Natl. Acad. Sci. U.S.A. 1995;92:3683–3686. doi: 10.1073/pnas.92.9.3683. [DOI] [PMC free article] [PubMed] [Google Scholar]
- 14.Reymond MT, Merutka G, Dyson HJ, Wright PE. Protein Sci. 1997;6:706–716. doi: 10.1002/pro.5560060320. [DOI] [PMC free article] [PubMed] [Google Scholar]
- 15.Chothia C. J. Mol. Biol. 1976;165:1–14. doi: 10.1016/0022-2836(76)90191-1. [DOI] [PubMed] [Google Scholar]
- 16.Tanford C. The Hydrophobic Effect: Formation of Micelles and Biological Membranes. 2nd Wiley; New York: 1980. [Google Scholar]
- 17.Rose GD, Geselowitz AR, Lesser GJ, Lee RH, Zehfus MH. Science. 1985;229:834–838. doi: 10.1126/science.4023714. [DOI] [PubMed] [Google Scholar]
- 18.Tsodikov OV, Record MT, Sergeev YV. J. Comput. Chem. 2002;23:600–609. doi: 10.1002/jcc.10061. [DOI] [PubMed] [Google Scholar]
- 19.DuBay KF, Pawar AP, Chiti F, Zurdo J, Dobson CM, Vendruscolo M. J. Mol. Biol. 2004;341:1317–1326. doi: 10.1016/j.jmb.2004.06.043. [DOI] [PubMed] [Google Scholar]
- 20.Massi F, Klimov D, Thirumalai D, Straub JE. Protein Sci. 2002;11:1639–1647. doi: 10.1110/ps.3150102. [DOI] [PMC free article] [PubMed] [Google Scholar]
- 21.Hartl FU, Hayer-Hartl M. Science. 2002;295:1852–1858. doi: 10.1126/science.1068408. [DOI] [PubMed] [Google Scholar]
- 22.Bukau B, Horwich AL.Cell 199892351–366.JA0560682 [DOI] [PubMed] [Google Scholar]
Associated Data
This section collects any data citations, data availability statements, or supplementary materials included in this article.


