Abstract
Zero mode waveguides (ZMWs), subwavelength optical nanostructures with dimensions ranging from 50 to 200 nm, have been used to study systems involving ligand-receptor interactions. We show that under proper conditions, lipid membranes will invaginate into the nanostructures, which confine optical excitation to subattoliter volumes. Fluorescence correlation spectroscopy (FCS) was used to characterize the diffusion of fluorescently tagged lipids in liquid-disordered phase 1-palmitoyl-2-oleoyl-sn-glycero-3-phosphocholine (POPC) and gel phase 1,2-distearoyl-sn-glycero-3-phosphocholine (DSPC) membranes incubated on the nanostructured surface. In contrast to the POPC, DSPC membranes did not appear to enter the structures, suggesting that invagination is dependent on membrane rigidity. Although correlation curves obtained from POPC membranes conformed to previously derived models for diffusion in the evanescent field within the nanostructure, the diffusion constants obtained were systematically lower than expected. The validity of the one-dimensional diffusion model for membrane diffusion is discussed and it is concluded that the erroneous diffusion constants are a result of nontrivial membrane conformation within the ZMWs. Additionally, FCS was used to characterize the fraction of fluorescently labeled tetanus toxin C fragment bound to a ganglioside-populated POPC membrane within the ZMWs. This allowed the determination of the toxin's equilibrium binding constant at a concentration of 500 nM; higher than possible with diffraction-limited FCS. To our knowledge, the results presented here are the first reported for supported lipid bilayers in nanostructured devices. Furthermore, they open the possibility of studying membrane imbedded receptors and proteins at physiological concentrations with single-molecule resolution.
INTRODUCTION
Lipid membranes play critical roles in the interactions between living cells and their environment. Membrane proteins, ion channels, and lipid-based receptors are essential in the uptake of cellular nutrients, control of ion concentration gradients, and receptor-mediated signaling. A complete understanding of cellular function will depend on the elucidation of the interactions and behavior of this rich biophysical system.
A rigorous theoretical framework has been developed to describe the mechanical and morphological properties of lipid membranes. Theories governing the conformation of both free (forming closed vesicles) and supported (physically adsorbed to a surface) membranes have been developed (1). The interactions between multiple lipid structures (2–5) as well as the formation of supported lipid bilayers by vesicle fusion onto solid substrates have been studied (6–10). To gain insight into the formation and behavior of lipid rafts, these theories have been extended to include the behavior of heterogeneous membranes: lipid mixtures containing membrane proteins and binding structures that exhibit complex intramembrane domain and phase separation(1,11–13).
Among the tools used for characterizing lipid membranes, fluorescence correlation spectroscopy (FCS) has proved particularly useful. Fluorescence from individual fluorescently tagged molecules passing through a well-defined observation volume can be recorded, autocorrelated, and fit to an analytical model to obtain transport information about the system being studied. This technique has been applied to obtain diffusion coefficients from fluorescent probes in a variety of membranes (14–16). Other FCS experiments have been performed to study phase separation and its effects on transport in membranes (17–21). A number of other techniques have also been applied to lipid systems including fluorescence recovery after photobleaching, fluorescence light interference contrast, total internal reflection fluorescence, and fluorescence microscopy (22–24). These techniques are united by an inherent physical restriction: the diffraction limit of light. Because optical observation volumes cannot be reduced far beyond the diffraction limit, the concentration of fluorescently tagged species must be kept relatively low for single-molecule techniques such as FCS. In practice, diffraction-limited volumes are on the order of several femtoliters, limiting fluorescent molecule concentrations to the pico and nanomolar regimes. Because the binding constants for most ligand-receptor interactions exceed this range, the extent of biological systems that can be studied is greatly restricted (25). In addition to working at higher concentrations, there are a number of lipid research areas that stand to benefit from subdiffraction limit resolution spectroscopic techniques.
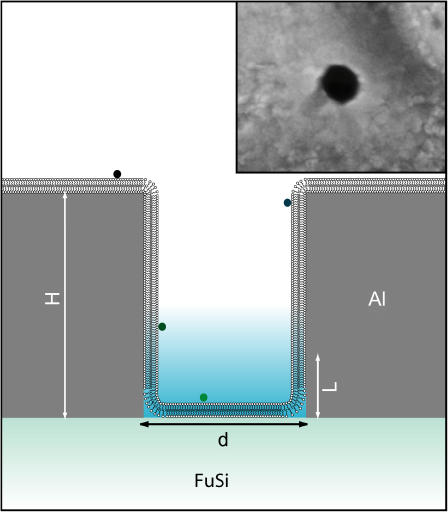
Zero mode waveguides (ZMWs), subwavelength optical nanostructures, have been demonstrated as devices for focal volume confinement (25,26). They exhibit no propagating optical modes, resulting in a confined evanescent field at the bottom of the structure (Fig. 1). As shown in previous work, ZMWs provide observation volumes in the atto to zeptoliter range and hence allow single-molecule techniques to function at micromolar concentrations(25,26). Here we characterize the behavior of lipid bilayers in ZMWs. Previous studies suggest that lipid membranes will coat micropatterned surfaces but will sometimes avoid sudden nanometer sized obstacles (27–31).
FIGURE 1.
Lipid bilayer membranes are thought to coat the surface of the zero mode waveguides. The structures are characterized by a diameter, typically between 50 and 200 nm; a height, ∼100 nm; and a characteristic evanescent decay length that ranges from 15 nm for small structures to more than 35 nm for larger ones. These experiments used fluorescently labeled lipid DHPE-Oregon Green and tetanus toxin-Alexa488 as fluorescent probes. The fluorophores are only excited and detected when near the bottom of the structure, in the evanescent field, providing a focal volume on the order of a few tens of zeptoliters. The zero mode waveguides are illuminated from the bottom by a microscope in epi-illumination mode. (Inset) Scanning electron micrograph of a zero mode waveguide.
The results presented here provide evidence that some membranes will invaginate and coat nanoscale holes in a metal film. Liquid-disordered phase lipid bilayers containing a small fraction of fluorescently labeled lipid were incubated in ZMWs. The autocorrelation curves obtained from these systems fit the model previously derived for diffusion in the evanescent field near the bottom of a ZMW (25). Gel phase lipids were incubated in similar structures and were found to exhibit significantly less fluorescence than the liquid phase samples. This is due to the radical difference in excitation and detection efficiency between the top and bottom of the waveguides (26) and suggests that the gel phase lipids failed to enter the nanostructures. The study of lipid membrane behavior in such nanoscale wells can yield insight into membrane flexibility and its role in cell motility through filipodia. To further demonstrate the utility of ZMWs in examining complex biosystems, they were used to determine the equilibrium binding constant between tetanus toxin C fragment (TTC) and the GT1b ganglioside at high TTC concentration. Conventional biochemical techniques for measuring equilibrium binding constants include centrifugation and equilibrium dialysis as well as fluorometry. Compared to these techniques, FCS in ZMWs requires little reagent and experiments can be performed in minutes as opposed to hours or days. These results suggest that ZMWs are suitable structures to study the interactions between membrane-based receptors or proteins and freely diffusing ligands at the single-molecule level.
SAMPLE PREPARATION AND EXPERIMENTAL SETUP AND PROCEDURE
Instrumentation
FCS autocorrelation curves were acquired using a confocal fluorescence microscope in epi-illumination mode. Fluorescence was induced using a Coherent Sapphire laser (model 488–02 CDRH, Santa Clara, CA) producing a maximum of 50 mW at 488 nm. The laser was passed through an excitation filter (Chroma Z488/10X, Rockingham, VT) and linear polarizer (Newport, Irvine CA) to condition the beam. Fluorescence was collected through a dichroic mirror (Chroma Z488RDC) and an emission filter (Chroma AF 535/45). A coverslip corrected 60×, 1.2 numerical aperture water immersion objective was used on an Olympus (Melville, NY) IX71 microscope. Fluorescence was then coupled to an avalanche photodiode (SPCM-AQR-14-FC, PerkinElmer, Fremont, CA) via a 50 μm core fiber optic patch cord. A flex02-12D correlator card (correlator.com, Bridgewater, NJ) was used to calculate FCS autocorrelation curves with a resolution less than 13 ns, and a PC was then used to acquire and record the intensity trace and correlation function. A power meter was used to monitor laser power, and a set of neutral density filters (Chroma) was used to maintain an incident beam power of ∼100 μW.
Zero mode waveguides
ZMW arrays were fabricated in a thin but opaque layer of aluminum deposited on a 170 μm thick fused silica coverslips. Film thicknesses were measured at the time of evaporation by the crystal monitor and again later by a profilometer. Measurement indicated a film thickness of 104 ± 1 nm. Electron beam lithography and metal liftoff were used to create a variety of hole sizes. After fabrication, the ZMWs were attached to 6 μL polydimethylsiloxane wells, and a low power oxygen plasma was used to condition the surface. After a sample was placed in a well, it was sealed using a glass slide. The diameters of the ZMWs, measured by scanning electron microscopy, varied between 70 and 150 nm.
Preparation of lipid vesicles
Small unilamellar vesicles (SUVs) were prepared by point probe sonication. Lipids 1-palmitoyl-2-oleoyl-sn-glycero-3-phosphocholine (POPC) and 1,2-distearoyl-sn-glycero-3-phosphocholine (DSPC) were purchased from Avanti Polar Lipids (Alabaster, AL). Fluorescently labeled lipid Oregon Green 488 1,2-dihexadecanoyl-sn-glycero-3- phosphoethanolamine (DHPE-Oregon Green (OG)) was purchased from Molecular Probes (Eugene, Oregon). Trisialo-ganglioside GT1b was purchased from Sigma-Aldrich (Saint Louis, MO). Recombinant TTC was purchased from Roche Diagnostics (Indianapolis, IN). TTC was labeled using a commercially available Alexa488 protein labeling kit from Molecular Probes (Carlsbad, CA, catalog No. A-10235).
Lipids were mixed in the appropriate ratios from stock solutions in chloroform to yield a final concentration of 1 mM when resuspended in the working buffer. Then, chloroform was evaporated under a dry nitrogen stream, to obtain a uniform lipid film. The lipids were rehydrated in 10 mM PBS pH 7.4 at room temperature. To obtain SUVs, the resuspended lipids were point-probe sonicated for 1 h in a thermal bath at room temperature. All samples were stored at 4°C and bath sonicated for 30 min before incubation with the nanostructures.
Samples prepared for lipid bilayer formation consisted of POPC/DHPE-OG dye at 99.99:0.01 molar ratio. Control sample for a gel-phase lipid consisted of DSPC/DHPE-OG at 99.99:0.01 molar ratio. Bilayers used for toxin binding consisted of POPC/GT1b at 95:5 molar ratio.
Experimental procedure
ZMWs were washed with acetone and 2-propanol and dried under a nitrogen stream. The structures were exposed to a low power oxygen plasma for 60 s to condition the surface and bleach any residual fluorescent contaminants. Lipid bilayers were formed by incubating the vesicles for 30 min in the waveguides. FCS curves were taken immediately after the incubation for the POPC/DHPE-OG and DSPC/DHPE-OG membranes. Autocorrelation curves and fluorescence intensity traces were recorded. TTC kinetics were measured by incubating POPC/GT1b and POPC for 30 min in separate wells, removing the excess solution and replacing it with 500 nM TTC-Alexa488. The toxin was incubated with the lipid membranes for 30 min before acquisition of the correlation curves.
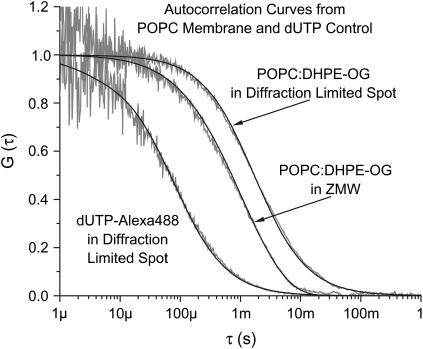
For the control experiments, the sample was illuminated by a diffraction-limited laser spot generated by overfilling the backside of the microscope objective used for data acquisition. The observation volume was characterized by taking correlation curves of freely diffusing dUTP-Alexa488, a fluorescent probe of known diffusivity (32) (2.1 × 10⁻⁶cm2/s). The dUTP correlation curves were fit to Eq. 10, a three-dimensional diffusion model accounting for excitation to nonradiative states, yielding a focal volume radius of 258 ± 5 nm. The fluorescently labeled DHPE molecules are constrained to diffuse in the plane of the membrane; hence, a model accounting for two-dimensional diffusion in a Gaussian observation volume is appropriate(33–35) (Eq. 9). Because the diffusion time for the DHPE-OG was orders of magnitude longer than the average time for excitation to a nonradiative state, the corresponding term in Eq. 10 was neglected. (Sample autocorrelation curves for freely diffusing dUTP and DHPE-OG molecules in the bilayer are shown in Fig. 3.)
FIGURE 3.
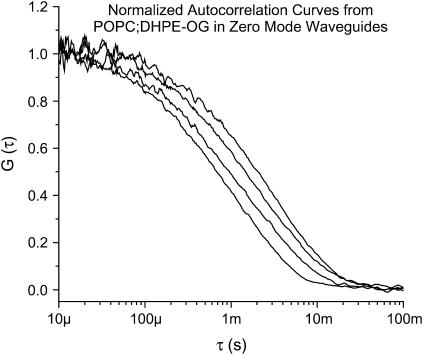
Normalized autocorrelation curves from POPC/DHPE-OG bilayers in ZMWs. The radius of the structure dictates the length of the evanescent decay and hence the diffusion time. Here, curves from four structures of different sizes are plotted showing the shift in diffusion time resulting from the differing evanescent decay lengths.
Data analysis
Quantitative values were extracted from the experimental correlation curves by fitting to a model function using a MATLAB (The MathWorks, Natick, MA) routine and the Levenberg-Mardquart algorithm. The diffusion curves for DHPE-OG in POPC and DSPC bilayers as well as the free TTC curves in the POPC-coated and uncoated ZMWs were fit to Eq. 7, a model assuming a single diffusing species. Three parameters were extracted: the diffusion constant (D), the intercept (G0), and the evanescent decay constant (L). Curves acquired for determination of the TTC binding constant had a short and long time component. For these curves, the sum of two ZMW model correlation functions, Eq. 8, was used resulting in five free parameters, the intercept for each species, the diffusion constant for each species, and the common decay factor.
FLUORESCENCE CORRELATION SPECTROSCOPY IN ZERO MODE WAVEGUIDES
FCS measures the transport properties of fluorescently labeled molecules as they pass through a well-characterized illumination field. Single molecules produce fluorescence bursts that are measured by a photodiode and converted to a current. The autocorrelation of this photocurrent contains information intimately tied to the geometry of the illumination profile and detection efficiency, as well as the concentration of fluorescent molecules and the transport properties of the system. The general form of the autocorrelation function is
 |
(1) |
where  is the spatial detectivity function describing the effective observation volume in space and
  is the concentration correlation function. The concentration correlation function is the probability a diffusing molecule moves from position
  to position
  in a time τ. 〈N〉 is the average number of molecules in the observation volume. In the following sections, the general application of Eq. 1 to diffusion on the surface of a ZMW will be discussed followed by exploration of a useful approximation. It has become apparent that although the general case is somewhat illuminating, it is not a mathematically tractable problem. The result is that no convenient closed form model autocorrelation function was found; a function that is needed for extraction of quantitative information through nonlinear curve fitting.
The general model
The prescription for finding a model FCS autocorrelation function is to choose a spatial detectivity function that comes close to describing the observation volume. Insert it into Eq. 1 and carry out the integrations. For some geometries, the integrations can be simplified by taking the functions to Fourier space. For the ZMWs, previous numerical modeling and experiments have shown that S is approximately constant in the transverse directions. Hence, the spatial detectivity function is assumed to have the following form on the surface of the structures:
 |
(2) |
This describes an evanescent decay in the axial direction combined with an angular function. The angular function is a constant for circularly polarized illumination but nonconstant for linearly polarized light. The integrations in Eq. 1 are taken over the surface of the ZMW yielding
 |
(3) |
The three terms account for when a molecule moves from 1), a point on the wall to another point on the wall, 2), a point on the bottom to another point on the bottom, and 3), a point on the wall to a point on the bottom. The factor of 2 in the last term reflects the symmetry of the integrand under interchange of starting and ending points. A number of simplifications are possible. In a cylindrical coordinate system, the kernel of the diffusion equation is not separable in r and θ. However, because r is constant (R) on the walls, the first term can be rewritten
 |
(4) |
where the first integral is the one-dimensional diffusion approximation that has been previously solved. The ZMW has cylindrical symmetry, hence, the spatial detectivity function is expected to be independent of the angle θ for circularly polarized excitation illumination. Under these circumstances, the second integral in Eq. 4 is a constant as is the second integral in Eq. 3. When the excitation illumination is linearly polarized and the dipole moments of the fluorophores are normal to the surface of the waveguide, then S(θ) ∝ cos2(θ), where θ is the angle of the fluorophore's dipole relative to the illumination polarization. The rotational correlation function has a characteristic time proportional to R2/D. Because the two correlation functions are multiplied, the one with the faster characteristic time will dominate the expression. The ratio of the axial diffusion time to the rotational diffusion time is smaller than L2/R2. For the rotational diffusion to impact the correlation function, this ratio must be >1. Although the exact relationship between L and R is the subject of ongoing research, it is clear that for ZMWs, this ratio is always <1. The rotational component is not expected to greatly impact the correlation curve. In fact, autocorrelation curves taken with linearly and circularly polarized light were not significantly different. The last two terms in Eq. 3 do not appear to be analytically solvable. Apart from the lack of a closed form solution, this approach suffers from other drawbacks. Particularly, the membrane is required to match exactly the shape of the ZMW, a shape that requires abrupt right angle bends at the top and bottom of the structures. Aside from not being a likely shape for a membrane of nanometric dimensions, this shape is not smooth at the bottom and top bends. The abrupt bends present mathematical difficulties when dealing with second-order differential equations such as the diffusion equation.
Diffusion on a continuous membrane
These difficulties can be removed by considering the physical shape of lipid bilayers in a small hole. ZMWs have radii on the order of the radius of small lipid vesicles. It seems unlikely that the bilayers will adsorb to the surface completely. Instead, the membrane will take on a shape that minimizes its free energy, thus balancing the impact of membrane curvature (which increases the relative energy) and surface adsorption (which reduces the relative energy). The membrane is expected to inherit the cylindrical symmetry of the waveguide it is in. Hence, for most structures it is reasonable to assume that the ZMW has no “bottom”, and instead the diffusion takes place on a continuous membrane with cylindrical symmetry and some complicated conformation. When this is the case, Eq. 3 is replaced by a simpler expression:
 |
(5) |
Furthermore, when the membrane shape has certain properties, Eq. 5 reduces to the one-dimensional diffusion case with a modified diffusivity. If the membrane does not adhere strictly to the side wall, and instead has some slope within the ZMW, the diffusion of a molecule along the membrane can be faster than its axial motion suggests. Because the spatial detectivity function varies primarily in the axial direction, the experiment detects only axial motion of the molecules. This results in an underestimation of the diffusion constant. This point along with a mechanism to correct the erroneous diffusion constants are explored further in Fig. 7 and the Results and Discussion section.
FIGURE 7.
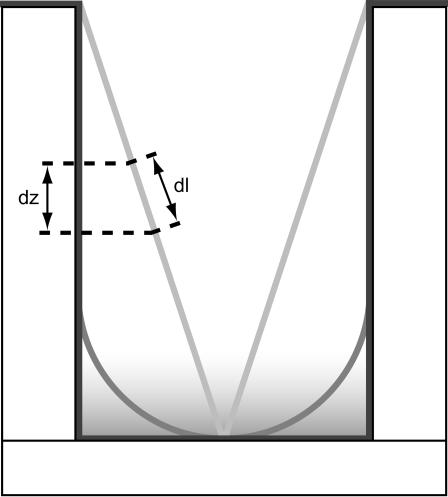
Lipid membranes may take on a number of conformations within the ZMWs. Shown here are three of those: (Dark shaded) The membrane coats the surface perfectly. (Shaded) The membrane takes on the cylindrical shape of the ZMW near the top but ends in a hemispherical cap. The membrane shown here has a radius of curvature equal to the radius of the ZMW. (Light shaded) A conical membrane. The membrane shape can influence the measurement of diffusion constants. As fluorophores travel a distance dl on the membrane, they move only a smaller distance dz in the axial direction. Because the spatial detectivity function in the ZMWs only changes in the axial direction, only movement in the axial direction can be detected experimentally. This results in the fluorophores appearing to move more slowly than they actually are, and hence, a depressed estimate of the diffusion constant.
The one-dimensional diffusion autocorrelation function is found by taking Eq. 1 to Fourier space
 |
(6) |
decreasing the total number of integrations required. As described previously (25,26), the autocorrelation function is given by
 |
(7) |
where L is the characteristic decay length, H is the waveguide height, and D is the diffusion constant. No analytic solution has been found for this integral. A system of two diffusing species that are statistically independent on the timescale of the experiment can be modeled by adding two single species curves together. The resulting expression is
 |
(8) |
where the two autocorrelation curves have identical values for the height, H, and the evanescent decay length, L.
Diffraction-limited FCS, used for the control experiments, assumes that the observation volume is Gaussian. Substituting a Gaussian spatial detectivity function into Eq. 1 yields (36)
 |
(9) |
for diffusion limited to a plane and (37)
 |
(10) |
for three-dimensional diffusion in an open volume. The diffusion time is τd is and the average number of diffusing molecules in the observation volume is N. The first term in Eq. 10 accounts for a fraction, F, of molecules excited to nonradiative states with long lifetimes. The characteristic time associated with this excitation is τb. The last term accounts for diffusion in the axial direction of the focal volume; Z is the ratio of the focal volume's half height to its radius.
RESULTS AND DISCUSSION
Membrane characterization
To explore the behavior of the lipid membranes on the nanostructured surfaces, both gel phase (DSPC) and liquid-disordered phase (POPC) lipid membranes were studied in the ZMWs. Lipid vesicles in the gel phase are not expected to fuse onto the substrate to form supported bilayers at temperatures below their main transition temperature, and hence they represent an excellent control to contrast against the behavior of the liquid phase POPC. Fluorescence correlation curves were taken to further assess the state of the membrane.
Fluorescence intensities were measured from both POPC and DSPC membranes incubated in the ZMWs. DSPC has a transition temperature of 55°C (38), far above the temperature the experiments were performed at and the average radii of the vesicles are expected to exceed the diameter of the ZMWs (39). As a result, the DSPC SUVs will not fuse to form a supported lipid bilayer and instead will remain as adsorbed vesicles at the top of the ZMWs. In contrast, the liquid disordered POPC will fuse to form a supported bilayer. The most persuasive evidence that the POPC was coating the inside surface of the structures came from the relative fluorescence intensities. The DSPC/DHPE-OG membrane produced a total count rate of ∼700 Hz with a background (dark count + reflected laser) of 200 Hz. In contrast, the POPC/DHPE-OG membrane produced an intensity of nearly 70 kHz; ∼2 orders of magnitude difference. The spatial detectivity function
 |
(11) |
describes the optical properties of the ZMWs. L, the characteristic decay of the spatial detectivity function, accounts for all photophysical phenomena in the waveguide. The observation volume is constrained by three processes: the subwavelength aperture generates an evanescent illumination profile, fluorescence is coupled out of the structures imperfectly, and fluorophores in a metal cavity have reduced photon emission rates (26). The FCS experiments for the invaginated membranes suggest that the decay parameter, L, has a value of ∼28 nm (Fig. 2). Taking into account the height of the structures, the spatial detectivity function is expected to drop by two orders of magnitude between the bottom and top of the waveguide. The expected change in the spatial detectivity function, taken with the difference in fluorescence intensities, support the notion that DSPC vesicles are resting on top of the waveguides with virtually no protrusion into the evanescent field. The higher fluorescence intensity from the POPC sample suggests that the membrane is being excited much more efficiently, and hence must be closer to the bottom of the structures. Additionally, no photobleaching was observed in the POPC membranes, indicating that the lipids in the ZMWs were connected to and freely exchanging fluorophores with a larger supported bilayer.
FIGURE 2.
Normalized autocorrelation curves from POPC/DHPE-OG and dUTP-Alexa488 in bulk and POPC/DHPE-OG in a ZMW. Curves are shaded with fits shown in black. (Left to right) dUTP-Alexa in a diffraction-limited volume, POPC/DHPE-OG in a zero mode waveguide and POPC/DHPE-OG in a diffraction-limited volume. A three-dimensional FCS model including a triplet component was used for the dUTP curve. The POPC curves were fit using the ZMW model or a two-dimensional FCS model as appropriate.
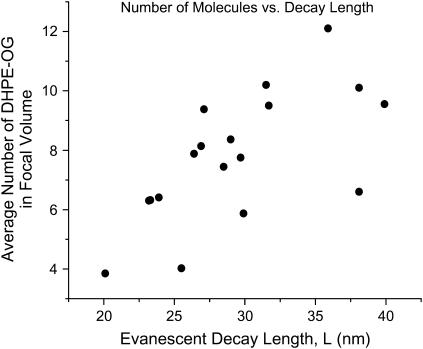
To further explore the behavior of the membranes, fluorescence correlation curves were taken from ZMWs of varying diameter incubated with POPC/DHPE-OG vesicles (Fig. 3). By fitting the correlation function to Eq. 7, the average number of fluorescent molecules in the observation volume (N), the evanescent decay constant (L), and the diffusion constant (D) were extracted. The average number of fluorophores should be related to the observation volume by the concentration of fluorescent lipid molecules. Structures with larger radii will have larger surface areas and a longer evanescent decay, admitting more bilayer within the effective observation volume, and hence, more fluorophores. As seen in Fig. 4, the average number of fluorophores in the focal volume exhibits an upward trend as a function of evanescent decay length; however, the trend has considerably more variation than expected. This variation could be due to differences in membrane conformation from structure to structure. Variation in radius, surface roughness, or aspect ratio as well as local conditions in the membrane may cause subtle variation in the membrane area within the evanescent field and thus variation in the apparent number of molecules present. Several theoretical and experimental studies have treated the problem of membrane flexibility and suggest that conformational coating of the nanostructures by the membrane is not guaranteed, especially with critical dimensions in the nanometer regime (1). It is also conceivable that some membranes will not reach entirely to the bottom of the structures, resulting in a smaller membrane area within the ZMW. Membrane conformation is addressed further in “Membrane conformation”, below.
FIGURE 4.
Average number of DHPE-Oregon Green molecules in several ZMWs was determined by fitting the autocorrelation functions. This number is plotted against the evanescent decay parameter. Each point represents one fit. Larger focal volumes admit larger membrane areas and hence more DHPE-OG molecules. As a result, the apparent upward trend is expected. The deviation from a linear relationship is probably due to the membrane's finite flexibility. Small differences in ZMW shape or surface chemistry may have caused incomplete invagination into the structures.
The apparent diffusion constant for the POPC/DHPE-OG membrane was extracted by fitting the autocorrelation curves to Eq. 7 and averaging to yield a value of 1.1 × 10⁻⁸ ± 3 × 10⁻⁹ cm2/s (Fig. 2). As a control experiment, the diffusion constant for a POPC/DHPE-OG membrane was measured outside the ZMWs in a supported lipid bilayer on a fused silica substrate. The diffusion constant for the planar POPC/DHPE-OG bilayer was found to be 9.9 × 10⁻⁸ ± 6 × 10⁻⁹ cm2/s, in accordance with previously published values (40). The estimate made in the ZMWs is nearly an order of magnitude smaller than expected. As discussed further below, this deviation seems to be the result of the model's assumption about the conformation of the membrane in the focal volume.
Tetanus-GT1b interaction
The ability to coat the inside surface of a ZMW with a lipid bilayer allows characterization of the interactions between membrane-bound proteins or receptors and their ligands at high substrate concentration. Tetanus toxin has evolved to bind strongly to the GT1b ganglioside (41–43) and provides a simple system to demonstrate the determination of equilibrium constants. The binding constant was determined by incubating GT1b-populated POPC vesicles on the waveguides, allowing them to fuse and form a supported lipid bilayer, and incubating again with a known concentration of fluorescently labeled TTC. The fraction of the toxin bound to the ganglioside could then be measured, and standard Michaelis-Menten kinetics was then used to determine the equilibrium constant.
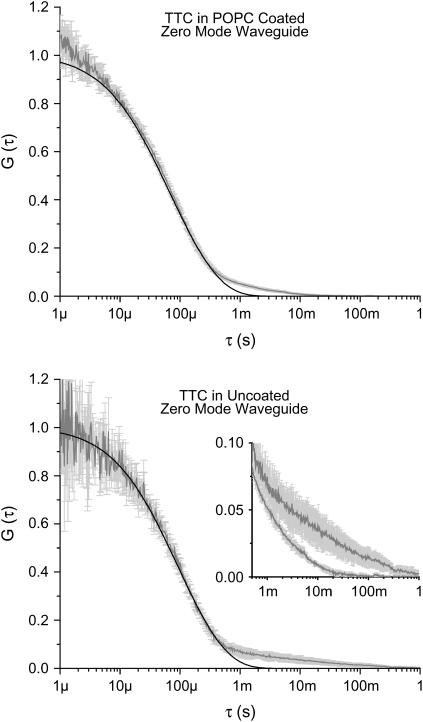
Correlation curves were taken with Alexa488-labeled TTC in ZMWs coated with a POPC/GT1b 95:5 molar ratio membrane. As control experiments, correlation curves were also taken with TTC in an uncoated waveguide and with TTC in a POPC-coated waveguide. These correlation curves were fit to Eq. 7 to extract the diffusion constant. Both control experiments yielded similar diffusion constants for the freely diffusing TTC: 1.4 × 10⁻⁷ ± 3 × 10⁻⁸ cm2/s in the untreated structures and 1.8 × 10⁻⁷ ± 1 × 10⁻⁸ cm2/s in the POPC-coated structures. As can be seen in Fig. 5, there is evidence of surface interactions in both cases. Physical protein adsorption is common on glass and metal surfaces and has required clever treatment in the past (25). Consequently, it is not surprising to see a long time component in the correlation curves from the uncoated structures. The characteristic time associated with the adsorption component is thought to be closely related to the photophysics of the dye, with quickly photobleaching dyes exhibiting shorter time constants. A qualitatively different long time component is present in the autocorrelation curves from the POPC-coated structures. The interaction between the tetanus toxin and the POPC membrane has a characteristic time an order of magnitude shorter than the time associated with surface adsorption. Surface adsorption reduces the concentration of diffusing molecules. This reduction leads to lower signal/noise ratio, and hence noisier autocorrelation curves. Fig. 5 shows just such an decrease in the signal/noise ratio, and the fits (summarized in Table 1) show considerably fewer diffusing molecules present in the uncoated structures. The evanescent decay constant, L, is similar for both the coated and uncoated structures, suggesting that they are of similar size. The difference in the surface interactions between the uncoated and coated structures provides additional support to the hypothesis that the POPC membranes are invaginating and coating the surface. Further support is provided by the observation of a well-defined free diffusion component in the autocorrelation curve from fluorescent TTC in the POPC-treated structures; this data would not be acquirable if the membrane were spanning the opening of the waveguide and preventing tetanus fragments from entering the evanescent field. Though there was variation in the long time tail from the uncoated structures, similar curves were acquired from a variety of both coated and uncoated structures.
FIGURE 5.
Normalized autocorrelation curves from fluorescently labeled tetanus toxin in zero mode waveguides. The shaded line represents the average of 5 curves, and error bars indicate the standard deviation at each point. The solid line is a fit with a ZMW model; which does not account for surface interactions. Because the surface interactions are not treated by the model, the parameters extracted from the fits are somewhat distorted. (Top) From waveguides coated with POPC. The “foot”, where the autocorrelation data deviate from the model, is due to a nonspecific or pseudospecific interaction between the protein and lipid membrane. The nature of the interaction between the tetanus and POPC is not known, however (see the text). (Bottom) From untreated waveguides. The foot at the bottom of the curve is due to fluorescent protein adsorbing to the glass and alumina surfaces and photobleaching. The large variation in the foot is consistent with physical adsorption. Note that the adsorption component from the uncoated structures has a characteristic time an order of magnitude longer than from the POPC-coated structures. (Inset) The long time tails of both curves plotted together.
TABLE 1.
Tetanus toxin fit parameters
| Sample | POPC/GT1b | TTC | TTC with POPC | TTC + GT1b |
|---|---|---|---|---|
| L (nm) | – | 24 ± 2 | 26 ± 3 | 25 ± 6 |
| N1 | – | 0.452 ± 0.005 | 1.52 ± 0.01 | 6 ± 1 |
| D1 (10−8 cm2/s) | – | 14 ± 1 | 18 ± 3 | 60 ± 20 |
| N2 | Varied | – | – | 8 ± 2 |
| D2 (10−8 cm2/s) | 4 ± 1 | – | – | 4 ± 1 |
Fit parameters for the tetanus toxin binding experiments. The membrane diffusivities listed are corrected for membrane curvature.
The nature of the interaction between the tetanus toxin and the POPC membrane is not known. However, it has been proposed that biological systems have evolved techniques that facilitate location of target binding sites (44,45). Ongoing research suggests that DNA binding proteins locate specific binding sites more efficiently by nonspecifically associating with a DNA strand and diffusing one-dimensionally along the strand until a binding site is encountered (46,47). It has also been suggested that these binding proteins make small three-dimensional jumps between transient associations with a DNA strand (48,49). It is plausible that the toxin has evolved a similar mechanism that allows it to nonspecifically adhere to the membrane surface to improve the probability of locating a ganglioside binding site or intercalating into the membrane.
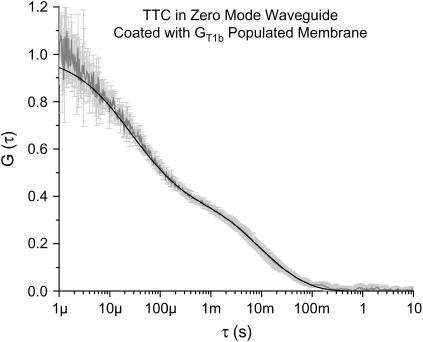
The correlation curves taken from TTC incubated with the POPC/GT1b membrane show two diffusing species with markedly different diffusivities. The correlation curves were analyzed by fitting to a model accounting for two different diffusing species in the ZMW. These fits yield the average number of fast and the average number of slow diffusing molecules in the observation volume as well as the diffusion constants for both species and the evanescent decay length. The results of the fits are summarized in Table 1. The fast component's diffusion constant, 6 × 10⁻⁷ ± 2 × 10⁻⁷ cm2/s, matches the diffusion constant determined in the control experiments for free TTC. As can be seen in Fig. 6, there was some variation in the diffusion time associated with the slow diffuser. The fit yielded a diffusion constant of 1.6 × 10⁻⁹ ± 5 × 10⁻¹⁰ cm2/s. As a control, the diffusivity of a 95:5 molar ratio POPC/GT1b membrane was determined using diffraction-limited FCS. The procedure was similar to the procedure outlined for the POPC control experiments. The diffusivity in the absence of tetanus toxin was measured via DHPE-OG inserted in the membrane. The experiment was repeated with fluorescent TTC to determine whether toxin binding changes the diffusivity. Both experiments returned similar diffusion constants: 5 ± 1 × 10⁻⁸ cm2/s for the former and 4 ± 1 × 10⁻⁸ cm2/s for the latter. As with the POPC/DHPE-OG membrane, the ZMW measurements underestimate the diffusivity of the membrane.
FIGURE 6.
Autocorrelation curve from fluorescently labeled tetanus toxin incubated in a waveguide coated with GT1b-populated POPC. The shaded curve is the average of five curves. The error bars represent the standard deviation at each point. The solid line is a fit from a zero mode waveguide model accounting for two distinct diffusing species. The fast component is the freely diffusing TTC, whereas the slow component is from TTC bound to the gangliosides. The equilibrium binding constant can be obtained from the fraction of bound toxin and the total tetanus concentration.
The relative fraction of bound toxin can be determined from the average number of each species in the focal volume. Previous work has indicated that the intercept values must be corrected because constant background fluorescence will depress the intercepts and spuriously increase the apparent number of molecules in the focal volume (25). The intercept for each species is related to the background and average number of molecules by (50)
 |
(12a) |
 |
(12b) |
The constant background, B, will be identical for both species because the data for them are acquired simultaneously. Solving Eqs. 12a and 12b for the background and equating the two yields the relationship between the intercepts and the number of molecules:
 |
(13) |
When the intercepts are essentially equal, as with this data, the number of molecules in the focal volume also must be equal. Hence, the ratio of free to bound toxin is equal to the ratio of the intercepts between the free and bound components of the correlation curves. With the fraction of bound toxin determined, Michaelis-Menten kinetics can be used to estimate the equilibrium constant for the system. The reaction velocity can be written
 |
(14) |
where Vmax is the maximum reaction rate, [TTC] is the total tetanus toxin concentration, and K is the equilibrium constant. In terms of the fraction of bound tetanus toxin, f = V/Vmax, the equilibrium constant is
 |
(15) |
The number of fast and slow diffusing molecules varied somewhat from run to run; however, f was essentially constant at 0.56 ± 0.02 This yields an equilibrium constant of 390 ± 40 nM−1. This value compares favorably to other values reported in the literature (24).
Membrane conformation
The diffusion constants measured for both POPC/DHPE-OG and POPC/GT1b in the ZMWs do not precisely match the diffusion constants measured on fused silica coverslips. The discrepancy is curious because previous studies of freely diffusing molecules have accurately reproduced diffusion constants measured via other techniques. Though there are several possible physical explanations for the deviation of the membrane diffusion constant, it seems most likely that, as discussed above, the shortcomings of the model are primarily responsible. If the spatial detectivity function, S(z), does not closely approximate the actual excitation-detection efficiency, or the concentration correlation function does not precisely describe transport, then the model autocorrelation function will not accurately depend on the diffusion properties of the membrane. The validity of the spatial detectivity function has been established previously. When the membrane has a nontrivial conformation, however, the one-dimensional concentration correlation function becomes inaccurate.
Establishing an accurate model for diffusion on arbitrarily contoured membranes within ZMWs is an intricate mathematical problem involving balancing the membrane energetics to establish the membrane shape and then solving the diffusion problem in the membrane. Though work to understand the intricacies of the model is ongoing, it is beyond the scope of this article to present a complete model. Instead, we demonstrate that nontrivial membrane conformations can account for the deviation in diffusivities.
Experiments carried out in ZMWs are practically limited to observing axial diffusion. This follows from the empirical evidence showing that changes in the spatial detectivity function in the transverse directions are negligible compared to the change in the axial direction. For fluorophores freely diffusing in and out of the structures, this is of no consequence. The solution to the diffusion equation is separable so that the transverse movement of molecules does not influence their diffusion along the axis of the structure. This assumption fails when the molecules are constrained to move on a membrane, however. In this case, movement in the transverse directions can have a significant impact on the axial, and hence, detectable movement. The lipid bilayer is constrained to take up a conformation that minimizes its free energy. This means a balance between surface adsorption and curvature that will result in some complicated nearly radially symmetric shape. As shown in Fig. 7, the result is that fluorophores diffusing a distance dl along the membrane will travel only a distance dz in the axial direction. The portion of the membrane that is in the evanescent field is in the vicinity of the bottom of the structure. At the bottom the ratio, dz/dl is expected to be small, becoming zero where the membrane is adsorbed to the bottom and unity on the side walls. If the membrane takes on the form of a cone extending from the top of the structure to a point at the bottom (Fig. 7, light shaded line), then the ratio between path length and axial displacement is constant along the entire length of the membrane. Though this is not an expected shape for the membrane, it provides insight into the impact on the measured diffusion constant. The net result is that the fluorophore appears to move axially at a rate dz/dl slower than the actual velocity along the membrane. The diffusion constant can then be corrected by dividing it by (½ dz/dl)2 where the factor of 2 arises because the membrane passes through the evanescent decay twice.
Consider a membrane with conformation described by the function z = f(r), where z is the axial position and r ranges from 0 to R, the radius of the ZMW. The infinitesimal arc length is given by
 |
(16) |
Hence, for the conical membrane, the correction factor is given by
 |
(17) |
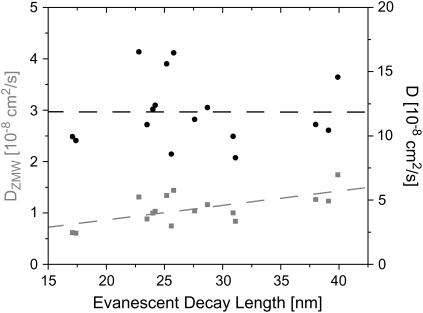
where R is the radius and H is the height of the ZMW. This illustrates an important aspect of the measurements. That is, the magnitude of the measured diffusion constant's deviation from the expected value should depend on the size of the ZMW. In fact, the measured diffusion constants do vary with the evanescent decay length, which increases with increasing ZMW radius (see Fig. 8). The conical model suggests that the larger the ZMW, the more distorted the results. The measurements, however, yield diffusion constants that approach the accepted value as the ZMW radius increases. In other words, the smaller the ZMW, the more distorted the diffusion measurement.
FIGURE 8.
A representative set of diffusion constants obtained by fitting FCS autocorrelation functions with the one-dimensional model (shaded squares). The estimate of the diffusion constant clearly depends on the evanescent decay length of the ZMW and hence on the size of the ZMW. The dashed line is a linear fit of the data. Past experiments, with fluorophores not confined to a membrane, have not displayed this dependence of D on L. When the conformation of the membrane in the ZMWs is accounted for, the correction of the estimated diffusion constant removes this dependence and produces a diffusion constant closer to accepted values. Solid circles represent the data corrected, assuming a membrane with a spherical cap of radius 50 nm at the bottom of the ZMWs.
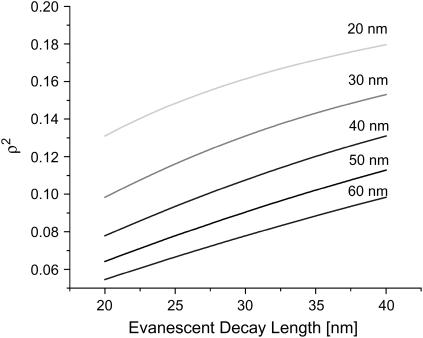
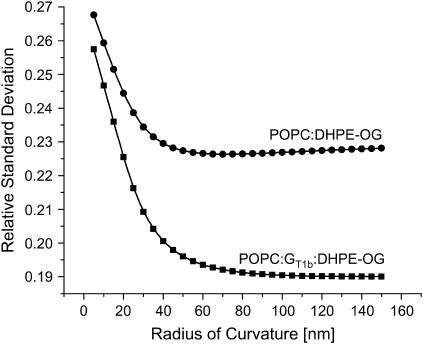
It is not surprising that the conical membrane model makes incorrect predictions: it seems an unlikely conformation for the membrane. Consider, instead, a membrane that is a hemisphere at the bottom of the ZMW and takes on the cylindrical shape of the ZMW above that (see Fig. 7, shaded line). In this case, the ratio dz/dl is not constant along the length of the membrane. The FCS autocorrelation function is dependent on the average residence time of the fluorophore in the focal volume. Hence, by averaging the ratio dz/dl along the membrane and weighting by the normalized spatial detectivity function, a suitable correction factor is expected. The correction factor ρ2 = DZMW/D is then given by
 |
(18) |
The radius of curvature of the hemisphere can be set equal to the radius of the ZMW, or it can be fixed at a reasonable value. For the hemispherical cap, the equation for the membrane can be written as: (z − R)2 + r2 = R2, yielding a simple expression for the ratio dz/dl. Correction factors for several radii of curvature are plotted in Fig. 9. Plotted in Fig. 10 are the relative standard deviations for the corrected diffusion constants as a function of the radius of curvature of the membrane. The correction factor is expected to remove the ZMW size dependence from the diffusion constant, and the decrease in the relative standard deviation reflects this. As can be seen in Fig. 8, when the membrane is given a radius of curvature of 50 nm, the correction factor removes the ZMW size dependence from the measured diffusion constants and increases the estimate of the diffusivity to 1.3 ± 0.3 × 10⁻⁷ cm2/s. When applied to the POPC/GT1b membrane, the relative standard deviation reaches a minimum at a larger radius of membrane curvature. This is consistent with the high ganglioside fraction reducing the flexibility of the membrane. The correction procedure gives the diffusion constant for the POPC/GT1b membrane as 3.4 ± 0.7 × 10⁻⁸ cm2/s for a membrane radius of curvature of 80 nm and 4 ± 1 × 10⁻⁸ cm2/s for a radius of curvature of 100 nm (Table 2). The POPC/GT1b data were taken in larger holes, and these radii are at the upper limit of the ZMW sizes, suggesting that the membrane is taking the radius of the ZMW as its radius of curvature.
FIGURE 9.
Correction factor plotted as a function of evanescent decay length. Each line corresponds to a membrane with the labeled radius of curvature. As expected, the correction is largest for structures with short evanescent decay length and hence small radii.
FIGURE 10.
Relative standard deviation of the corrected POPC/DHPE-OG and POPC/GT1b/DHPE-OG diffusivities as a function of the membrane's radius of curvature at the bottom of the ZMW. The relative standard deviation of the uncorrected data is high because there is a slope to the diffusivity when plotted as a function of L. As that dependence is removed by the correction of the data, the relative standard deviation decreases. The minimum is expected to occur near where the diffusion constant's dependence on L is removed completely. For the POPC membrane, that minimum occurs for a radius of curvature of 50 nm. In contrast, the more rigid POPC/GT1b membrane reaches a minimum for a larger radii of curvature, suggesting that the membrane is taking the minimum allowable curvature within the structure.
This estimate neglects two important effects. It has been assumed that diffusion around the radius of the membrane has little impact on the results. To first order, this is correct. Motion in the dl direction can be projected onto dz, whereas motion in the dθ direction cannot. This implies that the two directions are normal, and hence diffusion in one direction does not affect diffusion in the other. However, the ability of molecules to diffuse all the way around the structure subtly distorts the solution to the diffusion equation, and this distortion is not accounted for in the correction. Nor is the effect of membrane adsorbed to the bottom of the ZMW accounted for. However, this estimate demonstrates that the difference between the diffusion constant measured in the ZMWs and measured conventionally can be accounted for by nontrivial membrane shape. Additionally, the results suggest reasonable radii of curvature for the membrane. Further refinement of the measurements will require the development of a more complete autocorrelation model function.
CONCLUSION
Results from the characterization of lipid bilayers incubated on surfaces patterned with ZMWs suggest that liquid phase lipid mixtures will invaginate and coat the surface of the nanostructures. The fluorescence correlation curves accurately fit the ZMW model, though further work is needed to understand lipid membrane conformation in nanoscale structures. Control experiments performed with gel phase fluorescent lipid vesicles showed that distinguishing between invaginated and noninvaginated bilayers is possible. Finally, the focal volume confinement provided by the ZMWs allowed the determination of the TTC-GT1b equilibrium binding constant at high TTC concentration. Because invaginated membranes are easy to identify, the ZMWs should provide an ideal platform for the study of membrane rigidity and bending modulus. Zero mode waveguides also present an ideal platform for the study of single membrane proteins. The kinetics and dynamics of these important biophysical systems could easily be examined at physiologically relevant ligand concentrations.
TABLE 2.
Lipid bilayer diffusivities
| Sample | POPC/DHPE-OG control | POPC/DHPE-OG ZMW | POPC/GT1b control | POPC/GT1b ZMW |
|---|---|---|---|---|
| DZMW (10−8 cm2/s) | – | 1.1 ± 0.3 | – | 0.16 ± 0.05 |
| D (10−8 cm2/s) | 9.9 ± 0.6 | 13 ± 3 | 4 ± 1 | 4 ± 1 |
Diffusion constants acquired from the ZMW experiments and from the control experiments. For the ZMW experiments, the original (DZMW) and corrected (D) diffusivities are reported.
Acknowledgments
Note added in proof: At the time this work was prepared, the authors were unaware of similar work being done concurrently by Wenger et al. (51).
The authors acknowledge support provided by CONACyT Graduate Scholorship No. 167803 (J.M.M.), the Nanobiotechnology Center, and STC Program of the National Science Foundation (Agreement ECS-9876771). Fabrication work was performed in part at the Cornell NanoScale Facility, a member of the National Nanotechnology Infrastructure Network, which is supported by the National Science Foundation (Grant ECS 03-35765).
References
- 1.Lipowsky, R. 1995. The morphology of lipid membranes. Curr. Opin. Struct. Biol. 5:531–540. [DOI] [PubMed] [Google Scholar]
- 2.Lipowsky, R. 1995. From bunches of membranes to bundles of strings. Zeitschrift Fur Physik B-Condensed Matter. 97:193–203. [Google Scholar]
- 3.Lipowsky, R., and S. Leibler. 1986. Unbinding transitions of interacting membranes. Phys. Rev. Lett. 56:2541–2544. [DOI] [PubMed] [Google Scholar]
- 4.Mutz, M., and W. Helfrich. 1989. Unbinding transition of a biological model membrane. Phys. Rev. Lett. 62:2881–2884. [DOI] [PubMed] [Google Scholar]
- 5.Lipowsky, R. 1994. Discontinuous unbinding transitions of flexible membranes. Journal De Physique Ii. 4:1755–1762. [Google Scholar]
- 6.Lipowsky, R., and U. Seifert. 1991. Adhesion of membranes: a theoretical perspective. Langmuir. 7:1867–1873. [Google Scholar]
- 7.Evans, E. A. 1980. Analysis of adhesion of large vesicles to surfaces. Biophys. J. 31:425–431. [DOI] [PMC free article] [PubMed] [Google Scholar]
- 8.Evans, E. 1990. Adhesion of surfactant membrane covered droplets: special features and curvature elasticity effects. Coll. Surf. 43:327–347. [Google Scholar]
- 9.Sackmann, E. 1996. Supported membranes: scientific and practical applications. Science. 271:43–48. [DOI] [PubMed] [Google Scholar]
- 10.Tamm, L. K., and H. M. McConnell. 1985. Supported phospholipids bilayers. Biophys. J. 47:105–113. [DOI] [PMC free article] [PubMed] [Google Scholar]
- 11.Glaser, M. 1993. Lipid domains in biological membranes. Curr. Opin. Struct. Biol. 3:475–481. [Google Scholar]
- 12.Wu, S. H. W., and H. M. McConnell. 1975. Phase separations in phospholipid membranes. Biochemistry. 14:847–854. [DOI] [PubMed] [Google Scholar]
- 13.Goulian, M., R. Bruinsma, and P. Pincus. 1993. Long-range forces in heterogeneous fluid membranes. Europhys. Lett. 22:145–150. [Google Scholar]
- 14.Benda, A., M. Benes, V. Marecek, A. Lhotsky, W. T. Hermens, and M. Hof. 2003. How to determine diffusion coefficients in planar phospholipid systems by confocal fluorescence correlation spectroscopy. Langmuir. 19:4120–4126. [Google Scholar]
- 15.Korlach, J., P. Schwille, W. W. Webb, and G. W. Feigenson. 1999. Characterization of lipid bilayer phases by confocal microscopy and fluorescence correlation spectroscopy. Proc. Natl. Acad. Sci. USA. 96:8461–8466. [DOI] [PMC free article] [PubMed] [Google Scholar]
- 16.Schwille, P., J. Korlach, and W. W. Webb. 1999. Fluorescence correlation spectroscopy with single-molecule sensitivity on cell and model membranes. Cytometry. 36:176–182. [DOI] [PubMed] [Google Scholar]
- 17.Bacia, K., D. Scherfeld, N. Kahya, and P. Schwille. 2004. Fluorescence correlation spectroscopy relates rafts in model and native membranes. Biophys. J. 87:1034–1043. [DOI] [PMC free article] [PubMed] [Google Scholar]
- 18.Kahya, N., D. Scherfeld, K. Bacia, and P. Schwille. 2004. Lipid domain formation and dynamics in giant unilamellar vesicles explored by fluorescence correlation spectroscopy. J. Struct. Biol. 147:77–89. [DOI] [PubMed] [Google Scholar]
- 19.Scherfeld, D., N. Kahya, and P. Schwille. 2003. Lipid dynamics and domain formation in model membranes composed of ternary mixtures of unsaturated and saturated phosphatidylcholines and cholesterol. Biophys. J. 85:3758–3768. [DOI] [PMC free article] [PubMed] [Google Scholar]
- 20.Kahya, N., D. Scherfeld, K. Bacia, B. Poolman, and P. Schwille. 2003. Probing lipid mobility of raft-exhibiting model membranes by fluorescence correlation spectroscopy. J. Biol. Chem. 278:28109–28115. [DOI] [PubMed] [Google Scholar]
- 21.Korlach, J., T. Baumgart, W. W. Webb, and G. W. Feigenson. 2005. Detection of motional heterogeneities in lipid bilayer membranes by dual probe fluorescence correlation spectroscopy. BBA-Biomembranes. 1668:158–163. [DOI] [PubMed] [Google Scholar]
- 22.Baumgart, T., S. T. Hess, and W. W. Webb. 2003. Imaging coexisting fluid domains in biomembrane models coupling curvature and line tension. Nature. 425:821–824. [DOI] [PubMed] [Google Scholar]
- 23.Ajo-Franklin, C. M., C. Yoshina-Ishii, and S. G. Boxer. 2005. Probing the structure of supported membranes and tethered oligonucleotides by fluorescence interference contrast microscopy. Langmuir. 21:4976–4983. [DOI] [PubMed] [Google Scholar]
- 24.Moran-Mirabal, J. M., J. B. Edel, G. D. Meyer, D. Throckmorton, A. K. Singh, and H. G. Craighead. 2005. Micrometer-sized supported lipid bilayer arrays for bacterial toxin binding studies through total internal reflection fluorescence microscopy. Biophys. J. 89:296–305. [DOI] [PMC free article] [PubMed] [Google Scholar]
- 25.Samiee, K. T., M. Foquet, L. Guo, E. C. Cox, and H. G. Craighead. 2005. Lambda-repressor oligomerization kinetics at high concentrations using fluorescence correlation spectroscopy in zero-mode waveguides. Biophys. J. 88:2145–2153. [DOI] [PMC free article] [PubMed] [Google Scholar]
- 26.Levene, M. J., J. Korlach, S. W. Turner, M. Foquet, H. G. Craighead, and W. W. Webb. 2003. Zero-mode waveguides for single-molecule analysis at high concentrations. Science. 299:682–686. [DOI] [PubMed] [Google Scholar]
- 27.Suzuki, K., and H. Masuhara. 2005. Groove-spanning behavior of lipid membranes on microfabricated silicon substrates. Langmuir. 21:6487–6494. [DOI] [PubMed] [Google Scholar]
- 28.Groves, J. T., N. Ulman, and S. G. Boxer. 1997. Micropatterning fluid lipid bilayers on solid supports. Science. 275:651–653. [DOI] [PubMed] [Google Scholar]
- 29.Cremer, P. S., and S. G. Boxer. 1999. Formation and spreading of lipid bilayers on planar glass supports. J. Phys. Chem. B. 103:2554–2559. [Google Scholar]
- 30.Boxer, S. G. 2000. Molecular transport and organization in supported lipid membranes. Curr. Opin. Chem. Biol. 4:704–709. [DOI] [PubMed] [Google Scholar]
- 31.Nissen, J., K. Jacobs, and J. O. Radler. 2001. Interface dynamics of lipid membrane spreading on solid surfaces. Phys. Rev. Lett. 86:1904–1907. [DOI] [PubMed] [Google Scholar]
- 32.Foquet, M., J. Korlach, W. R. Zipfel, W. W. Webb, and H. G. Craighead. 2004. Focal volume confinement by submicrometer-sized fluidic channels. Anal. Chem. 76:1618–1626. [DOI] [PubMed] [Google Scholar]
- 33.Magde, D., W. W. Webb, and E. Elson. 1972. Thermodynamic fluctuations in a reacting system - measurement by fluorescence correlation spectroscopy. Phys. Rev. Lett. 29:705–708. [Google Scholar]
- 34.Magde, D., E. L. Elson, and W. W. Webb. 1974. Fluorescence correlation spectroscopy.2. Experimental realization. Biopolymers. 13:29–61. [DOI] [PubMed] [Google Scholar]
- 35.Webb, W. W. 2001. Fluorescence correlation spectroscopy: inception, biophysical experimentations, and prospectus. Appl. Opt. 40:3969–3983. [DOI] [PubMed] [Google Scholar]
- 36.Elson, E. L., and D. Magde. 1974. Fluorescence correlation spectroscopy.1. Conceptual basis and theory. Biopolymers. 13:1–27. [DOI] [PubMed] [Google Scholar]
- 37.Widengren, J., U. Mets, and R. Rigler. 1995. Fluorescence correlation spectroscopy of triplet-states in solution: a theoretical and experimental-study. J. Phys. Chem. 99:13368–13379. [Google Scholar]
- 38.LIPIDAT. 1996. http://www.lipidat.chemistry.ohio-state.edu/. The Ohio State University, Columbus, OH.
- 39.Maulucci, G., M. De Spirito, G. Arcovito, F. Boffi, A. C. Castellano, and G. Briganti. 2005. Particle size distribution in DMPC vesicles solutions undergoing different sonication times. Biophys. J. 88:3545–3550. [DOI] [PMC free article] [PubMed] [Google Scholar]
- 40.Lee, B. S., S. A. Mabry, A. Jonas, and J. Jonas. 1995. High-pressure proton NMR study of lateral self-diffusion of phosphatidylcholines in sonicated unilamellar vesicles. Chem. Phys. Lipids. 78:103–117. [DOI] [PubMed] [Google Scholar]
- 41.Winter, A., W. P. Ulrich, F. Wetterich, U. Weller, and H. J. Galla. 1996. Gangliosides in phospholipid bilayer membranes: Interaction with tetanus toxin. Chem. Phys. Lipids. 81:21–34. [DOI] [PubMed] [Google Scholar]
- 42.Louch, H. A., E. S. Buczko, M. A. Woody, R. M. Venable, and W. F. Vann. 2002. Identification of a binding site for ganglioside on the receptor binding domain of tetanus toxin. Biochemistry. 41:13644–13652. [DOI] [PubMed] [Google Scholar]
- 43.Helting, T. B., O. Zwisler, and H. Wiegandt. 1977. Structure of tetanus toxin. 2. Toxin binding to ganglioside. J. Biol. Chem. 252:194–198. [PubMed] [Google Scholar]
- 44.Berg, O. G., and P. H. Vonhippel. 1985. Diffusion-controlled macromolecular interactions. Annu. Rev. Biophys. Biophys. Chem. 14:131–160. [DOI] [PubMed] [Google Scholar]
- 45.Vonhippel, P. H., and O. G. Berg. 1989. Facilitated target location in biological-systems. J. Biol. Chem. 264:675–678. [PubMed] [Google Scholar]
- 46.Halford, S. E., and M. D. Szczelkun. 2002. How to get from A to B: strategies for analysing protein motion on DNA. Eur. Biophys. J. Biophy. 31:257–267. [DOI] [PubMed] [Google Scholar]
- 47.Shimamoto, N. 1999. One-dimensional diffusion of proteins along DNA: its biological and chemical significance revealed by single-molecule measurements. J. Biol. Chem. 274:15293–15296. [DOI] [PubMed] [Google Scholar]
- 48.Gowers, D. M., and S. E. Halford. 2003. Protein motion from non-specific to specific DNA by three-dimensional routes aided by supercoiling. EMBO J. 22:1410–1418. [DOI] [PMC free article] [PubMed] [Google Scholar]
- 49.Stanford, N. P., M. D. Szczelkun, J. F. Marko, and S. E. Halford. 2000. One- and three-dimensional pathways for proteins to reach specific DNA sites. EMBO J. 19:6546–6557. [DOI] [PMC free article] [PubMed] [Google Scholar]
- 50.Koppel, D. E. 1974. Statistical accuracy in fluorescence correlation spectroscopy. Phys. Rev. A. 10:1938–1945. [Google Scholar]
- 51.Wenger J., H. Rigneault, J. Dintinger, D. Marguet, and P. Lenne. 2006. Single-fluorophore diffusion in a lipid membrane over a subwavelength aperture. J. Biol Phys. 32:1–4. [DOI] [PMC free article] [PubMed] [Google Scholar]


