Abstract
The neurotoxin fasciculin-2 (FAS2) is a picomolar inhibitor of synaptic acetylcholinesterase (AChE). The dynamics of binding between FAS2 and AChE is influenced by conformational fluctuations both before and after protein encounter. Submicrosecond molecular dynamics trajectories of apo forms of fasciculin, corresponding to different conformational substates, are reported here with reference to the conformational changes of loop I of this three-fingered toxin. This highly flexible loop exhibits an ensemble of conformations within each substate corresponding to its functions. The high energy barrier found between the two major substates leads to transitions that are slow on the timescale of the diffusional encounter of noninteracting FAS2 and AChE. The more stable of the two apo substates may not be the one observed in the complex with AChE. It seems likely that the more stable apo form binds rapidly to AChE and conformational readjustments then occur in the resulting encounter complex.
INTRODUCTION
Protein-protein interactions are ubiquitous and crucial in biology. Flexible proteins can adopt ensembles of conformations. The intrinsic conformational flexibility of a protein may influence the kinetics of protein-protein binding (1). Determination of the rate-limiting step for the association of proteins that form a complex is important for understanding the behavior of the systems under different experimental conditions. Fasciculin-2 (FAS2), a three-fingered peptide isolated from snake venoms, is a picomolar inhibitor of acetylcholinesterase (AChE). Crystal structures (2–4) of the peptide reveal significant flexibility in loop I. This 61-residue peptide is an excellent model for conformational dynamics on the submicrosecond timescale, particularly the conformational changes of loop I that may be involved with its binding to AChE.
Four fasciculins have been characterized to date: FAS1 and FAS2 from the venom of Dendroaspis angusticeps, FAS3 from the venom of Dendroaspis viridis, and toxin C from the venom of Dendroaspis polylepis. The primary structures of FAS1 and FAS2 are nearly identical and differ only by one residue at position 47. Crystallographic studies (3–6) suggest the existence of two conformational substates for FAS2. One is the conformation found for the homologous FAS1. In this, Thr-9 near the tip of loop I packs against a hydrophobic pocket that is formed by atoms from residues Tyr-4, Ala-12, Tyr-61, and Arg-37. We designate this as the FAS2a substate to distinguish it from the FAS2b substate in which the Thr-9 extends into the solution. The hydrophobic pocket in the FAS2b conformers is occupied by either an aliphatic chain of the β-octylglucoside molecule (the detergent that was cocrystallized in the apo-FAS2 structures (3)) or by the hydrophobic side chain of Val-73 of AChE as seen in the FAS2-AChE complex (5,6).
This work presents a dynamical study of FAS2 on a submicrosecond timescale to shed light on its conformational variations before and after binding to AChE. The results are also compared to a 15-ns molecular dynamics (MD) simulation (7) of FAS2 bound to AChE. Configurational free energies of each conformational substate are calculated to determine their relative stability. Free energy profiles of the conformational transitions between the substates are also computed from targeted molecular dynamics (TMD) trajectories (8,9).
METHODS
MD parameter setup
FAS1 and FAS2 differ by only one residue: a tyrosine at position 47 in FAS1 is replaced by asparagine in FAS2. Two submicrosecond MD simulations of FAS2 were carried out: one in the FAS2a conformational substate and the other in the FAS2b substate. The starting structures were obtained from the protein data bank with the entry numbers 1fas (4) and 1fsc (3), which correspond to FAS2a and FAS2b, respectively. The crystal structure of FAS1 was first superimposed onto FAS2; Tyr-47 was then mutated to Asn-47. Four chloride counterions were added to each system to neutralize the total of four positive charges of the molecules. The systems were then solvated with the same numbers of TIP3 water molecules (10). The simulation systems had a total of 13,615 atoms: 910 solute atoms and 4235 TIP3 water molecules. The peptide has four disulfide bonds, which were intact in simulations.
The MD trajectories of apo-FAS2 were collected by numerical integration using the Amber 6.0 MD software package (11). A standard molecular dynamic procedure was performed beginning with steepest descent energy minimization until the system was significantly relaxed. The system was then equilibrated and velocities were reassigned from 300 K Maxwellian distributions every 1 ps for 10 ps. The simulation was conducted using the isobaric-isothermal ensemble (12) at 300 K and 1 atm. Long-range nonbonded interactions with a 10 Å residue-based cutoff were used. Long-range electrostatic forces were calculated using the particle mesh Ewald sum (13). After equilibration, a 0.15 μs MD trajectory for the FAS2a substate was collected, and a 0.3 μs MD trajectory was collected for the FAS2b substate.
Cluster analysis and molecular potential energy
To identify structural representatives of conformational families in the protein's essential configuration space, a “family clustering” or k-mean clustering algorithm (14–16) that minimizes the sum of square Euclidean distances of points within a cluster from its random seed center was employed to conformationally cluster MD snapshots, represented by their projections on the essential configuration space. The ambiguity in choice of k—the number of clusters—often complicates the classification of conformers that exhibit similar motions because the cutoff boundary between clusters is not always obvious. Since the projections of MD snapshots onto the essential configuration space can be mapped back to their three-dimensional (3-D) configurations, the k values were manually refined from 15 clusters to the final value based on the average 3-D structure of each cluster and its position on the molecular energy landscape.
The potential energy function of the system dictates the configurational space that the MD trajectories sample. For an ergodic system in equilibrium, the effective potential energy landscape ΔGM can be defined as ΔGM = −RTln(ρ), where RT is the thermal energy and ρ is the distribution density of snapshots onto the essential configuration space (17), which is spanned by a subset of the eigenvectors obtained from the covariance matrix for α carbon displacements (see the Conformational variations section below). By definition, ρ is also the statistical probability (18) that configurations occur in a small volume element of the projected coordinates. The conformational families obtained here are based not only on the Euclidean distance but also on the distribution density of conformers. Therefore, structures in each energy basin represent stable conformational families. These conformers were used to compute the conformational free energy, GC. This energy calculation resembles the molecular mechanics Poisson-Boltzmann solvent accessible (MMPBSA) method (19):
 |
(1) |
where 〈〉C denotes an average over the conformers in each local energy basin. The internal energy, UMM, of the solute was calculated as its energy in the gas phase. The solvation free energy, ΔWsol, is written as a sum of hydrophobic energy, ΔWnp, and electrostatic solvation energy, ΔWPB. The solute hydrophobic energy was calculated as the sum of products of solvent-accessible surface area (SASA) by atomic solvation parameters,  Wnp=
Wnp=  × SASA + β, where γ = 0.00542 kcal/mol Å2 and β = 0.92 kcal/mol (19,20). The SASA was calculated using the MSMS 2.5.3 program (21) with a water probe radius equal to 1.4 Å. The electrostatic contribution was computed using the adaptive Poisson-Boltzmann (PB) solver (22). The PB calculations were run with a temperature of 295 K, a solvent probe radius of 1.4 Å, a solvent dielectric constant of 78.4, and a reference gas phase dielectric constant of 1.0. The dielectric constant of the protein's interior was set at 1.0 to be consistent with the simulation setup. Finally, configurational entropy, SC, at each molecular potential energy basin is computed here. Therefore, normal mode analysis (NMODE module of AMBER 8) is used to estimate a partition function of the system from which thermodynamic properties such as the entropy can be calculated (23–25).
Conformational transitions
TMD (8,9), in which the mass-weighted root mean-square distances of loop I residues of FAS2a conformers to those of FAS2b conformers are restrained by a harmonic force constant, is used to accelerate transitions between these two stable substates. A total of 20 TMD simulations (10 with FAS2a as a reference structure and the other 10 with FAS2b structure as the targeted conformation) were conducted using the ITGTMD AMBER 8 module (11). In TMD, the potential energy function is modified by a harmonic restraint potential, Ures(X) = ½k(RMSDf – RMSDi)2, in which k is the restraint force constant, RMSDf is the RMSD of the final conformation, and RMSDi starts with the value equal to the RMSD between the initial and final structures and is slowly reduced to zero during the simulation. The root mean-square deviation (RMSD) thus corresponds to the reaction coordinate, describing the progress toward the target conformation. In each simulation, a very small force constant of 2.0 kcal/mol−1Å−2 was used, allowing the system to naturally sample conformational transitions between FAS2a and FAS2b and the reverse direction.
RESULTS AND DISCUSSION
Flexibility of the finger loops
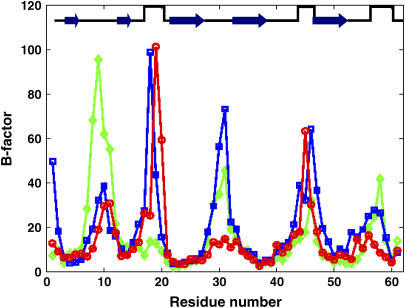
The mean-square fluctuations (MSF) can be scaled to represent the crystallographic thermal fluctuation factors, also called B-factors ( ) (18). In Fig. 1, the B-factors of the three different MD trajectories (apo-FAS2a, apo-FAS2b, and liganded FAS2) are compared. The most flexible parts include the residues at the tips of the loops, consistent with the experimental data (26) and previous MD studies (27). Surprisingly, enhanced mobility of the turn that links finger loops I and II is also observed for the apo-FAS2a trajectory. The enhanced motions of this turn are reminiscent of the adaptive linker motions of FAS2 bound to AChE as observed by Bui et al. (7). The primary interactions between FAS2 and AChE are at the finger tip residues of loops I and II. Correspondingly, in apo-FAS2a conformations, Thr-9 of finger tip loop I stacks against the hydrophobic pocket, restraining this loop compared to other finger loops; thus the motions of the linker are enhanced.
FIGURE 1.
B-factors of FAS2. Red circles are for the liganded FAS2 trajectory, green diamonds are for the FAS2b MD trajectory, and blue squares represent the FAS2b. Arrows represent β-strands and square wave pulses are linkers between the loops.
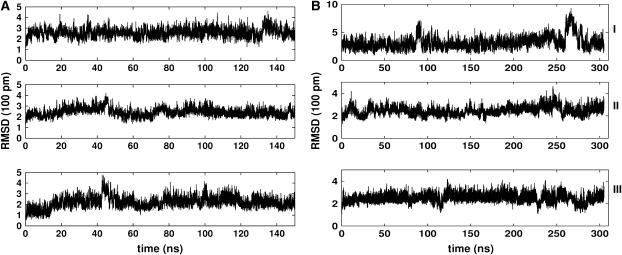
The flexibility of the finger loops allows significant deviations of the simulated conformers from the original reference crystal structures. The instantaneous RMSD of the peptide's heavy atoms and backbone atoms were computed. RMSDs of FAS2b conformers are significant—particularly around 85 ns and 260 ns—in comparison to those of the FAS2a trajectory (Fig. 2). As can be seen from this figure, significant changes in RMSD values are attributable to the finger tip loops. Most dramatically, the backbone atoms at the tip of loop I of the FAS2b trajectory are as much as 8 Å away from the reference structure. The highly mobile loop I exhibits an array of conformers that might be relevant to FAS2 functions. For example, loop I has been suggested to gate the protein-protein association (1). This loop also shows high correlations with the motions of AChE in the AChE-FAS2 complex (7).
FIGURE 2.
RMSD of heavy atoms of the finger tips in the FAS2 trajectories. Loop I: residues 7–12; loop II: residues 27–33; and loop III: residues 43–47. (A) FAS2a and (B) FAS2b.
Conformational variations
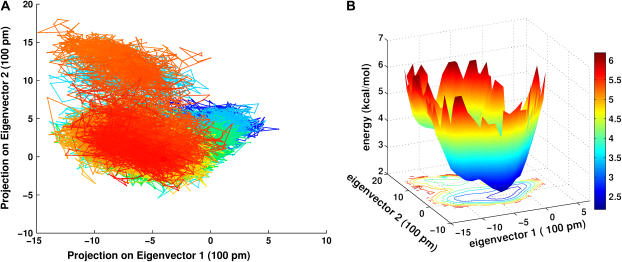
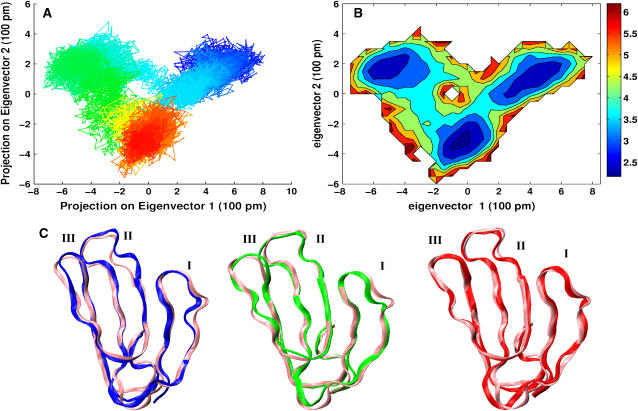
Conformational analysis was used to shed light on the conformational fluctuations of this highly flexible peptide (28,29). The subspace sampled in the trajectory is reflected by its positional covariance matrix. To capture the essential motions of the peptides, the principal modes were identified by diagonalizing the covariance matrix. The eigenvector associated with the largest eigenvalue represents the axis of maximal variance, then the second eigenvector is the axis with the second largest variance, and so forth. MD snapshots were projected every 10 ps onto the two most significant principal components and color coded as a function of time (part A of Figs. 3 and 4). The distribution densities of these conformers are plotted as contour curves (part B of Figs. 3 and 4) which show the contributions of each conformation. The residence time of the conformations can, therefore, be directly visualized in this way. The projections and distribution densities of the apo-FAS2a MD trajectory onto the two most significant principal components are not shown since it seems to be trapped in a single potential well. The apo-FAS2b trajectory sampled more configurational space than those of the apo-FAS2a and the liganded FAS2. This is at least partly due to differences in the lengths of the trajectories. There are two distinct clusters of conformers that the apo-FAS2b visited. As can be seen in Fig. 3 B, which represents the energy landscape of the apo-FAS2b, the two apparent clusters are separated by a small barrier of ∼2.5 kcal/mol and transitions between the clusters occur on a timescale of ∼10–100 ns. There are three apparent clusters that can be identified for the liganded FAS2 trajectory (Fig. 4 B). Small barriers (1.0 kcal/mol) exist between these clusters. Because the liganded-FAS2 trajectory is much shorter than those of the apo species, convergence may be problematic. Still, the structures in each conformational cluster, as depicted in Fig. 4 C, differ noticeably from each other.
FIGURE 3.
Projections of 10 ps MD snapshots of the apo-FAS2b trajectory onto the plane of the first two principal modes. (A) Color gradient from blue at the starting conformer to the brightest red at the 305 ns snapshot. (B) Molecular effective potential energy surface and contour plot of distribution conformer density, ρ. The bar color code indicates molecular potential, −RT*ln(ρ) in units of kcal/mol.
FIGURE 4.
Projections of 1 ps MD snapshots of the 15 ns liganded FAS2 trajectory onto the plane of the first two principal modes. (A) Color gradient from blue at the starting conformer to the brightest red at the 15 ns snapshot. (B) A contour plot of distribution conformer density, ρ. The bar color code indicates molecular potential, −RT*ln(ρ) in units of kcal/mol. (C) Average cluster representations for the cluster in each energy basin. The reference structure is pink. Color code reflects the average structure of the clusters. Roman numeric is used to indicate the loop number.
To further explore the structural characteristics that the trajectories sampled, the k-mean cluster analyses were carried out in a refined manner as described in the Methods section. The average structure of each cluster is obtained for the apo-FAS2b trajectory. Most of the changes are very subtle except for large excursion of loop I. Although the FAS2a trajectory is very stable and fluctuated around the reference structure, cluster analysis of this trajectory suggests that there are four clusters, of which one average structure shows fluctuations of loop III and the turn that links loop I and II together (result not shown). Variations in the conformations of the peptide give some indication of the functional capabilities of the α-neurotoxin toxin family, e.g., in allowing some members to bind other targets such as the ACh receptors (30).
Configurational free energy of conformational clusters
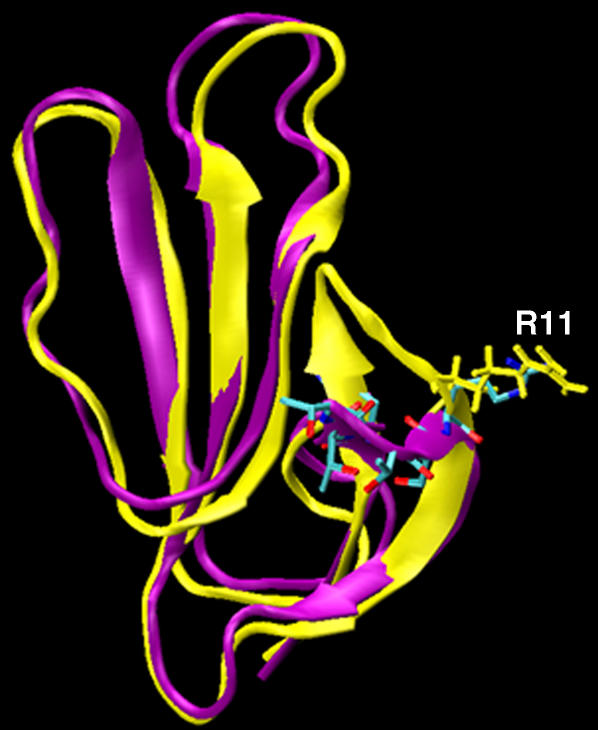
To quantitatively assess their relative stability, the configurational free energy was estimated for the following conformational clusters: the primary FAS2b conformers, which are those in the lowest energy basin of the energy landscape (Fig. 3 B); the secondary FAS2b conformers, which have loop I exposed to the solvent (Fig. 5); and the FAS2a conformers, which have the Thr-9 side chain stacked against the hydrophobic pocket. The configurational free energy for the FAS2a conformers was significantly lower than those of the FAS2b ones (Table 1). The secondary FAS2b structure appears to be slightly less stable in comparison to the primary FAS2b structure, consistent with Fig. 3 B, although the cumulative error is comparable to the difference in free energy (Table 1). Loop I contains a large number of polar residues, so that the solvent-exposed conformers of the secondary cluster have the lowest solvation energy (Table 1). Of particular interest, the secondary FAS2b conformers resemble the liganded FAS2 conformers that maximize the contacts with the outer portions of the long ω loop (CYS69–96) of AChE. Fig. 5 illustrates the similarities between these conformers in terms of the secondary structures and Arg-11 side-chain orientation. Arg-11 is a key residue making contact with the outer portions of the long ω loop. Both conformers have extending and twisted β strands; however, the liganded-FAS2 is not entirely solvent exposed as seen in the secondary FAS2b conformer. The binding of FAS to the outer portion of the long ω loop of AChE is associated with a higher frequency in opening the back door to the active site of the enzyme (7).
FIGURE 5.
Secondary structure of the solvent exposed conformer. The secondary FAS2b (purple) is superimposed onto the very similar liganded conformer (yellow), which makes maximum contacts to the outer portion of the AChE long ω loop (CYS69–CYS96). Licorice representation for heavy atoms of the tip residues (residues 7–11) of loop I are also shown here.
TABLE 1.
Energetic average (kcal/mol)
| Cluster | 〈UMM〉* | 〈WPB〉† | 〈WNP〉‡ | T〈S〉§ | 〈GC〉¶ |
|---|---|---|---|---|---|
| FAS2a | −1820 ± 0.8 | −890 ± 0.05 | 22.0 ± 0.6 | 699 ± 1.5 | −3387 |
| Primary FAS2b | −1795 ± 1.3 | −900 ± 0.09 | 23.4 ± 0.4 | 700 ± 1.5 | −3372 |
| Secondary FAS2b | −1768 ± 0.9 | −917 ± 0.13 | 24.0 ± 0.4 | 706 ± 1.3 | −3367 |
Energetic average with standard error is the average of 1800 snapshots in its energy basin according to its distribution density on the first two principal modes.
Molecular mechanical energy.
Electrostatic solvation energy.
Nonpolar solvation energy.
Conformational entropy.
Configurational free energy (Eq. 1).
Kinetics of conversion between FAS2a–FAS2b
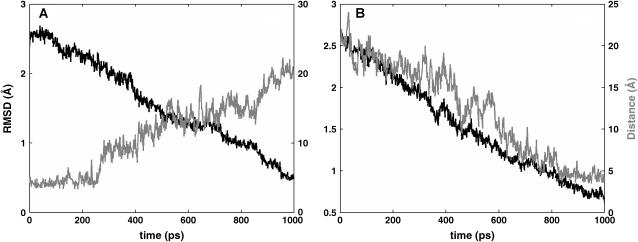
The submicrosecond MD trajectories have not overcome the free energy barrier between the FAS2a and FAS2b conformers, thus TMD trajectories were calculated to study the conformational transitions between these two stable substates and to estimate the free energy of transitions. Fig. 6, A and B, demonstrates the progress of TMD trajectories toward the target conformers. In TMD, the RMSD between the two conformers is often chosen as the reaction coordinate. As can be seen in Fig. 6, the RMSDs slowly decrease as the FAS2a converts to FAS2b and the corresponding trend can also be observed in the reverse direction. The distance between Thr-9 and Tyr-61 is also monotonically decreasing as the FAS2b is converted to the FAS2a. Conversely, the distance between Thr-9 and Tyr-61 lengthens when the FAS2a trajectory slowly converts toward the FAS2b. In addition, the figure shows the preferred distance between Thr-9 and Tyr-61 for each conformer, which is ∼5 Å for the FAS2a conformers and 20 Å for the FAS2b conformers. Thus, it is a useful reaction coordinate to depict the transitions between the two substates.
FIGURE 6.
Progress of transitions. Black line is the RMSD, and gray line is the distance between heavy atoms of T9:Cg and Y61:Cz. (A) Transitions from FAS2b to FAS2a and (B) transitions from FAS2a to FAS2b.
The configurational free energy that includes the internal energy terms, electrostatic contributions, and hydrophobic contributions for configurations along the chosen reaction coordinate was calculated with different bin widths of 0.5 Å, 1.0 Å, and 1.5 Å for transitions between FAS2a and FAS2b and that of the reverse direction. There is a considerable energy barrier (>10 kcal/mol) for transitions between these substates. Therefore, the submicrosecond apo-FAS2b trajectory has not overcome this high energy barrier.
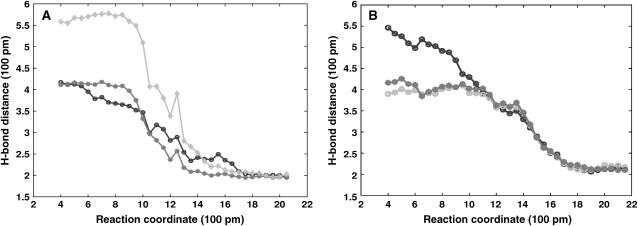
It is of interest to point out that the transitions from the FAS2a to the FAS2b conformers are highly correlated with the forming of three hydrogen bonds. Fig. 7 shows the correlations between hydrogen bond formation and conversion of FAS2a to FAS2b and vice versa. The interactions between the two β strands of loop I and loop II through two hydrogen bonds between the main chain atoms of His-6 and Arg-37 are disrupted when the FAS2b structures adopt the FAS2a conformers. In going from FAS2a to FAS2b, the imidazole ring of the His-6 side chain also moves from the solvent surface into the interior, where it makes the third hydrogen bond with the guanidino moiety of Arg-37.
FIGURE 7.
Correlation of hydrogen bonding to the transitions between conformers. Gray lines are contact distances between main chain atoms of His-6 of loop I and Arg-37 of loop II; black line is the distance between the H6:N and R37:N. (A) The H-bonding distance is averaged over 10 TMD of FAS2a to FAS2b trajectories and (B) those of the 20 TMD of FAS2b to FAS2a trajectories.
A possible mechanism of binding
The bimolecular association rate of FAS2 to AChE occurs in or near the diffusion-controlled regime (31). The conversions between the FAS2a and the FAS2b conformers appear to be slower than the typical diffusional encounter lifetimes (∼1 ns) expected for proteins in the absence of attractive interaction. Because FAS2a conformers may be the predominant apo forms, it would seem that these conformers must interact with AChE to form a stable complex within which the FAS2a conformation can change to FAS2b. The experimentally observed, slightly biphasic association kinetics of FAS with AChE at μM concentration (data not shown) also suggests a two-step, sequential reaction mechanism. To further investigate this, the free energies of association of FAS2a and FAS2b conformers to AChE were estimated (Table 2). The FAS2a-bound AChE model was obtained by docking a FAS2a conformer to AChE; the complex structure was then energy minimized to optimize favorable interactions between the FAS2a conformer and AChE. The final configuration of the complex was one in which loop II and III of the liganded FAS2a fit well to the crystallographic structure of the liganded FAS2. The tip of loop II (residues 28–32) of the liganded FAS2a still maintains favorable interactions with AChE, as observed in the crystallographic structure of the liganded FAS2b. The loop I of the liganded FAS2a is, however, significantly different (almost 6 Å) from that of the liganded FAS2b. The FAS2b-bound AChE complex is more stable than the FAS2a-bound complex (estimated free energy in solution, Table 2), but FAS2a is predicted to bind quite strongly.
TABLE 2.
Free energy of binding for the FAS2a-AChE and the FAS2b-AChE
| Molecule | 〈UMM〉* | 〈WPB〉† | 〈WNP〉‡ | 〈GMMPBSA〉§ |
|---|---|---|---|---|
| FAS2a | −1932 | −991 | 22 | −2901 |
| AChE | −17,310 | −5273 | 108 | −22,475 |
| FAS2a-AChE | −20,339 | −5185 | 118 | −25,406 |
| FAS2b | −1906 | −1006 | 23 | −2887 |
| AChE | −17,367 | −5266 | 108 | −22,525 |
| FAS2b-AChE | −20,411 | −5157 | 117 | −25,451 |
Molecular mechanic energy.
Electrostatic solvation energy.
Nonpolar solvation energy.
Molecular mechanics PB solvent accessible energy: GMMPBSA = UMM + WPB + WNP.
Graphical analysis of the FAS2a-bound complex shows that the tip of loop I of the liganded FAS2a no longer binds in a surface crevice behind the peripheral anionic site of AChE. The only contact between loop I of the liganded FAS2a and AChE is the salt bridge formation between FAS2a:Arg-11 and AChE:Asp-283. This interaction extends the side chain of FAS2a:Arg-11 to mimic the extension of loop I, whereas the FAS2b:Arg-11 interacts strongly with AChE:Glu-84 and other charged residues that belong to the outer portion of the long ω loop of AChE. In addition, the Thr-9 side chain no longer packs well against the hydrophobic pocket, as other hydrophobic residues such as AChE:Val-73 compete for the pocket (6,32). The distance between FAS2a:Thr-9 and FAS2a:Tyr-61 is also elongated by 3 Å. The binding free energy of the FAS2b-bound AChE complex is −39 kcal/mol and that of the FAS2a-bound AChE complex is −30 kcal/mol (neglecting the changes in translational and rotational entropy). Experimentally, both FAS1 and FAS2 bind to AChE with very high affinities (33,34). The estimated values from the molecular modeling are overestimated in comparison to the binding energy calculated from the equilibrium constants for FAS2 binding to AChE by Radic et al. (34). However, as noted, the binding free energies obtained here did not incorporate certain entropic contributions associated with the protein-protein binding, so that the estimations are not inconsistent with the experimental measurements.
CONCLUSION
Dynamic transitions of protein conformers were studied in atomic detail with reference to conformational variations both before and after protein association. Transitions from the FAS2a conformers to the FAS2b conformers involve strong interactions between β strands of loop I and loop II through hydrogen bonding between main chain atoms of His-6 and Arg-37. This brings the imidazole ring of His-6 to the proximity of the guanidino moiety of Arg-37, establishing an additional hydrogen bond. The FAS2b conformers seem to exist only in the liganded forms like the crystal structures of FAS2 cocrystallized with detergent (2) or FAS2 bound to AChE (5,6). Conformational substates of this highly flexible protein, including the secondary FAS2b conformations, have also been characterized. It can be expected that loop I would not change its conformation rapidly upon the diffusional encounter between FAS2 and AChE because of the high energy barrier between the two substates. However, the encounter complex formed by FAS2a and AChE appears to be sufficiently stable to allow switching from the FAS2a to the FAS2b conformation.
Acknowledgments
J.B. thanks Dr. Justin Gullingsrud, Dr. Donald Hamelberg, Ms. Jessica Swanson, and Dr. Kaihsu Tai for their invaluable discussions.
This project was supported in part by the National Institutes of Health, National Science Foundation, National Biomedical Computation Resource, the Howard Hughes Medical Institute, the San Diego Supercomputer Center, the National Science Foundation Center for Theoretical Biological Physics, and Accelrys.
References
- 1.Gabdoulline, R. R., and R. C. Wade. 2001. Protein-protein association: investigation of factors influencing association rates by Brownian dynamics simulations. J. Mol. Biol. 306:1139–1155. [DOI] [PubMed] [Google Scholar]
- 2.LeDu, M. H., P. Marchot, P. E. Bougis, and J. C. Fontecilla-Camps. 1989. Crystals of fasciculin 2 from green mamba snake-venom—preparation and preliminary-x-ray analysis. J. Biol. Chem. 264:21401–21402. [PubMed] [Google Scholar]
- 3.LeDu, M. H., D. Housset, P. Marchot, P. E. Bougis, J. Navaza, and J. C. Fontecilla-Camps. 1996. Structure of fasciculin 2 from green mamba snake venom: evidence for unusual loop flexibility. Acta Crystallogr. D Biol. Crystallogr. 52:87–92. [DOI] [PubMed] [Google Scholar]
- 4.LeDu, M. H., P. Marchot, P. E. Bougis, and J. C. Fontecilla-Camps. 1992. 1.9-Å resolution structure of fasciculin-1, an anti-acetylcholinesterase toxin from green mamba snake venom. J. Biol. Chem. 267:22122–22130. [DOI] [PubMed] [Google Scholar]
- 5.Bourne, Y., P. Taylor, and P. Marchot. 1995. Acetylcholinesterase inhibition by fasciculin: crystal structure of the complex. Cell. 83:503–512. [DOI] [PubMed] [Google Scholar]
- 6.Harel, M., G. J. Kleywegt, R. B. G. Ravelli, I. Silman, and J. L. Sussman. 1995. Crystal structure of an acetylcholinesterase-fasciculin complex: interaction of a three-fingered toxin from snake venom with its target. Structure. 3:1355–1366. [DOI] [PubMed] [Google Scholar]
- 7.Bui, J. M., K. Tai, and J. A. McCammon. 1995. Acetylcholinesterase: enhanced fluctuations and alternative routes to the active site in the complex with fasciculin-2. J. Am. Chem. Soc. 126:7198–7205. [DOI] [PubMed] [Google Scholar]
- 8.Ma, J. P., and M. Karplus. 1997. Molecular switch in signal transduction: reaction paths of the conformational changes in ras p21. Proc. Natl. Acad. Sci. USA. 94:11905–11910. [DOI] [PMC free article] [PubMed] [Google Scholar]
- 9.Diaz, J. F., B. Wroblowski, J. Schlitter, and Y. Engelborghs. 1997. Calculation of pathways for the conformational transition between the GTP- and GDP-bound states of the Ha-ras-p21 protein: calculations with explicit solvent simulations and comparison with calculations in vacuum. Proteins. 28:434–451. [PubMed] [Google Scholar]
- 10.Jorgensen, W. L., J. Chandrasekhar, J. D. Madura, R. W. Impey, and M. L. Klein. 1983. Comparison of simple potential functions for simulating liquid water. J. Chem. Phys. 79:926–935. [Google Scholar]
- 11.Cornell, W. D., P. Cieplak, C. I. Bayly, I. R. Gould, K. M. Merz Jr., D. M. Ferguson, D. C. Spellmeyer, T. Fox, J. W. Caldwell, and P. A. Kollman. 1995. A second generation force field for the simulation of proteins, nucleic acids, and organic molecules. J. Am. Chem. Soc. 117:5179–5197. [Google Scholar]
- 12.Berendsen, H. J. C., J. P. M. Postma, W. F. van Gunsteren, A. Dinola, and J. R. Haak. 1984. Molecular dynamics with coupling to an external bath. J. Chem. Phys. 81:3684–3690. [Google Scholar]
- 13.Greengard, L., and V. Rokhlin. 1987. A fast algorithm for particle simulations. J. Comput. Phys. 73:325–348. [Google Scholar]
- 14.de Hoon, M. J. L., S. Imoto, J. Nolan, and S. Miyano. 2004. Open source clustering software. Bioinformatics. 20:1453–1454. [DOI] [PubMed] [Google Scholar]
- 15.Hartigan, J. A., and M. A. Wong. 1979. A K-means clustering algorithm. Appl. Stat. 28:100–108. [Google Scholar]
- 16.de Groot, B. L., X. Daura, A. E. Mark, and H. Grubmuller. 2001. Essential dynamics of reversible peptide folding: memory-free conformational dynamics governed by internal hydrogen bonds. J. Mol. Biol. 309:299–313. [DOI] [PubMed] [Google Scholar]
- 17.Amadei, A., A. B. M. Linssen, and H. J. C. Berendsen. 1993. Essential dynamics of proteins. Proteins. 17:412–425. [DOI] [PubMed] [Google Scholar]
- 18.McCammon, J. A., and S. C. Harvey. 1987. Dynamics of Proteins and Nucleic Acids. Cambridge University Press, New York.
- 19.Massova, I., and P. A. Kollman. 1999. Computational alanine scanning to probe protein-protein interactions: a novel approach to evaluate binding free energies. J. Am. Chem. Soc. 121:8133–8143. [Google Scholar]
- 20.Sitkoff, D., K. A. Sharp, and B. Honig. 1994. Accurate calculation of hydration free-energies using macroscopic solvent models. J. Phys. Chem. 98:1978–1988. [Google Scholar]
- 21.Sanner, M. F., A. J. Olson, and J. C. Spehner. 1996. Reduced surface: an efficient way to compute molecular surfaces. Biopolymers. 38:305–320. [DOI] [PubMed] [Google Scholar]
- 22.Baker, N. A., D. Sept, S. Joseph, M. J. Holst, and J. A. McCammon. 2001. Electrostatics of nanosystems: application to microtubules and the ribosome. Proc. Natl. Acad. Sci. USA. 98:10037–10041. [DOI] [PMC free article] [PubMed] [Google Scholar]
- 23.Nguyen, D. T., and D. A. Case. 1985. On finding stationary states on large-molecule potential-energy surfaces. J. Phys. Chem. 89:4020–4026. [Google Scholar]
- 24.Srinivasan, J., T. E. Cheatham, P. Cieplak, P. A. Kollman, and D. A. Case. 1998. Continuum solvent studies of the stability of DNA, RNA, and phosphoramidate-DNA helices. J. Am. Chem. Soc. 120:9401–9409. [Google Scholar]
- 25.McQuarrie, D. A. 1976. Statistical Mechanics. Harper and Row, New York.
- 26.Guenneugues, M., P. Drevet, S. Pinkasfeld, B. Gilquin, A. Menez, and S. Zinn-Justin. 1997. Picosecond to hour time scale dynamics of a “three finger” toxin: correlation with its toxic and antigenic properties. Biochemistry. 36:16097–16108. [DOI] [PubMed] [Google Scholar]
- 27.Baker, N. A., V. Helms, and J. A. McCammon. 1999. Dynamical properties of fasciculin-2. Proteins. 36:447–453. [DOI] [PubMed] [Google Scholar]
- 28.Amadei, A., A. B. M. Linssen, B. L. deGroot, D. M. F. vanAalten, and H. J. C. Berendsen. 1996. An efficient method for sampling the essential subspace of proteins. J. Biomol. Struct. Dyn. 13:615–625. [DOI] [PubMed] [Google Scholar]
- 29.Becker, O. M. 1998. Principal coordinate maps of molecular potential energy surfaces. J. Comput. Chem. 19:1255–1267. [Google Scholar]
- 30.Marchot, P., A. Khelif, Y. H. Ji, P. Mansuelle, and P. E. Bougis. 1993. Binding of I-125 fasciculin to rat-brain acetylcholinesterase—the complex still binds diisopropyl fluorophosphate. J. Biol. Chem. 268:12458–12467. [PubMed] [Google Scholar]
- 31.Radic, Z., P. D. Kirchhoff, D. M. Quinn, J. A. McCammon, and P. Taylor. 1998. Electrostatic influence on the kinetics of ligand binding to acetylcholinesterase. Distinctions between active center ligands and fasciculin. J. Biol. Chem. 272:23265–23277. [DOI] [PubMed] [Google Scholar]
- 32.Bourne, Y., P. Taylor, and P. Marchot. 1995. Acetylcholinesterase inhibition by fasciculin—crystal-structure of the complex. Cell. 83:503–512. [DOI] [PubMed] [Google Scholar]
- 33.Marchot, P., Y. Bourne, C. N. Prowse, P. E. Bougis, and P. Taylor. 1998. Inhibition of mouse acetylcholinesterase by fasciculin: crystal structure of the complex and mutagenesis of fasciculin. Toxicon. 36:1613–1622. [DOI] [PubMed] [Google Scholar]
- 34.Radic, Z., R. Duran, D. C. Vellom, Y. Li, C. Cevenansky, and P. Taylor. 1994. Site of fasciculin interaction with acetylcholinesterase. J. Biol. Chem. 269:11233–11239. [PubMed] [Google Scholar]


