

Abstract
Objective
To determine the extent to which managed care has led to consolidation among hospitals and physicians.
Data Sources
We use data from the American Hospital Association, American Medical Association, and government censuses.
Study Design
Two stage least squares regression analysis examines how cross-section variation in managed care penetration affects provider consolidation, while controlling for the endogeneity of managed-care penetration. Specifically, we examine inpatient hospital markets and physician practice size in large metropolitan areas.
Data Collection Methods
All data are from secondary sources, merged at the level of the Primary Metropolitan Statistical Area.
Principal Findings
We find that higher levels of local managed-care penetration are associated with substantial increases in consolidation in hospital and physician markets. In the average market (managed-care penetration equaled 34 percent in 1994), managed care was associated with an increase in the Herfindahl of .054 between 1981 and 1994, moving from .096 in 1981 to .154. This is equivalent to moving from 10.4 equal-size hospitals to 6.5 equal-sized hospitals. In the physician market place, we estimate that at the mean, managed care resulted in a 14 percentage point decrease of physicians in solo practice between 1986 and 1995. This implies a decrease in the percentage of doctors in solo practice from 38 percent in 1986 to 24 percent by 1995.
Keywords: Managed care, consolidation, mergers, group practice, antitrust
There has recently been substantial consolidation among health-care providers in the United States. In 1980, most hospitals were freestanding, independent organizations. By 1996, 40 percent of all community hospitals were members of a system and 26 percent were members of networks (American Hospital Association 1998). In the mid-1980s, more than 40 percent of all physicians were in solo practice. By 1997, that figure had fallen to 26 percent (American Medical Association 1999). Most physicians now work in settings with several physicians, such as group practices, hospitals, or clinics.
It is tempting to suppose that this consolidation is the direct result of the growth of managed care. The two have certainly occurred at the same time. Whereas managed care in 1980 was largely limited to a few staff and group model Health Maintenance Organizations (HMOs) scattered around the nation, today nearly two hundred million Americans are enrolled in Managed Care Organizations (MCOs) spanning a wide range of organizational forms including HMOs, Preferred Provider Organizations (PPOs), and Point of Service plans (POSs) (Aventis 2000).
There are two strong reasons to believe that the growth of managed care might cause providers to consolidate. First, managed care rewards efficiency, and providers might achieve economies of scale and scope through merger. Second, in the face of selective contracting by MCOs, providers may consolidate to improve their bargaining power and opportunities to secure contracts at favorable rates.
Despite these considerations, it is hardly a prima facie case that managed care is the cause of consolidation; several other changes in the health-care economy might have led to it. The Medicare Prospective Payment System (PPS) rewards hospitals for efficiency, and may have also promoted mergers. At the same time, changes in treatment and management technology, such as advances in diagnostic techniques, and the introduction of computerized information systems, have led to new sources of scale economies that might also encourage mergers.
We take advantage of substantial cross-section variation in managed-care penetration to explore the effects of managed-care penetration on consolidation. In this way, our empirical strategy is similar to that used in a handful of other studies linking managed care to the organization of provider markets. For example, Baker and Brown (1999) and Spetz and Baker (1997) link managed care to increased concentration in the provision of mammograms and neonatal intensive care. Chernew (1995) finds that a 10 percent increase in HMO market share results in a 4 percent reduction in the number of hospitals and a 5 percent reduction in beds over the period from 1982 through 1987. Chernew does not explicitly address concentration, but his results are suggestive.
This study extends the prior literature in several ways. First, we examine physician markets as well as hospital markets. Second, we account for hospital system membership and examine a longer time series than previous studies. Third, we consider the impact of all forms of managed care, including PPOs and POSs, not just HMOs. Finally, we control for the endogeneity of managed- care. Our results strongly support the initial supposition: Managed care is associated with a substantial increase in concentration in hospital markets and a sharp decline in the number of solo physician practices. In fact, managed-care growth appears to explain essentially all the observed increase in hospital consolidation, as well as the shift away from solo physician practice.
The rest of this article: (1) discusses major features of managed care and presents our hypotheses; (2) explains data and methods (because managed care penetration is potentially endogenous, we adopt a two-stage estimation process); (3) reports our results as described above; and, (4) explores possible implications of our findings for market performance and public policy and discuss areas for future research.
Managed Care and Provider Integration
Providers may consolidate to increase efficiency and/or to increase their market power. First consider efficiency. Managed care places pressure on providers to reduce costs. Consolidation may facilitate cost-savings through economies of scale and the elimination of duplicative services. For example, hospitals may merge and then combine managerial or clinical departments to spread fixed capital costs and more efficiently use standby services (Lynk 1995). In some cases, two hospitals may merge and close one facility entirely. Merged hospitals may also enjoy improved access to capital markets (Levitz and Brooke 1985). Finally, managed care may prefer to contract with systems, to achieve the benefits of “one stop shopping” (Dranove and Shanley 1995).
Hospitals routinely forecast that they will realize large efficiency gains from mergers. It is certainly possible there are some economies of scale in individual hospitals (see, for example, Cowing et al. 1983; Frech and Mobley 1995; Wilson and Carey 2000). This suggests that smaller hospitals could economize by combining to form larger units (Conner et al. 1997). But many mergers create multihospital systems without any consolidation of facilities. There is, at best, mixed evidence that hospitals economize when they belong to such systems (Dranove and Shanley 1995; Ermann and Gabel 1984; Levitz and Brooke 1985; Menke 1997).
Physicians might also reduce costs through consolidation. Merging physicians may share fixed expenses for billing and clinical information systems. (Independent physicians could, of course, outsource these functions to physician practice management firms.) Physicians might merge to facilitate financial risk bearing, a consequence of combining capitation with the law of large numbers. Group practice may facilitate better coordination of services and use of diagnostic technology.
The growth of managed care might have also encouraged providers to consolidate to increase their market power. There was competition before managed care, but not the sort that necessarily harmed profits. For example, hospital reimbursement was historically cost-based, limiting the degree of price competition. Under cost-based reimbursement, hospitals in competitive markets may have engaged in what has been termed a “Medical Arms Race” (MAR), making costly investments in technology and amenities in an effort to attract physicians and patients (Robinson and Luft 1985). Insurers would pay higher rates, commensurate with the higher costs. As a result, mergers that reduced competition might reduce costs (Pak 1997), but would not improve profitability.
Managed Care Organizations do not pay costs. Instead, they selectively contract with those providers offering the most favorable rates. A provider who does not contract with an MCO faces the risk that the MCO will direct its patients to a competitor. Because patients prefer not to travel great distances to receive care (except perhaps for unusually complex treatments), the competitor must be in the same local market (McGuirk and Porell 1984; Mobley and Frech 2000; White and Morrisey 1998.) Thus, if a hospital can merge with a local competitor, it reduces the options available to MCOs, and enhances its bargaining power.
A number of studies show that hospital competition affects hospital pricing. Following the introduction of managed care in California in the 1980s, hospital price-cost margins and costs declined more in competitive, low concentration markets than in high concentration markets (Dranove, Shanley, and White 1993; Zwanziger and Melnick 1988). Likewise, managed care was able to achieve more favorable contracting terms in local markets with more competitive conditions (Melnick and Zwanziger 1992). Conversely, the literature suggests that hospital mergers may lead to higher prices (Gaynor and Vogt 1999; Melnick, Keeler, and Zwanziger 1999; Spetz, Seago, and Mitchell 1999). Moreover, this may be true even in large, seemingly competitive markets, for example when neighboring suburban hospitals merge (Capps et al. 2000) Taken collectively, these studies suggest that even in large metropolitan areas, hospital mergers can enhance market power.
If consolidation enhances the power of hospitals vis-à-vis MCOs, then the converse is also true. Namely, MCOs are harmed by hospital consolidation. This underlies antitrust concerns about the possible effects of mergers on competition, particularly that mergers may limit the growth of MCOs (U.S. Department of Justice 1992; U.S. Department of Justice and Federal Trade Commission 1994; Federal Trade Commission 1998). Consistent with this view, Dranove, Simon, and White (1998) (henceforth DSW), find that managed care has grown most rapidly in local markets where there is a greater potential for provider competition. In particular, managed-care penetration has been higher in metropolitan areas with low levels of concentration among hospitals and low hospital occupancy rates.
Market power is also becoming an issue in physician markets. Historically, the market for physician services was highly fragmented, due to the predominance of physicians in solo practice. Over time, group practices and employment in hospitals, freestanding clinics, and HMOs have replaced the solo practitioner. At the same time, new types of contractual arrangements have emerged, most notably Independent Practice Associations (IPAs) and Physician Practice Management Companies (PPMCs), designed to link independent physician practices into larger bargaining units (Burns et al. 2000). The IPAs and PPMCs can have hundreds or sometimes even thousands of physician members in their local markets, potentially enhancing the bargaining power of physicians relative to MCOs, raising possible antitrust concerns.1
To summarize, providers may merge in response to the growth of managed care, either to generate efficiencies, market their “brand,” or achieve market power. To the extent consolidation among hospitals and doctors forecloses competition in local markets, this may reduce the effectiveness of managed care as a cost containment mechanism and have a chilling effect on its growth. In the analysis that follows, we examine the extent to which these factors combine to lead to greater consolidation in the face of managed care.
Methods and Data
Empirical Model
In this research, we take advantage of geographic variations in managed-care penetration to explore its effects on consolidation. We estimate the effects of managed care on (a) hospital concentration in local markets, and (b) the size distribution of practices in local markets.
As a starting point for developing our empirical model, we begin with the following generic cross-section specifications:
| (1) |
| (2) |
where Y is the dependent variable, X is a predictor, B0 and B1 are parameters to be estimated, and t and t −1 denote time periods. If these relationships are correct, then the effect of X on Y is stable over time. If we subtract the latter 2 from the former 1, we get the following differenced relationship:
| (3) |
In this regression specification 3, we would include only differenced values of predictor variables on the right hand side.
Suppose instead that the correct equations for periods t and t−1 are:
| (4) |
| (5) |
In this specification, the effect of X on Y may change over time. If we difference the two equations while subtracting/adding B1tXt−1, we get:
| (6) |
Rearranging terms yields:
| (7) |
Equation 7 includes both differenced and initial level values of X on the right hand side. The coefficient on the differenced value in 7 indicates the cross-section effect of X on Y in period t. The coefficient on the initial level value indicates whether the effect of X on Y has changed over time. We are agnostic about whether to include differenced or initial levels of our predictors, so we try both. We report our best parsimonious models below. Our key results are not sensitive to permutations of the model.
In implementing the framework described above, we face a number of empirical issues that we now discuss.
Market Definition
Our unit of analysis is a local geographic market. There are a number of possible ways to define local markets, including geopolitical units (e.g., states, Primary Metropolitan Statistical Areas [PMSAs], or counties), or based on an analysis of patient flow patterns (see, for example, Garnick et al. 1987; Zwanziger and Melnick 1988). We define local markets to be counties aggregated into PMSAs.2 We recognize that PMSAs may not ideally capture local market patterns. It might be preferable to use market definitions based on other geographic boundaries (e.g., zip codes) or on patient flow data. However, we note that there is no general agreement about how to use patient flow data to define local markets. Capps et al. (2000), for example, show that markets defined using traditional patient flow analysis can paint a misleading picture of hospital market power. We believe PMSAs provide a useful starting point for analysis.
There are two practical reasons to define markets as PMSAs. First, our data on hospital concentration are readily available to us at the PMSA level. It would be extremely burdensome to construct hospital markets based on patient flow data, and it would be essentially impossible to construct our key predictors to match the resulting markets. Second, we base our measures of physician practice on a survey, described below, for which analysis of large PMSAs is appropriate. Thus, we focus specifically on large PMSAs and restrict our analysis to the top 68 PMSAs in population. Managed-care growth typically has been concentrated in larger PMSAs, so this sample captures areas that have experienced particularly high levels of managed-care penetration. At the same time, there is still considerable variation in penetration rates in our sample. For purposes of comparability, we also report our results for hospitals in these PMSAs as well.
Measuring Hospital Concentration
To measure hospital concentration, we use a Herfindahl index computed at the PMSA level using admissions data from the American Hospital Association's (AHA) annual survey of hospitals for 1981 and 1994.3 When computing the Herfindahl, we treat hospitals in the same PMSA belonging to the same system (based on AHA system codes) as a single entity. As reported in Table 1, the mean Herfindahl in a sample of PMSAs was .096 in 1981 and .125 in 1994. We define CHANGE HOSPITAL CONCENTRATION in a PMSA to be the difference between the 1981 and 1994 Herfindahls. The mean value of CHANGE HOSPITAL CONCENTRATION is .030. Although this seems small, the implication is that the mean change in the “numbers of hospitals equivalent” was from 10.5 hospitals in 1981 to just 8 in 1994.4
Table 1.
Means and Standard Deviations
| SMS Sample | ||
|---|---|---|
| Variable | Mean | Std. Dev. |
| CHANGE HOSPITAL CONCENTRATION (1981–94) | .030 | .029 |
| HOSPITAL HERF 81 | .0958 | .0504 |
| HOSPITAL HERF 95 | .1255 | .0605 |
| CHANGE MD SOLO (1986–1994) | −.14 | .10 |
| SOLO MD 1986 | .38 | .12 |
| SOLO MD 1995 | .24 | .09 |
| CHANGE MD 2-10 (1986–1995) | .02 | .13 |
| MD 2-10 1986 | .30 | .13 |
| MD 2-10 1995 | .32 | .11 |
| CHANGE MD GE26 (1986–1995) | −.01 | .03 |
| MD GE26 1986 | .03 | .04 |
| MD GE26 1995 | .02 | .02 |
| CHANGE MD INSTITUTION (1986–1995) | .15 | .10 |
| MD INSTITUTION 1986 | .07 | .05 |
| MD INSTITUTION 1995 | .22 | .10 |
| CHANGE MD HMO (1986–1995) | .03 | .03 |
| MD HMO 1986 | .01 | .02 |
| MD HMO 1995 | .04 | .04 |
| MC PENETRATION (1993/94) | 33.95 | 10.58 |
| POPULATION (1992) (1,000s) | 2,062 | 2,420 |
| d_POPULATION (1980–1992) | 1.18 | .172 |
| INCOME90 | 21.353 | 2.81 |
| d_INCOME (1980–1990) | 1.13 | .17 |
| p_OLD (1990) | 12.16 | 3.09 |
| d_OLD | 2.52 | 1.12 |
| p_URBAN (1990) | 84.98 | 10.10 |
| d_URBAN | 0.63 | 1.13 |
| p_BIG FIRM(1992) | 0.06 | 0.02 |
| p_SELFEMPLOYED (1990) | 6.12 | 1.11 |
| HOSPITAL OCCUPANCY (1980) | 78.38 | 5.07 |
Overall, the most important factor affecting local concentration has been the combination of hospitals into systems with more than one hospital in a market. Our data indicates that nearly a quarter of all urban hospitals in 1994 belonged to a system that had at least one other hospital in the same PMSA. Only a small portion of the increase in the Herfindahl can be attributed to closures. Over the period of our study, the number of hospitals in the U.S. has remained relatively stable, declining by only about 6 percent, with disproportionately many of the closures occurring in rural markets we do not study (National Center for Health Statistics 1998).
Measuring Changes in Physician Practice Organization
We draw our data on physician practice size from the AMA Socioeconomic Monitoring System (SMS) for the years 1986–1995. The SMS is based on an annual telephone survey of active patient-care physicians. We use data on nonfederal patient-care physicians, including both primary-care physicians and specialists. We measure practice size in a number of ways, including whether physicians are in private solo practice. We also examine groups of various sizes as well as institutional employment. We would also like to like to evaluate trends in physician involvement in IPAs and related organizations, but lack adequate time series data to do so.5
We measure SOLO86 as the percentage of active patient-care physicians in solo practice in 1986. We define SOLO95 in an analogous manner. We let CHANGE MD SOLO equal the difference between SOLO95 and SOLO86. As shown in Table l, the mean value of SOLO86 was .38 and the mean value of SOLO95 was .24. The mean value of CHANGE MD SOLO was –.14. That is, on average the percentage of physicians in solo practice in a market in our sample fell by 14 percentage points.
We also examine changes in the percentage of physicians in other practice settings. As shown in Table 1, the share of physicians in groups with 2 to 10 members rose slightly from .30 to .32 between 1986 and 1995, while the share of physicians employed in institutions, defined here as hospitals, universities, and freestanding clinics, rose from .07 to .22. During the same period, the share employed by HMOs grew from .01 to .04 percent. The share of physicians in large group practices with greater than or equal to 26 physicians fell from .03 to .02.
Measuring Managed-Care Penetration
There are many possible ways to define managed care and measure its penetration. Consistent with DSW, we define managed care to include all forms of insurance that feature selective contracting with providers. This includes all forms of HMOs as well as PPOs, IPAs, and POS plans, but excludes indemnity insurance that has only utilization review. We use the average share of physician revenue from managed-care contracts as our measure of managed-care penetration. This provides an indicator of the overall share of physician resources directed to managed-care patients.6
To measure managed-care penetration at the end of the study period, we use data on physicians contracting with managed care in 1993–94. Data are, again, drawn from the AMA SMS.7 We assume that physicians who report that they are employed by HMOs derive 100 percent of their income from managed care. For all other physicians who are at least part owner of their practices, the SMS survey queries participation in managed-care contracts and the percentage of practice revenue coming from these contracts.
We average the percentages across all physicians in the PMSA who responded to the survey to compute MCPENETRATION. We combine survey responses from 1993 and 1994 to increase the number of respondents. In addition, we weight MCPENETRATION to adjust for known sources of nonresponse bias (i.e., specialty, age, AMA membership, and region). As shown in Table 1, the mean of MC PENETRATION in our sample was 33.9 percent, with a range of 7.3 percent to 59.5 percent.
We lacked a direct measure of managed-care penetration at the start of the study period. In most areas of the country, managed-care penetration was minimal in 1981 or even 1985. In these areas, using managed-care penetration in 1993–94 is equivalent to measuring the growth of penetration since the early 1980s. We use this approach here to estimate the change in managed-care penetration over the study period. Specifically, we approximate the change in managed-care penetration by assuming penetration is zero in the base period and using penetration in the final period as a measure of the change.
In a few areas of the country there was a substantial HMO presence in the early 1980s: notably, parts of California, Minnesota, and Washington, DC. In these areas, it is possible that managed care may already have affected provider market structure by 1985. To explore potential biases that may be introduced by using 1993–94 managed-care penetration as a measure of the change in penetration, we drop areas with high managed-care penetration in the early 1980s. We have no data on total MCO penetration for this period, so we rely on HMO penetration as an indicator. This seems reasonable, as non-HMO managed care was minimal at that time. There are no data on HMO penetration at the PMSA level for the early 1980s, so we use HMO penetration at the state level. To evaluate the robustness of our results we reestimated all of the reported regressions excluding PMSAs located in states with HMO penetration exceeding 5 percent in 1985.8
Assessing the Impact of Managed Care
We need to isolate the effects of managed care on consolidation from other factors that might affect consolidation, for example, through their effects on the demand for medical services. We expect the number of hospitals to increase (and the Herfindahl to decrease) with factors that increase local demand, such as population growth, and certain changes in the demographic and socioeconomic characteristics of the population.
We also must deal with a potential causality problem. We hypothesize that managed care can affect provider market structure. But as described by DSW, managed-care penetration may be a function of provider market structure. Specifically, penetration may be higher in markets that have more hospitals and more physician groups, both of which may facilitate the implementation of managed-care strategies. To resolve the causality problem, we instrument for managed-care penetration. For instruments, DSW suggest using lagged supply variables to capture market conditions predating managed-care growth, as well as variables reflecting the structure of labor markets.
A related empirical issue is the potential impact of the PPS on provider market structure. Recall that hospital competition under the MAR may have created inefficiencies. The PPS rewarded hospitals that increased efficiency. It is possible that these rewards would be highest in the most competitive markets, where the MAR may have led to the highest costs. At the same time, these competitive markets may also have been more attractive to managed care. We lack data here to attempt to directly disentangle the possible effects of the PPS. As a result, looking at managed care alone may overstate its effects. To the extent that we successfully instrument for MCO penetration, we minimize any potential omitted variable bias.
Empirical Models
Our basic empirical models are described below. Letting the subscript m denote the market, our basic model for hospitals is:
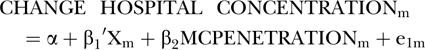 |
(8) |
| (9) |
In this model, CHANGE HOSPITAL CONCENTRATIONm is a function of local managed-care penetration, MCPENETRATIONm, and a vector of variables controlling for levels or changes in market conditions, Xm. Managed-care penetration itself is hypothesized in equation (9) to be a function of Xm and Zm, a vector of variables that serve to identify MCPENETRATIONm. Estimated values of MCPENTRATION from our first stage equation (9) are used to estimate our second stage equation (8).
We estimate the same basic model for physicians. We hypothesize that higher managed-care penetration is associated with a reduction in the share of physicians in solo practice. By definition, this will lead to an increase in the share of physicians in nonsolo practice. This may be reflected in a movement by physicians into medium as well as large practices and also institutional or HMO employment.
Specifically, we examine the following measures of practice size:
CHANGE MD SOLO: The change in the percentage of physicians in solo practice between 1986 and 1995.
CHANGE MD 2-10: The change in the percentage of doctors in groups with 2 to 10 physicians.
CHANGE MD GE26: The change in the percentage in groups with greater than or equal to 26 physicians.
CHANGE MD INSTITUTION: The change in the percentage of physicians employed in hospitals, universities, and free-standing clinics.
CHANGE MD HMO: The change in the percentage of physicians employed by staff and group HMOs.
Other Market Conditions
We consider a number of sociodemographic variables that have been linked to the demand for health-care services or are suitable for identifying the first-stage managed-care penetration equation. In the discussion below, we begin by describing the variables that we include as control variables in our second stage estimates. We then describe variables included in our first stage estimates, but excluded in our second stage estimates; these serve as identifiers for our second stage equations.
The years for which the data are drawn are indicated in parentheses. Change values are denoted by d_variable names; p_variable names indicate variables reported in percentages. All changes are computed to be percent changes. When the levels of variables are already expressed as percentages, the change is computed to be the nominal percentage point difference.
The following change variables are included as controls in our second stage estimates of equation (9) and in our regressions of changes in physician practice patterns.
d_POPULATION: The change in PMSA population between 1980 and 1992.
d_INCOME: Percentage change in Median Household income between 1980 and 1990.
d_OLD: The change in percentage of PMSA population over age 65 between 1980 and 1990.
d_URBAN: The change in the percentage of the PSMA's population in urbanized areas between 1980 and 1990.9
The differenced variables d_POPULATION, d_INCOME, d_OLD, and d_URBAN are all hypothesized to be positively associated with increases in demand and lower concentration in equation (9). We also explore the possibility that effects may vary with overall market size by including a level variable for PMSA population size:
POPULATION92: PMSA population in 1992.
Identifiers Excluded from Second Stage Estimates:
Following DSW, we hypothesize that both demand and supply conditions may be used as identifiers in our first stage estimates. On the demand side, the following variables are included as identifiers of MCPENETRATION and we exclude them from our second stage equations:
p_BIG FIRM: Percentage of workers in PSMA in 1992 employed in firms with more than five hundred employees where firm size is measured by the nationwide number of workers employed by a firm.10
p_SELF EMPLOYMENT: The percentage of workers in PMSA who were self-employed in 1990.
Both BIG FIRM and SELF EMPLOYMENT are hypothesized to be good potential identifiers of managed-care penetration because they are related to the organization of the market for managed care but are otherwise unlikely to affect provider incentives to restructure.
We also follow DSW in including lagged supply side variables as potential identifiers of managed-care penetration:
HOSPITAL HERF: The Herfindahl index for hospitals in 1981. We use this as an identifier in examining changes in physician practice patterns. However, we exclude it in examining hospital concentration because the hospital Herfindahl for 1981 is used in computing the dependent variable, CHANGE HOSPITAL CONCENTRATION, and is therefore potentially correlated with our dependent variable.
HOSPITAL OCCUPANCY: Average hospital occupancy rate in the PMSA in 1980. We use this as an identifier in examining changes in physician practice patterns. However, because of the same concerns above, we exclude this hospital related variable in examining changes in hospital concentration.
SOLO86: The percentage of physicians in solo practice in PMSAs for 1986. We use this as an identifier in examining changes in hospital concentration. However, we exclude it in examining physician practice patterns because this variable is used in computing the dependent variables measuring changes in practice patterns.11
Following DSW, we hypothesize that managed-care penetration will be higher in markets that have less hospital concentration and lower hospital occupancy rates (increasing opportunities for introducing price competition), and in markets with fewer physicians in solo practice (reducing MCO contracting costs).
We also include the following additional level variables below in equation (9):
INCOME90: Median household income in 1990.
p_URBAN90: The percentage of PSMA's population in urbanized areas in 1990.
These level variables could potentially also be included as controls in equation (8). However, we exclude them for reasons of parsimony.
Estimation
The number of physician respondents to the SMS varies across PMSAs. As a result, the magnitude of the errors in Ordinary Least Squares (OLS) regressions is significantly inversely correlated with the number of respondents at the PMSA level. Thus, we employ weighted least squares, weighing the regressions by the number of physician respondents to the SMS.12
Results
Changes in Hospital Concentration
Table 2 reports our second stage two-stage least squares (2SLS) results for changes in hospital concentration. Regression 1 reports the second stage 2SLS regressions using only change variables as predictors. Regression 2 includes POPULATION92. Regression 3 excludes PMSAs located in states that had HMO penetration of 5 percent or above in 1985.
Table 2.
PMSA Level Regressions CHANGE HOSPITAL CONCENTRATION (standard errors in parentheses) (weighted least squares)
| Variable | REGRESSION 1: 2SLS | REGRESSION 2: 2SLS | REGRESSION 3: 2SLS |
|---|---|---|---|
| Constant | −0.0287 (0.0266) | −0.0299 (0.0271) | −0.0301 (0.0359) |
| MC PENETRATION (1993/94) | 0.0017* (0.005) | 0.0018* (0.005) | 0.0020* (0.006) |
| POPULATION92 | — | −0.0426 (0.1065) | — |
| d_POPULATION | −0.0255 (0.1211) | −0.0302 (0.0719) | −0.0273 (0.1264) |
| d_INCOME | −0.0361 (0.0277) | −0.0305 (0.0223) | −0.0299 (0.0316) |
| d_URBAN | −0.0082** (0.0039) | −0.0094** (0.0043) | 0.0070** (0.0033) |
| d-OLD | 0.0027 (0.0038) | 0.0041 (0.0030) | 0.0059 (0.0038) |
| Adjusted R2 | .14 | .16 | .17 |
| N | 68 | 68 | 63 |
= significant at 1% level,
= significant at 5% level,
***= significant at the 10% level.
In Regression 1, the coefficient on MC PENETRATION is positive and statistically significant at p<.01. This implies that managed-care penetration is related to observed hospital consolidation in the large PMSAs in our sample. (We talk about the magnitude of this relationship in the discussion section.) More urban markets tend to be less consolidated: d_URBAN has a negative coefficient and is significant at p<.05 or better.
Results are similar when we control for population and when we limit the analysis to states with low baseline MCO penetration.13
Changes in Physician Practice Patterns
Table 3 reports the estimates of equation (1) for various physician practice setting variables. In Regression 1 the dependent variable is CHANGE MD SOLO. The decline in solo practice is largest in markets with higher levels of MC PENETRATION. There is also a statistically significant positive association with d_INCOME and a statistically significant negative association with d_OLD, p<.05.14
Table 3.
PMSA Level Regressions of Changes in Physician Practice Patterns (standard errors in parentheses) (weighted least squares)
| Variable | REGRESSION 1: 2SLS CHANGE MD SOLO | REGRESSION 2: 2SLS CHANGE MD 2-10 | REGRESSION 3: 2SLS CHANGE MD GE 2c | REGRESSION 4: 2SLS CHANGE MD INS | REGRESSION 5: 2SLS CHANGE MD HMO |
|---|---|---|---|---|---|
| Constant | −.0354 (0.148) | −0.0422 (0.091) | −0.062 (0.049) | 0.388* (0.145) | b |
| MC PENETRATION (1993/94) | −0.004** (0.002) | −0.002 (0.003) | 0.065 (0.062) | −0.002 (0.0017) | 0.003* (0.0006) |
| d_POPULATION | −0.061 (0.104) | −0.033 (0.137) | −0.011 (0.049) | −0.109 (0.090) | −0.011 (0.04) |
| d_INCOME | 0.1898** (0.083) | −0.005 (0.06) | −0.022 (0.0191) | −0.044 (0.063) | 0.0014 (0.02) |
| d_URBAN | −0.0097 (0.0169) | −0.012 (0.019) | −0.005 (0.006) | 0.062 (0.129) | 0.0091*** (0.005) |
| d_OLD | −0.204** (0.09) | 0.020 (0.017) | −0.091 (0.078) | −0.046 (0.122) | 0.0023 (0.004) |
| Adjusted R2 | 0.09 | 0.01 | 0.01 | 0.02 | .40 |
| N | 68 | 68 | 68 | 68 | 68 |
= significant at 1% level,
= significant at 5% level,
= significant at the 10% level.
We are largely unable to link managed care with any clear pattern in the types of practice settings into which solo physicians are moving. Regressions 2, 3, and 4 respectively report regressions of CHANGE MD 2-10, CHANGE MD GE26, and CHANGE MD INS. None of the independent variables in these regressions are significant and overall explanatory power is low.15 16 Regression 5 reports that there is a positive and significant relationship between managed-care growth and CHANGE MD HMO, the percentage of physicians employed in staff and group HMOs. Indeed, we would be concerned if our results were otherwise and view these limited findings as a basic test that our data are able to capture changes in physician organization. In unreported regressions, we find similar findings when these regressions are estimated for our sample excluding PMSAs in states with HMO penetration greater than 5 percent in 1985.
Table 4 reports the results of first stage 2SLS regressions for the second stage regressions reported in Tables 2 and 3. These regressions share the same variables except for HOSPITAL HERF, HOSPITAL OCCUPANCY, and SOLO86. The first stage for regressions of CHANGE HOSPITAL CONCENTRATION in Table 2 is reported in Regression 1 and excludes HOSPITAL HERF, HOSPITAL OCCUPANCY. The first stage for regressions in Table 3 examining physician practice organization is reported in Regression 2 and includes this variable, but excludes SOLO86. Results are consistent with those reported in DSW.
Table 4.
First Stage Regression Managed-care Penetration (standard errors in parentheses) (weighted least squares)
| Variable | REGRESSION 1: (First Stage Hospital Concentration) | REGRESSION 2: (First Stage MD Practice Patterns) |
|---|---|---|
| Constant | −26.01 20.07 | −48.21 (43.60) |
| POPULATION92 | −7.02** (3.99) | 2.95* (3.63) |
| d_POPULATION | 22.07** (9.41) | 18.74 (10.88) |
| INCOME90 | 0.0004 (0.0006) | −.0003 (.0005) |
| d_INCOME | −7.22 (7.09) | −.3562 (10.45) |
| p_URBAN90 | 0.511* (0.159) | .4857** (.1843) |
| d_URBAN | 0.380 (1.16) | 1.87 (1.37) |
| d_OLD | −1.582 (1.47) | −2.66*** (1.51) |
| p_BIG FIRM | 115.97*** (64.96) | 134.17* (63.31) |
| p_SELFEMPLOYED | 1.63 (1.01) | 2.17 (1.35) |
| HOSPITAL HERF 81 | — | −0.2917 (0.3626) |
| HOSPITAL OCCUPANCY | — | −0.1969 (0.3760) |
| SOLO86 | −31.17* (12.38) | — |
| Adjusted R2 | .42 | .38 |
| N | 68 | 68 |
= significant at 1% level,
= significant.
Discussion
We find that higher levels of local managed-care penetration are associated with substantial increases in consolidation in hospital markets. The measured effects are substantial. We estimate that in the average market (for which managed-care penetration was approximately 34 percent in 1994), managed care was associated with an increase in the Herfindahl of about .058 between 1981 and 1994. For the average market that had a Herfindahl of .096 in 1981, this implies that the Herfindahl would increase to .154. This is equivalent to moving from 10.4 equal-sized hospitals to 6.5 equal-sized hospitals, which exceeds the actual measured consolidation in the data. Thus, the growth of managed care created pressure for consolidation that more than offset all remaining factors, such as income growth and demographic and regulatory changes, that would have otherwise caused an increase in the number of hospitals in the average market. (Medicare PPS may have also played a role in encouraging consolidation in some or all markets. Examining this force for consolidation would be an interesting avenue for future research.)
For a market in which managed-care penetration in 1993–1994 was two standard deviations above the mean, managed care was associated with a .094 increase in the level of the Herfindahl. This implies an increase in the Herfindahl to .1900 by 1994, which is equivalent to a moving from 10.4 equal size hospitals in a market to 5.3 equal size hospitals.
In the physician market place, we find managed care is associated with a sharp decline in solo practice. At the mean, managed-care growth resulted in a 14-point decrease in the percentage of physicians in solo practice between 1986 and 1995. For the average market, this implies a decrease in the percentage of doctors in solo practice from 38 percent in 1986 to 24 percent by 1995. Thus, managed care fully explains the observed shift out of solo practice. In a market with a level of managed-care penetration two standard deviations above the mean, our estimates imply a decrease of 22 percentage points. At the sample mean, this is a decline from 38 percent of physicians in solo practice in 1986 to 16 percent 1995. Except for the growth of employment in HMOs, our findings do not suggest any clear pattern regarding the types of practice setting into which physicians are moving.
We conclude that managed care is a powerful driver of consolidation in both hospital and physician markets. These findings raise important questions about the forces leading to provider restructuring. We have suggested that managed care could lead to consolidation for both efficiency and strategic reasons. A direct test of the degree to which efficiency versus market power considerations drive consolidation is beyond the scope of this paper. However, we can comment on some the issues raised by our findings and some of their possible implications.
To the extent consolidation has been driven by efficiency concerns, our results suggest managed care is working as envisioned by its protagonists. For physicians, there are some strong efficiency reasons for moving out of solo practice and into larger settings. Examples include economies of scale in information systems, risk sharing, and contracting. At the same time, the markets considered in this analysis are relatively large. Given that there is no evidence that managed care is associated with growth in very large practices (e.g., greater than 25 physicians), this suggests that efficiency rather than strategic considerations may play a dominant role in recent trends away from solo practice for the market areas considered in this paper. Strategic considerations could, however, be very important in smaller markets, which we do not consider here, and in the context of new organizational forms, such as IPAs. This is an interesting area for future research.
Hospital consolidation has also been justified on efficiency grounds. As discussed, however, evidence of efficiency gains resulting from hospital mergers is mixed (Conner et al. 1997; Dranove and Shanley 1995; Ermann and Gabel 1984; Levitz and Brooke 1985; Menke 1997). At the same time, mergers have been associated with higher prices and costs (Gaynor and Vogt 1999; Melnick, Keeler, and Zwanziger 1999; Spetz, Seago, and Mitchell 1999), and there have been growing antitrust concerns about the effects of consolidation in the hospital industry. Our findings suggest that the average market with high managed-care penetration (two standard deviations above the mean) would experience an increase in its Herfindahl to 1900 during the study period. A Herfindahl of .1800 or greater is considered “highly concentrated” under U.S. Department of Justice and Federal Trade Commission (1994) merger guidelines.
Whatever the forces driving consolidation, if consolidated hospitals are more resistant to MCO discounting, this may limit managed care's future ability to use selective contracting to constrain costs. Key areas for future research include how consolidation is affecting the operation of managed care and its patterns of growth.
Notes
See, for example, Montana Associated Physicians Inc., Billings Physician Hospital Alliance Inc., Consent Order to Cease and Desist, FTC File No. 911-0008; U.S. v. Mesa County Physicians Independent Practice Association, FTC Docket No. 9284.
The geographic boundaries of PMSAs change over time. We use 1983 definitions. When possible, we construct PMSA-level variables by using data for the counties that comprised the PMSA as defined in 1983.
The Herfindahl is the sum of squared market shares. We use 1994 data to be consistent with our measure of managed care penetration, which is for 1993–1994.
If H represents the Herfindahl, then the “number of firms equivalent” of a Herfindahl is 1/H. This stems from the fact that in a market that is evenly divided among N firms, the Herfindahl will equal 1/N.
Physician contracts with IPAs are not identified in our data until the early 1990s.
Other possible types of measures of managed-care penetration are estimates of the share of the population enrolled in MCOs either from plan data or from market surveys. An interesting issue that we do not attempt to explore in this research is whether the impact of managed care varies by plan type, for example HMOs versus PPOs.
Because our measures of physician practice characteristics in 1995 also come from the AMA SMS, we use 1993–1994 data to avoid problems which could arise from using data from the same sample period for both variables.
Specifically, we exclude five PMSAs from our sample: the District of Columbia, three PMSAs in California, and one in Minnesota.
PMSAs are defined using county level data and may include nonurbanized areas based on zip code level data.
Estimates draw on unpublished data provided by the U.S. Department of Commerce, which are based on Internal Revenue Service reports, an annual survey of firms, and the 1992 Census of Manufacturers. In some cases, for confidentiality reasons, data were reported as ranges. In these cases, we used the mean value of the range.
In unreported regressions, we also estimated regressions using only BIG FIRM, SELF EMPLOYMENT, p_URBAN90, and INCOME90 as identifiers. Our findings are robust for this specification.
In unreported regressions, we also estimate all the two-stage analyses reported here without weights. The magnitude of findings is somewhat smaller, but results are robust. We also estimated OLS regressions of our second stage models for two cases: (1) with weights; and (2) without weights, using White standard errors. Results are similar to those reported for two stage estimates.
As discussed, to maintain comparability with our analysis of physician data, we limit our sample to hospitals in the top 68 PMSAs by population size. In regression results reported as an appendix to this paper at http://www.hrs.org, we extended our analysis of hospitals to examine three additional cases—the top 130, the top 208, and the top 275 PMSAs respectively. We continue to find a strong association between managed care and consolidation. The magnitude of the coefficient of MC PENETRATION remains quite stable for our samples of 130 and 208 PMSAs—.0017 when there are 130 and .0018 when there are 208. When the top 275 PMSAs are included, this coefficient declines somewhat to .0012. At least two factors may help explain this decline: (1) antitrust policy—during the study period a number of mergers were successfully challenged in smaller markets; (2) data may be noisier in markets where there are only a few hospitals.
In unreported results, we also included POPULATION92 as a variable in our second stage estimates of this regression and regressions 2, 3, and 4 below. In all cases, our results are robust and including this variable does not substantially alter our findings.
In addition to reported regressions, in unreported results, we combined CHANGE MD 2-10 and CHANGE MD GE26 into a single variable for physicians in groups of 2 or more.
Results are also robust when we exclude PMSAs in states with high levels of HMO penetration in 1985.
We are grateful to the Agency for Healthcare Research and Quality (AHRQ) for support of this research under AHCPR Grant # R01 HS09210. We thank Min Guo and the American Hospital Association (AHA) for providing data on hospitals used in this research. We would like to thank participants in Harvard/Boston University/MIT Joint Health Economics Seminar and sessions at the annual meetings of the American Economics Association and American Public Health Association and two anonymous referees for comments. The opinions expressed in this paper are, however, the authors. They do not necessarily reflect the positions or policies of AHRQ or the AHA.
References
- American Hospital Association. Hospital Statistics: 1998 Edition. Chicago: Healthcare InfoSource; 1998. [Google Scholar]
- American Managed Care Research Association (AMCRA) 1994–1995 Managed Health Care Overview. Washington DC: American Managed Care Research Association; 1995. [Google Scholar]
- American Medical Association. Physician Marketplace Statistics 1997/98. Chicago: Center for Health Policy Research American Medical Association; 1999. [Google Scholar]
- Aventis . Managed Care Trends Digest 2000. Parsippany NJ: Aventis; 2000. [Google Scholar]
- Baker LC, Brown ML. “Managed Care, Consolidation among Health Care Providers and Health Care: Evidence from Mammography.”. The RAND Journal of Economics. 1999;30(2):351–74. [PubMed] [Google Scholar]
- Burns L, Bazzoli G, Dynan L, Wholey D. “Impact of HMO Market Structure on Physician–Hospital Strategic Alliances.”. Health Services Research. 2000;35(1):101–32. [PMC free article] [PubMed] [Google Scholar]
- Capps C, Dranove D, Greenstein S, Satterwaite M. University of Illinois; 2000. “Consumer Travel and Geographic Market Definition: An Application to Hospital Mergers.”. [Google Scholar]
- Chernew M. “The Impact of Non-IPA HMOs on the Number of Hospitals and Hospital Capacity.”. Inquiry. 1995;32(2):143–54. [PubMed] [Google Scholar]
- Conner R, Feldman R, Dowd B, Radcliff T. “What Types of Mergers Save Consumers Money?”. Health Affairs. 1997;16(6):62–74. doi: 10.1377/hlthaff.16.6.62. [DOI] [PubMed] [Google Scholar]
- Cowing T, Holtmann A, Powers S. “Hospital Cost Analysis: A Survey and Evaluation of Recent Studies.”. Advances in Health Economics and Health Services Research. 1983;4:257–303. [PubMed] [Google Scholar]
- Dranove D. “Economies of Scale in Non-Revenue Producing Cost Centers: Implications for Hospital Mergers.”. Journal of Health Economics. 1998;17(1):53–68. doi: 10.1016/s0167-6296(97)00013-1. [DOI] [PubMed] [Google Scholar]
- Dranove D, Shanley M. “Cost Reductions or Reputation Enhancement as Motives for Mergers: The Logic of Multihospital Systems.”. Strategic Management Journal. 1995;16:55–74. [Google Scholar]
- Dranove D, Shanley M, White WD. “Price and Concentration in Hospital Markets: The Switch from Patient-Driven to Payor-Driven Competition.”. Journal of Law and Economics. 1993;36(1 Pt 1):179–204. [Google Scholar]
- Dranove D, Simon C, White WD. “Determinants of Managed Care Penetration.”. Journal of Health Economics. 1998;17(6):729–46. doi: 10.1016/s0167-6296(97)00045-3. [DOI] [PubMed] [Google Scholar]
- Ermann D, Gabel J. “Multihospital Systems: Issues and Empirical Findings.”. Health Affairs. 1984;3(1):50–64. doi: 10.1377/hlthaff.3.1.50. [DOI] [PubMed] [Google Scholar]
- Federal Trade Commission, et al., vs. Tenet Healthcare Corp., et al. D9289 No 98-3123EML 17 F Supp 2d. 937 E D Mo 1998
- Frech HEII, Mobley L. “Resolving the Impasse on Hospital Scale Economies.”. Applied Economics. 1995;27:279–91. [Google Scholar]
- Garrnick D, Luft H, Robinson J, Tetreault J. “Appropriate Measures of Hospital Market Areas.”. Health Services Research. 1987;22(2):69–89. [PMC free article] [PubMed] [Google Scholar]
- Gaynor M, Vogt W. Antitrust and Competition in Health Care Markets. Cambridge MA: National Bureau of Economic Research; 1999. [Google Scholar]
- Levitz G, Brooke P. “Independent Versus System-Affiliated Hospitals: A Comparative Analysis of Financial Performance, Cost, and Productivity.”. Health Services Research. 1985;20(3):315–39. [PMC free article] [PubMed] [Google Scholar]
- Lynk W. “The Creation of Economic Efficiencies in Hospital Mergers.”. Journal of Health Economics. 1995;14(5):507–610. doi: 10.1016/0167-6296(95)00019-4. [DOI] [PubMed] [Google Scholar]
- McGuirk M, Porell F. “Spatial Patterns of Hospital Utilization: The Impact of Time and Distance.”. Inquiry. 1984;21:84–95. [PubMed] [Google Scholar]
- Melnick G, Keeler E, Zwanziger J. “Market Power and Hospital Pricing: Are Nonprofits Different?”. Health Affairs. 1999;18(3):167–73. doi: 10.1377/hlthaff.18.3.167. [DOI] [PubMed] [Google Scholar]
- Melnick G, Zwanziger J. “The Effects of Market Structure and Bargaining Position on Hospital Prices.”. Journal of Health Economics. 1992;11:217–34. doi: 10.1016/0167-6296(92)90001-h. [DOI] [PubMed] [Google Scholar]
- Menke T. “The Effect of Chain Membership on Hospital Costs.”. Health Services Research. 1997;32(2):177–96. [PMC free article] [PubMed] [Google Scholar]
- Mobley L, Frech HL. “Managed Care, Distance Traveled, and Hospital Market Definition.”. Inquiry. 2000;37(1):91–107. [PubMed] [Google Scholar]
- National Center for Health Statistics. Health: United States 1998. Washington DC: Department of Health and Human Services; 1998. [Google Scholar]
- Pak O. “Not-for-profit Status Facilitates Hospital Merger.”. Healthcare Financial Management. 1997;51(10):37–8. [PubMed] [Google Scholar]
- Robinson J, Luft H. “The Impact of Hospital Market Structure on Patient Volume, Average Length of Stay, and the Cost of Care.”. Journal of Health Economics. 1985;4:333–56. doi: 10.1016/0167-6296(85)90012-8. [DOI] [PubMed] [Google Scholar]
- Spetz J, Baker L. Public Policy Institute of California: San Francisco; 1997. “The Impact of Managed Care and Market Technology on the Adoption of Neonatal Intensive Care Units.”. [Google Scholar]
- Spetz J, Seago J, Mitchell S. San Francisco: Public Policy Institute of California; 1999. “Changes in Hospital Ownership in California.”. [Google Scholar]
- U.S. Department of Justice. “1992 Horizontal Merger Guidelines.”. [July 1999];1992 http://www.ftc.gov.
- U.S. Department of Justice and Federal Trade Commission. “Statements of Antitrust Enforcement Policy in Health Care, 1994.”. [July 1999];1994 http://www.ftc.gov.
- White WD, Morrisey M. “Are Patients Traveling Further?”. International Journal of the Economics of Business. 1998;5(2):203–21. [Google Scholar]
- Wilson P, Carey K. Memo: University of Texas Austin; 2000. “Nonparametric Analysis of Returns to Scale and Product Mix among U.S. Hospitals.”. [Google Scholar]
- Zwanziger J, Melnick GA. “The Effects of Hospital Competition and the Medicare PPS Program on Hospital Behavior in California.”. Journal of Health Economics. 1988;7(3):301–20. doi: 10.1016/0167-6296(88)90018-5. [DOI] [PubMed] [Google Scholar]