

Abstract
Background
The National Eye Institute Visual Function Questionnaire (NEI-VFQ) measures vision-targeted quality of life, but it is unclear whether it is sensitive to changes within individuals over time.
Objective
To determine the responsiveness of the NEI-VFQ to “within-individual” changes in visual acuity in patients who had subfoveal choroidal neovascularization in at least one eye secondary to age-related macular degeneration, ocular histoplasmosis syndrome, or idiopathic causes, and who participated in randomized trials of submacular surgery.
Methods
Trained telephone interviewers administered the NEI-VFQ as part of annual follow-up data collection for pilot trials and larger clinical trials of sub-macular surgery. Best-corrected visual acuity was measured by local vision examiners at 12 months after enrollment and, typically, by central “traveling” vision examiners at 24 months after enrollment. Changes in visual acuity and NEI-VFQ scores from 12 to 24 months were analyzed using linear regression methods.
Results
Two-hundred eighteen patients had both interviews and visual acuity measurements at 12 and 24 months after enrollment. Changes in the overall NEI-VFQ score and in 9 of the subscales (near activities, dependency, driving, role difficulties, distance activities, mental health, general vision, peripheral vision, and social functioning) were related to changes in visual acuity of the better-seeing eye based on linear regression analysis (P<.05). In our analysis, a 3-line decrease in the visual acuity of the better-seeing eye was associated with 3.6-to 16.2-point decreases in the overall NEI-VFQ score and 9 subscale scores.
Conclusions
Most of the NEI-VFQ subscales were responsive to changes in the visual acuity of the better-seeing eye over a 12-month interval in this patient population. Thus, the NEI-VFQ can be used to measure change in vision-targeted quality of life over time to augment clinical measurements of visual acuity.
THE NATIONAL Eye Institute Visual Function Questionnaire (NEI-VFQ) is a vision-specific quality-of-life instrument.1,2 It was the first vision-targeted instrument designed to measure quality of life across many ophthalmic conditions. Content area for the NEI-VFQ came from focus group sessions with patients with age-related macular degeneration (AMD), cataract, diabetic retinopathy, primary open-angle glaucoma, cytomegalovirus retinitis, or low vision from any cause.1
Previous research in cross-sectional studies supports the reliability and validity of the NEI-VFQ across a wide range of visual acuities.2–5 In the NEI-VFQ field test, internal consistency values, measured by Cronbach α, ranged from 0.66 to 0.94 among the subscales; test-retest reliability, measured by intraclass correlation coefficients, ranged from 0.68 to 0.91. Support for validity comes from differences in the NEI-VFQ scores between eye conditions and correlations of the scores with visual acuity and other measures of quality of life.2 Thus, the NEI-VFQ is a discriminative instrument. However, not all discriminative instruments are necessarily suitable to evaluate change in health status (such as visual function) over time. A responsive instrument is able to reflect clinically meaningful changes in vision within individuals over time.6 Additionally, changes in scores obtained using the quality-of-life instrument should correlate with changes in clinical measurements; otherwise, interpretation is complicated.6 A pitfall of using an unresponsive instrument to evaluate change in a clinical trial is the possibility of making a type II error; that is, concluding that there is not a treatment difference when in fact there is.7 Furthermore, information on the NEI-VFQ’s responsiveness is needed for sample size calculations in longitudinal studies of vision-targeted quality of life and projections of costs of these studies.
Even though there are no published data, to our knowledge, that support the NEI-VFQ’s responsiveness to changes in vision within individuals over time, the NEI-VFQ is already in use in many clinical trials, presumably to compare changes in vision-targeted quality of life over time between treatment groups. The goal of this analysis is to investigate whether the NEI-VFQ is responsive to “within-individual” changes in visual acuity over time in a group of patients with central vision loss due to choroidal neovascularization (CNV) secondary to AMD, ocular histoplasmosis syndrome (OHS), or idiopathic causes, and who participated in randomized trials of sub-macular surgery.
METHODS
PATIENT SELECTION
Data analyzed were from patients who participated in the Sub-macular Surgery Trials (SST) Pilot Study or larger SST clinical trials. The SST Pilot Study was a set of multicenter pilot trials of submacular surgery conducted in the United States to ascertain the feasibility of larger trials of submacular surgery. Subsequently, 3 larger clinical trials were launched to determine the effectiveness of submacular surgery in delaying further central vision loss caused by subfoveal CNV associated with AMD, OHS, or idiopathic causes.8 The design and methods of these randomized trials have been described elsewhere.9–11 The institutional review board of each of the participating clinical centers approved the research protocol before enrollment began at the center. The trials were carried out in accordance with the Declaration of Helsinki. Each participant gave written consent to participate in the trial for which he or she was eligible.
To maximize our ability to determine the responsiveness of the NEI-VFQ to changes in visual acuity during a 12-month interval, we combined data from 3 pilot trials and 3 full-scale clinical trials of submacular surgery. Patients who had quality-of-life interviews and visual acuity measurements at 12 and 24 months of follow-up by December 31, 2000, were included in the analysis. Patients enrolled in the pilot trials beginning in November 1993 and ending in December 1997. One of the 3 larger SST clinical trials that compose the SST was initiated in April 1997, and the other 2 began in July 1998. The trials enrolled patients in 3 clinical categories. Patients eligible for one of the pilot trials and one of the full-scale trials had large sub-foveal hemorrhagic lesions secondary to AMD, with visual acuity from 20/100 (approximate Snellen equivalent) to light perception in the study eye. A second pilot trial and a second full-scale trial included patients with new subfoveal choroidal neovascular lesions secondary to AMD who had 20/100 to 20/800 (approximate Snellen equivalent) visual acuity in the affected eye. To be eligible for the AMD trials, patients had to be at least 50 years old. The remaining patients had CNV due to OHS or idiopathic causes, were 18 years of age or older, and had visual acuities between 20/50 and 20/800 (approximate Snellen equivalent) in the study eye. Thus, wide ranges of ages and visual acuities are provided by these patients. In each of the 3 pilot trials and SST trials, patients were randomized to submacular surgery or observation and were followed up for at least 24 months after enrollment.
INTERVIEW METHODS
The NEI-VFQ was not available when the pilot trials were initiated in 1993; it was introduced in January 1997. Therefore, most SST pilot study patients did not have a baseline NEI-VFQ interview but had one or more follow-up interviews. The follow-up interviews were conducted at the same time points as the follow-up ophthalmological evaluations (ie, at 6 months, 12 months, and 24 months after enrollment). To include the largest possible number of pilot study patients in this analysis, data from the 12- and 24-month interviews and examinations of 87 pilot study patients were analyzed. In addition, data from the SST trials were analyzed for the 131 patients who had completed 12- and 24-month interviews and examinations by December 31, 2000. Interviews with all patients included in this analysis were administered by telephone by trained interviewers located at the SST Coordinating Center (Baltimore, Md), using a computer-assisted procedure in which responses were entered directly to computer files during the interview. Although patients gave consent for participation at time of enrollment in each randomized trial, a second oral consent was obtained by the interviewer prior to the start of each interview.
The 25-item version of the NEI-VFQ and the appendix of additional questions have been published (http://www.rand.org/health/surveys/vfq25).3 The 25-item NEI-VFQ and the appendix can be combined to create a 37-item NEI-VFQ (excluding 2 general health items). The items of the NEI-VFQ can be divided to create 11 subscale scores and an overall score. The subscales examined in this analysis are general vision (2 items in the subscale), ocular pain (2 items), near vision activities (6 items), distance vision activities (6 items), vision-specific social functioning (3 items), vision-specific mental health (5 items), vision-specific role difficulties (4 items), dependency due to vision (4 items), driving (3 items), peripheral vision (1 item), and color vision (1 item). One item in the driving subscale (difficulty driving in difficult conditions) was added during the conduct of the pilot trials with the advice of the developer (Carol Mangione, MD, electronic communication); therefore, for some early patients, the driving subscale was calculated from 2 items.
CLINICAL DATA
After a protocol refraction to obtain the best correction for each eye, visual acuity was measured separately for each eye on a modified Bailey-Lovie chart.12 A description of SST procedures for measuring visual acuity has been published elsewhere.9,10 Measurements were made at the 12-month examination by SST-certified vision examiners at each of the participating clinical centers. For quality assurance purposes, “traveling” vision examiners, who were masked to each patient’s treatment assignment and to the study eye, measured visual acuities at the 24-month examination whenever possible; otherwise, the measurements were made by local examiners. Masked measurements were incorporated in the analysis when available. Ninety-one percent of the 24-month visual acuity measurements were made by a masked examiner. So-ciodemographic characteristics were recorded as part of the baseline examination of each patient.
DATA ANALYSIS
This analysis is based on the 37-item version of the NEI-VFQ; 12-month 25-item NEI-VFQ scores are presented for comparison only. Each of the NEI-VFQ subscale scores is an un-weighted average of responses to nonmissing items in that sub-scale; the overall score is an unweighted average of nonmissing subscale scores. The subscale scores and the overall score can range in value from 0 to 100, with 0 being the worst possible value and 100 being the best possible value. Whenever the patient gave a response for at least one item in a scale, a score was calculated for that scale. Change in visual acuity was calculated as the difference in the visual acuity score at the 2 examinations. The “better eye” (ie, better-seeing eye) was defined as the eye with better visual acuity, that is, the higher visual acuity score, at each examination. Visual acuity line scores were calculated by dividing the visual acuity score by 5.
Box-and-whisker plots were used to summarize distributions.13 The χ2 or Fisher exact test was used to compare patients who were included and excluded from the analysis on variables that were categorical. The Wilcoxon 2-sample rank sum test was used to compare patients included and excluded from the analysis on variables that had a non-Gaussian distribution. Using SAS software (SAS Institute, Cary, NC), linear regression methods were used to examine the relation between 1-year changes in the NEI-VFQ scales and 1-year changes in visual acuity. Age; better-eye visual acuity at 12 months’ follow-up; difference in visual acuity between the 2 eyes at 12 months’ follow-up; change in visual acuity of the worse eye at 12 to 24 months’ follow-up; general health (measured by the Medical Outcomes Study 36-item Short Form Health Survey [SF-36] physical and mental component summary scale scores14) at 12 months’ follow-up; and change in general health at 12 to 24 months’ follow-up were evaluated as potential confounders using linear regression methods for the association between changes in the NEI-VFQ scores and changes in better-eye visual acuity. Unadjusted P values less than .05 were considered statistically significant.
RESULTS
DEMOGRAPHIC AND CLINICAL CHARACTERISTICS
Of 1207 patients enrolled in 3 clinical trials and 3 pilot trials of submacular surgery, 483 were alive and had completed 24-month follow-up examinations or interviews, or their visit windows had closed without a 24-month contact as of December 31, 2000. Of these 483 patients, 218 (131 of 175 patients in the clinical trials and 87 of 308 patients in the pilot trials) who had visual acuity measurements and NEI-VFQ scores both at 12 and 24 months after enrollment were included in this analysis.
Patients who were included in the analysis had a median age of 73 years and were predominantly white (97%); more than half (59%) were women (Table 1). Fifty-one percent of the patients included in the analysis rated their health at the time of the 12-month interview as excellent or very good; 17% rated their health as fair or poor. Seventeen percent of patients had visual acuities of 20/200 or worse in both eyes. Of 218 patients included in the study, 137 had CNV due to AMD, and 81 had CNV due to OHS or idiopathic causes.
Table 1.
Description of 218 Patients Included in the Analysis
| Variable | Data/Value |
|---|---|
| Median age at 12 months’ follow-up [range], y | 73 (25–91) |
| Sex, No. (%) | |
| Women | 128 (59) |
| Men | 90 (41) |
| Race/ethnicity, No. (%) | |
| White, non-Hispanic | 211 (97) |
| Other | 7 (3) |
| Occupational status at baseline visit, No. (%) | |
| Visually disabled | 5 (2) |
| Disabled (not visually) | 1 (0) |
| Retired | 123 (56) |
| Employed with income | 69 (32) |
| House spouse | 18 (8) |
| Unemployed | 1 (0) |
| Student | 1 (0) |
| Self-rated health at 12 months’ follow-up, No. (%) | |
| Excellent | 32 (15) |
| Very good | 79 (36) |
| Good | 71 (33) |
| Fair | 32 (15) |
| Poor | 4 (2) |
| Median visual acuity at 12 month’s follow-up (range) | |
| Better eye | 20/25 (20/20–20/800) |
| Worse eye | 20/320 (20/20–light perception) |
There were no statistically significant differences in patients who were included or excluded from the analysis on demographic characteristics (data not shown). Patients who were excluded from the analysis had worse median visual acuity scores in both eyes at the 12-month examination than patients who were included in the analysis (median visual acuity in the better eye: 20/40 vs 20/25, P=.03; median visual acuity in the worse eye: 20/400 vs 20/320, P=.03; Wilcoxon 2-sample rank sum tests). Furthermore, 26% of the patients excluded and 51% of the patients included in the analysis reported their health as excellent or very good at 12 months’ follow-up. For these comparisons, information on visual acuity was not available for 25%, and self-rated health was not available for 31% of the 265 patients excluded from the study.
The NEI-VFQ scores from the 12-month interviews are reported in Table 2 for all patients combined and for subgroups defined by the visual acuity of the better eye. The difference between median scale scores for the subgroup of patients with a visual acuity in the better eye of 20/20 through 20/40, and those with a visual acuity in the better eye of 20/200 or worse, ranges from no difference on the peripheral vision scale to a 75-point difference on the driving scale. Also included in the last column of Table 2 are the 25- and 37-item NEI-VFQ mean scores for the reference group of individuals who did not have clinical eye disease or uncorrectable visual acuity worse than 20/25, and who had a mean age of 59 years (range, 23–83 years) (Carol Mangione, MD, unpublished data, April 19, 2002).3 Information on the reference group was collected by the NEI-VFQ’s developers.1,3 Mean scores for SST patients are lower for every scale than for the reference group.
Table 2.
NEI-VFQ 25- and 37-Item Scores (Overall and Subscales) by “Better-Eye” Visual Acuity at 12 Months’ Follow-up
|
Median Scores by Better-Eye Visual Acuity* |
||||||||||||
|---|---|---|---|---|---|---|---|---|---|---|---|---|
|
No. of Patients |
Mean (Median) [Range] Scores |
20/20-20/40 (n = 136) |
20/50-20/160 (n = 46) |
20/200-20/800 (n = 36) |
Reference Mean (n = 122)† |
|||||||
| Scale | 25-Item | 37-Item | 25-Item | 37-Item | 25-Item | 37-Item | 25-Item | 37-Item | 25-Item | 37-Item | 25-Item | 37-Item |
| Overall VFQ | 218 | 68 (70) [22-98] | 69 (71) [22-98] | 81 | 83 | 52 | 53 | 46 | 47 | 93 | 93 | |
| Near activities | 218 | 57 (58) [0-100] | 60 (62) [0-100] | 75 | 75 | 33 | 33 | 25 | 27 | 92 | 92 | |
| Dependency | 218 | 72 (83) [0-100] | 74 (81) [0-100] | 92 | 94 | 50 | 56 | 42 | 44 | 99 | 99 | |
| Driving‡ | 204 | 46 (58) [0.08] | 46 (58) [0-100] | 75 | 75 | 0 | 0 | 0 | 0 | 87 | 87 | |
| Role difficulties | 218 | 66 (62) [0-100] | 67 (69) [0-100] | 75 | 81 | 50 | 50 | 50 | 50 | 93 | 95 | |
| Distance activities | 218 | 62 (60) [0-100] | 65 (65) [8-100] | 83 | 83 | 42 | 42 | 33 | 35 | 93 | 95 | |
| Mental health | 218 | 63 (69) [0-100] | 65 (70) [5-100] | 75 | 75 | 47 | 50 | 50 | 55 | 92 | 93 | |
| General vision | 217 | 218 | 58 (60) [20-100] | 59 (60) [10-100] | 60 | 65 | 40 | 45 | 40 | 40 | 83 | 81 |
| Peripheral vision‡ | 218 | 74 (75) [0-100] | 74 (75) [0-100] | 75 | 75 | 75 | 75 | 75 | 75 | 97 | 97 | |
| Social functioning | 218 | 81 (88) [12-100] | 82 (92) [8-100] | 100 | 100 | 75 | 67 | 62 | 62 | 99 | 99 | |
| Color vision‡ | 217 | 82 (100) [0-100] | 82 (100) [0-100] | 100 | 100 | 75 | 75 | 75 | 75 | 98 | 98 | |
| Ocular pain‡ | 218 | 86 (88) [25-100] | 86 (88) [25-100] | 100 | 100 | 94 | 94 | 88 | 88 | 90 | 99 | |
Abbreviations: NEI-VFQ, National Eye Institute Visual Function Questionnaire.
Sample sizes for driving, general vision, and color vision subscales are lower owing to missing responses. Better-eye means the better-seeing eye.
Mean 25-item NEI-VFQ subscale scores have been previously published.3 Mean overall 25- and 37-item NEI-VFQ scores and mean 37-item subscale scores have not been previously published (Carol Mangione, MD, unpublished data, April 19, 2002).
The same number of items contribute to the subscales in the 25- and 37-item NEI-VFQ.
1-YEAR CHANGES IN SCORES
Figure 1 and Figure 2 summarize 1-year changes in visual acuity and NEI-VFQ scores, respectively. Change in the better-eye visual acuity from the 12-month to the 24-month examination ranged from a loss of 9.6 lines to a gain of 3.4 lines with a median change of 0 lines. Worse-eye visual acuity change ranged from a loss of 12.4 lines to a gain of 9.6 lines with a median change of 0.2 lines lost. During the same period, change in the NEI-VFQ overall score ranged from a loss of 38 points to a gain of 28 points, with a median loss of 1 point. The median change in each of the NEI-VFQ subscales was 0 points, with losses and gains in each subscale.
Figure 1.
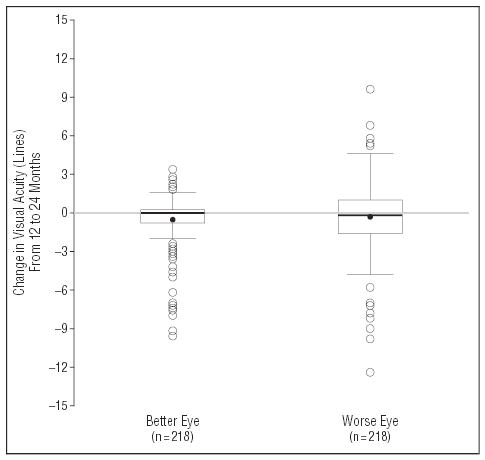
Box-and-whisker summaries of change in visual acuity from the 12-month to the 24-month examination for the eye with better visual acuity (left box-and-whisker) and for the eye with worse visual acuity (right box-and-whisker) of 218 patients. The solid circles represent the mean value. The horizontal line inside the box is the median, and the bottom and top lines of the box represent 25th and 75th percentiles (quartiles), respectively. Vertical lines (whiskers) represent values within 1.5 times the interquartile range from the central box. Open circles represent outliers.
Figure 2.
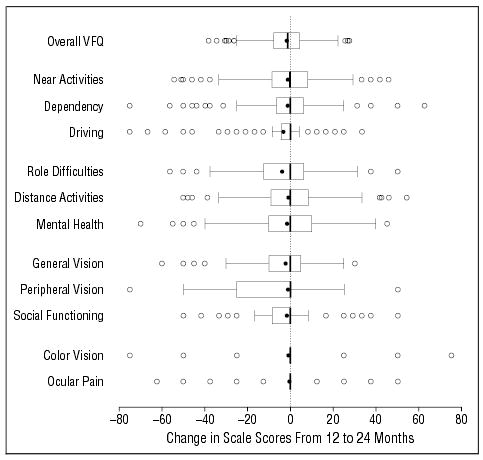
Box-and-whisker summaries of change in the National Eye Institute Visual Function Questionnaire (NEI-VFQ) overall and subscale scores from the 12-month to the 24-month interview (n=218). The solid circles represent the mean value. The vertical line inside the box is the median, and the left and right vertical lines of the box represent 25th and 75th percentiles (quartiles), respectively. Horizontal lines (whiskers) represent values within 1.5 times the interquartile range from the central box. Open circles represent outliers.
RELATION BETWEEN CHANGES IN VISUAL ACUITY AND NEI-VFQ SCORES
Figure 3 shows scatter plots and linear regression lines for 1-year changes in NEI-VFQ scale scores vs 1-year changes in the visual acuity of the better eye. Results from the linear regression analysis are summarized in Table 3. One-year changes in the overall score and in all but 2 sub-scale scores were found to be linearly related to 1-year changes in better-eye visual acuity with slopes statistically significantly different from zero (P<.05). A 1-line change in the better-eye visual acuity during 1 year was associated with 1.2- to 3.6-point changes in 9 of 11 sub-scale scores and in the overall NEI-VFQ score. A change in better-eye visual acuity was not associated with changes in color vision (P=.14) or ocular pain subscale (P=.22) scores. Associations between 1-year changes in the NEI-VFQ scores and 1-year changes in better-eye visual acuity persisted after adjustment for age, better-eye visual acuity at 12 months of follow-up, difference in visual acuity of the 2 eyes at 12 months’ follow-up, general health (measured by SF-36 physical and mental component summary scale scores) at 12 months’ follow-up, 1-year changes in worse-eye visual acuity, or 1-year changes in general health (measured by 1-year changes in SF-36 physical and mental component summary scale scores) (data not shown). Given no change in better-eye visual acuity, there were no statistically significant changes in the NEI-VFQ scores during a 1-year interval, as indicated by the fact that intercepts from linear regression of 1-year changes in the NEI-VFQ scores on 1-year changes in better-eye visual acuity were not statistically significant.
Figure 3.
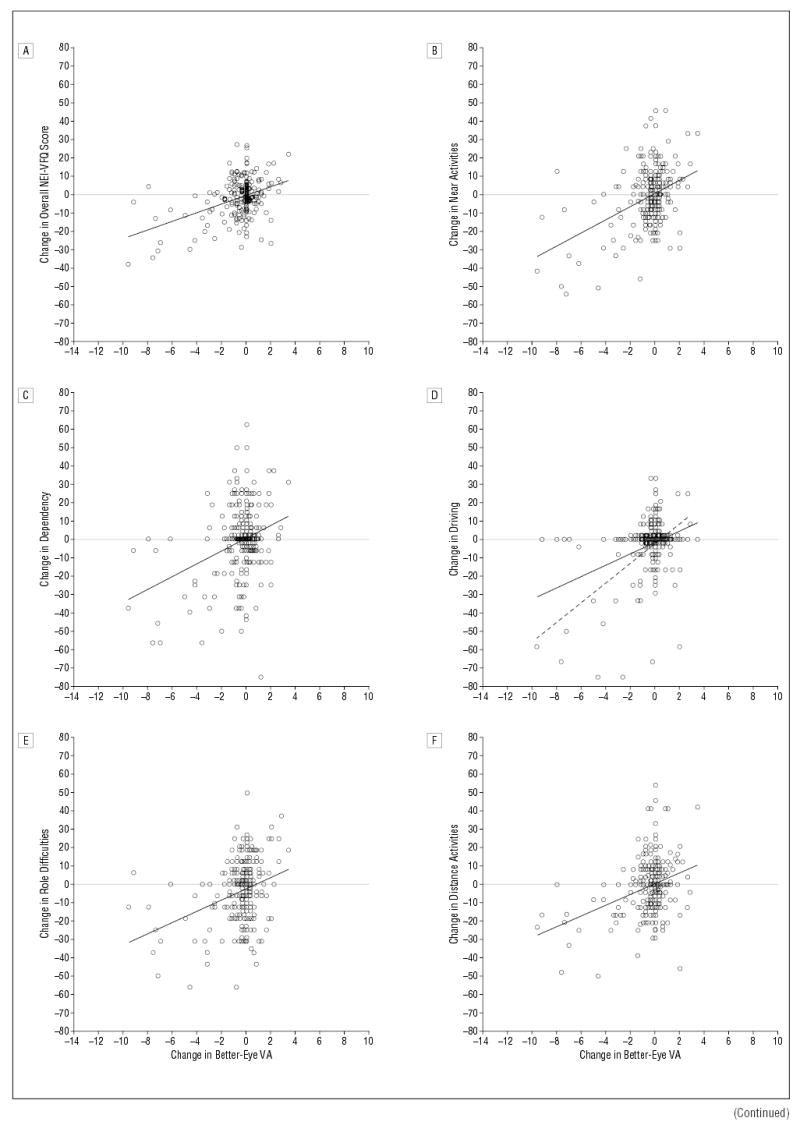
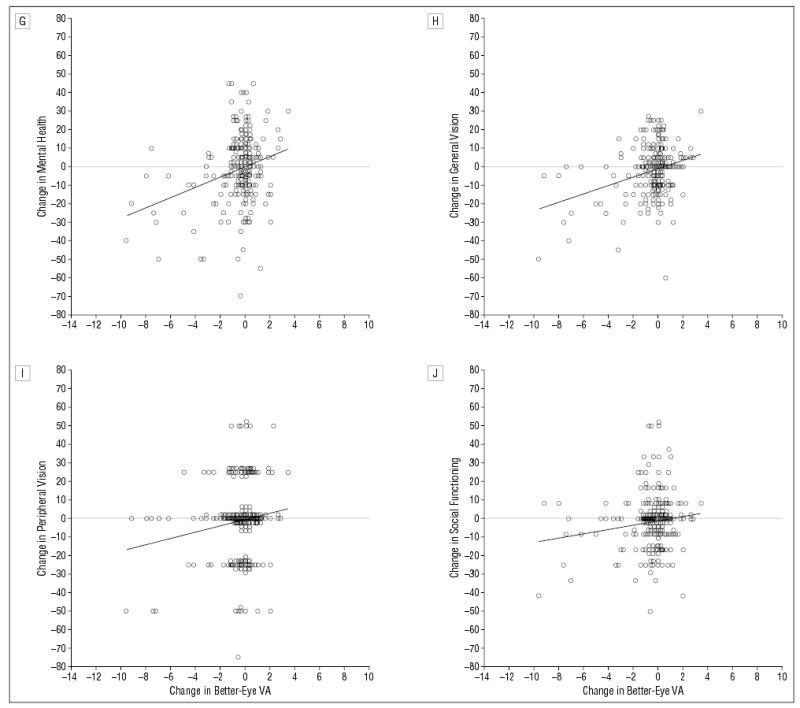
Change in National Eye Institute Visual Function Questionnaire (NEI-VFQ) scores from 12 to 24 months vs change in “better-eye” (ie, better-seeing eye) visual acuity (VA) (in lines) from 12 to 24 months. A horizontal line in each graph separates better (above line) and worse (below line) NEI-VFQ scores. A, Change in overall NEI-VFQ score vs change in better-eye VA (n=218). B, Change in near activities subscale scores vs change in better-eye VA (n=218). C, Change in dependency subscale scores vs change in better-eye VA (n=218). D, Change in driving subscale scores vs change in better-eye VA (n=197). Dashed linear regression line represents association when individuals with a driving score of 0 at 12 and 24 months of follow-up are excluded (n=130). E, Change in role difficulties subscale scores vs change in better-eye VA (n=218). F, Change in distance activities subscale scores vs change in better-eye VA (n=218). G, Change in mental health subscale scores versus change in better-eye VA (n = 218). H, Change in general vision subscale scores vs change in better-eye VA (n = 218). I, Change in peripheral vision subscale scores vs change in better-eye VA (n = 217). J, Change in social functioning subscale scores vs change in better-eye VA (n = 218).
Table 3.
Linear Regression Coefficients for 1-Year Changes in NEI-VFQ Scores vs 1-Year Changes in Visual Acuity
|
Independent Variable in Linear Regression Model |
||||
|---|---|---|---|---|
|
1-Year Better-Eye Visual Acuity Change |
1-Year Worse-Eye Visual Acuity Change |
|||
| NEI-VFQ Scale | Intercept (SE) | Slope (SE) | Intercept (SE) | Slope (SE) |
| Overall VFQ | −0.3 (0.7) | 2.4 (0.4)* | −1.4 (0.7) | 0.4 (0.2) |
| Near activities | 0.8 (1.1) | 3.6 (0.5)* | −0.9 (1.1) | 0.5 (0.4) |
| Dependency | 0.8 (1.4) | 3.5 (0.7)* | −1.1 (1.4) | −0.0 (0.5) |
| Driving | −1.5 (1.1) | 3.1 (0.6)* | −3.0 (1.2)† | 0.4 (0.4) |
| Role diffculties | −2.1 (1.2) | 3.1 (0.6)* | −3.7 (1.2)* | 0.4 (0.4) |
| Distance activities | 0.8 (1.1) | 3.0 (0.5)* | −0.7 (1.1) | 0.5 (0.4) |
| Mental health | 0.2 (1.3) | 2.8 (0.7)* | −1.3 (1.3) | 0.1 (0.4) |
| General vision | −0.9 (0.9) | 2.3 (0.5)* | −1.9 (0.9)† | 0.7 (0.3)† |
| Peripheral vision | −0.2 (1.5) | 1.7 (0.8)† | −0.8 (1.5) | 1.0 (0.5)† |
| Social functioning | −1.0 (1.1) | 1.2 (0.6)† | −1.6 (1.1) | 0.1 (0.4) |
| Color vision | −0.1 (1.6) | 1.3 (0.8) | −0.8 (1.6) | 0.2 (0.5) |
| Ocular pain | 0.0 (1.2) | 0.8 (0.6) | −0.1 (1.2) | 1.0 (0.4)† |
| Driving‡ | −2.1 (1.6) | 5.4 (0.8)* | −4.5 (1.8)† | 0.4 (0.5) |
Abbreviation: NEI-VFQ, National Eye Institute Visual Function Questionnaire.
P<.01.
P≥.01 but P<.05.
Excluded individuals who had a driving score of 0 at 12 and 24 months’ follow-up.
Examination of box-and-whisker plots of 1-year changes in NEI-VFQ scores after stratification by 1-year changes in better-eye visual acuity suggested that the NEI-VFQ was more sensitive to losses in visual acuity than to gains. However, any association of gains in better-eye visual acuity with changes in NEI-VFQ scores could not be assessed because few patients experienced gains of 2 or more lines in better-eye visual acuity, in part because many patients already had good vision in the better-seeing eye at 12 months’ follow-up.
Further analysis of the driving subscale was warranted because a large proportion of the study population (67 of 197 individuals) had given up driving owing to their eyesight and were still not driving at 24 months’ follow-up (these 67 individuals had a driving score of 0 at both 12 and 24 months’ follow-up). Analysis was repeated without these 67 individuals because a further loss of visual acuity cannot be associated with a further drop in the driving score, and a gain in visual acuity was not associated with resuming driving in this subgroup (1-year changes in better-eye visual acuity ranged from a loss of 9.2 lines to a gain of 3.4 lines in these 67 patients). When these individuals were excluded from the linear regression analysis, the driving subscale became the most responsive subscale of the NEI-VFQ. One-line change in better-eye visual acuity corresponded to 5.4 points change in the driving subsale. Thus, in the subgroup of drivers at 12 months, a change in the visual acuity of the better eye was strongly associated with a change in their self-reported ability to drive.
Change in visual acuity of the worse eye was not associated with statistically or clinically meaningful changes in the NEI-VFQ scores for most subscales in these patients (Table 3).
COMMENT
The overall 37-item NEI-VFQ score and 9 of the 11 sub-scales were responsive to 1-year changes in the visual acuity of the better-seeing eye in individuals in this group of patients. The NEI-VFQ was particularly sensitive to loss of visual acuity in the better eye. The color vision and ocular pain subscales were insensitive to 1-year changes in visual acuity of the better eye in this study. These findings are consistent with our prior expectations that subscales such as near activities, distance activities, and driving would be more sensitive to changes in central visual acuity than color vision and ocular pain subscales would be. Furthermore, color vision and ocular pain subscale scores at 12 months’ follow-up were those closest to the reference group values, suggesting that they had not been significantly affected by poor visual acuity in one or both eyes among these patients.
Results of this study show that the driving subscale was more responsive to changes in visual acuity of the better eye among individuals who drove either at 12 months’ or 24 months’ follow-up after eliminating from analysis individuals who had given up driving mainly because of their vision and who did not start driving during follow-up (ie, driving subscale score of “0” at both time points). Since the absence of a 1-year change in the driving subscale cannot be interpreted in the same way for the group who was not driving owing to poor vision as for the group who was driving, mixing the 2 groups in the analysis may distort the estimate of change and may increase the likelihood of not finding a meaningful association when a difference may exist in a subgroup of drivers. A separate analysis that excludes individuals who were not driving owing to poor vision during the period of interest may be advisable when a change in the driving subscale is an important outcome.
A noteworthy finding of this study was that the 37-item NEI-VFQ scores and the 25-item NEI-VFQ scores at 12 months’ follow-up were similar for most sub-scales. The 37-item and the 25-item NEI-VFQ scores for the reference group also were very similar. These data suggest that the 25-item NEI-VFQ may be sufficient to describe vision-targeted quality of life.
Strengths of this study include prospective data collection among a well-characterized group of patients whose primary health problem was subfoveal CNV that had resulted in a loss of visual acuity in at least 1 eye. In addition, all interviews were conducted by telephone by personnel not affiliated with any clinical center and who had no other relationship with the patients. The period analyzed was well after the recovery period from initial submacular surgery. Since many patients did not have substantial changes in better-eye visual acuity or in the NEI-VFQ scores during the 1-year period under study, regression lines were heavily influenced by the subset of patients who experienced large losses of visual acuity in the better eye.
It is unlikely that findings on the responsiveness of the NEI-VFQ to changes in visual acuity in the better eye in this group of patients (who had a very specific condition that affects central acuity) apply to persons with different eye diseases that may affect other aspects of vision. The patients included in this analysis typically either maintained the visual acuity of the better eye at the 12-month level or lost visual acuity by 24 months; few patients experienced improvements of more than 2 lines in the better eye during the 1-year period. When data collection in the full-scale SST is completed, data collected at longer follow-up intervals will be available for analysis.
One may question whether a 1.2- to 5.4-point change in the NEI-VFQ scores per 1-line change in visual acuity is clinically meaningful. In clinical trials of treatments for AMD and other causes of CNV with central vision loss, losses of 3 lines15,16 and 6 lines17–19 from baseline visual acuity have been used as the primary outcome of interest. According to our findings, 3- or 6-line changes in the visual acuity of the better eye would translate to changes of 3.6 to 16.2 points and 7.2 to 32.4 points in the NEI-VFQ scores, respectively. However, as shown in Figure 3, some patients had such decreases in scores without significant loss of visual acuity. One may also consider SD units as a benchmark for clinical significance. If half an SD change in better-eye visual acuity (2.2 lines in our sample) would be considered clinically meaningful, then half an SD change in the NEI-VFQ scores may also be an important change to detect (10 points in the overall score and 12 to 13 points in most subscales in our sample).
It is important to note that surveys such as the NEI-VFQ that estimate vision-targeted, health-related quality of life rely on patients’ perceptions of disability. It is possible that clinically important declines in visual acuity throughout the 12-month follow-up period did not result in declines in NEI-VFQ scales because patients had adapted to this loss in acuity. It is also possible that, given the nature of the ocular conditions included in the analysis, patients had fairly low expectations for their vision-targeted quality of life.
Despite the limitations of this study, the results of these analyses demonstrate that the NEI-VFQ is responsive to within-individual, better-eye visual acuity change over time. Therefore, the NEI-VFQ can be used for the evaluation of vision-targeted quality of life in prospective studies. It remains to be seen whether responses to the NEI-VFQ, in combination with other demographic and clinical characteristics of patients and information about earlier visual acuity measurements, could be used to estimate changes or rate of change in visual acuity. This information would be valuable in epidemiological studies when some study subjects cannot return for follow-up examinations or when it is either logistically or financially impossible to examine all study subjects.
The Submacular Surgery Trials Research Group
Submacular Surgery Trials Clinical Center Principal Investigators and Vision Examiners Who Contributed Data to This Analysis
Emory University Eye Center, Atlanta, Ga: Paul Sternberg Jr, MD; Lindy DuBois, COMT; Judy Brower, COMT. The Wilmer Ophthalmological Institute, Baltimore, Md: Julia A. Haller, MD; Ann Eager; Tracey Porter, COT. Barnes Retina Institute, St Louis, Mo: Nancy Melberg-Holekamp, MD; Julie Binning, COT; Lynda Boyd, COT. Cleveland Clinic Foundation, Cleveland, Ohio: Hilel Lewis, MD; Ginny Hendricks, COA; Joyce Conway, COT; Anthony Fattori; Susan C. Rath, PA-C. Retina and Vitreous Associates of Kentucky, Lexington: William J. Wood, MD; Christine Brown, COT; J. Lynn Cruz, COT; Wanda Heath, COT; Catherine Millett, COA. Duke University Medical Center, Durham, NC: Cynthia Toth, MD; Malcolm M. Anderson, Jr, PAC. William Beaumont Hospital, Royal Oak, Mich: George A. Williams, MD; Mary Zajechowski, COT. Schatz, McDonald, Johnson & Ai, San Francisco, Calif: H. Richard McDonald, MD; Marsha Apushkin, MD; Kevan E. Curren, COA; Irina Rozenfeld, MD; Margaret Stolarczuk, OD. Ohio State University College of Medicine, Columbus: Frederick H. Davidorf, MD; Jill Milliron, COA; Jerilyn Perry, COT. Retina Vitreous Consultants, Pittsburgh, Pa: Robert L. Bergren, MD; Linda Wilcox, COA. Retina Associates of Cleveland, Beachwood, Ohio: Lawrence J. Singerman, MD; Scott D. Marella. Jules Stein Eye Institute, Los Angeles, Calif: Steven D. Schwartz, MD; Lisa Barnhart, OD, FAAO; Melissa Chun, OD. Midwest Eye Institute, Indianapolis, Ind: John T. Minturn, MD; Shelly Cohen, COT. The University of Iowa, Iowa City: James C. Folk, MD; Betty Follmer; Connie Fountain, COT. Mid-America Retina Consultants, Kansas City, Mo: William N. Rosenthal, MD, FACS; Barbara Petro, COT; Dalton Thibodeaux. St Vincent Mercy Medical Center, Toledo, Ohio: Samuel R. Pesin, MD; James M. Haener, COT. Southeastern Retina Associates PC, Knoxville, Tenn: John C. Hoskins, MD; Bruce D. Gilliland, OD.
Traveling Vision Examiners
Kristi L. Cumming, RN, MSN; Janel Gualdoni, COT; Mike Hartnett, COMT; Patricia L. Hawse, COMT; Peggy R. Orr, MPH, COMT (Vision Testing Subcommittee chair).
Interviewers
Rob G. Casper, MS; Alice D. Keith; Dawn K. Smith; Nancy A. Prusakowski, MS; Irene L. Felicetti; Lisa A. Lassiter.
Appointed, Voting Members of the Submacular Surgery Trials Data and Safety Monitoring Committee Who Reviewed and Approved This Report
Gary W. Abrams, MD; John E. Connett, PhD; Christine Grady, RN, PhD; Earl G. Harrison, LLD; Argye I. Hillis, PhD; Lee M. Jampol, MD
Submacular Surgery Trials Executive Committee Responsible for Review of This Report
Neil M. Bressler, MD; Eric B. Bass, MD, MPH; Susan B. Bressler, MD; Hans E. Grossniklaus, MD; Julia A. Haller, MD; Barbara S. Hawkins, PhD; John C. Hoskins, MD; Carol M. Mangione, MD, MSPH; Peggy R. Orr, MPH, COMT; Rosaleen Ostrick, MPH, MA; Samuel R. Pesin, MD; Maryann Redford, DDS, MPH; Paul Sternberg, MD; Matthew A. Thomas, MD; and David J. Wilson, MD
Footnotes
Some of the data included in this article were presented to the International Society for Quality of Life Research Conference, Vancouver, British Columbia, October 31, 2000; the National Eye Institute’s Forum on Visual Functioning Assessment in Clinical and Observational Research, Bethesda, Md, November 13, 2000; and the Wilmer Research Meeting, Baltimore, Md, March 9, 2001.
Reprints: Barbara S. Hawkins, PhD, Submacular Surgery Trials Coordinating Center, Wilmer Clinical Trials and Biometry, 550 N Broadway, Ninth Floor, Baltimore, MD 21205 (e-mail:bhawkins@jhmi.edu).
Funding for the Submacular Surgery Trials Pilot Study was provided from numerous private and public sources that have been published elsewhere (see reference 10). Funding for the Submacular Surgery Trials and this analysis was provided through awards U10 EY 11547, U10 EY 11557, and U10 EY 11558 from the National Eye Institute of the National Institutes of Health, Bethesda, Md.
References
- 1.Mangione CM, Berry S, Spritzer K, et al. Identifying the content area for the 51-item National Eye Institute Visual Function Questionnaire: results from focus groups with visually impaired persons. Arch Ophthalmol. 1998;116:227–233. doi: 10.1001/archopht.116.2.227. [DOI] [PubMed] [Google Scholar]
- 2.Mangione CM, Lee PP, Pitts J, et al. Psychometric properties of the National Eye Institute Visual Function Questionnaire (NEI-VFQ) Arch Ophthalmol. 1998;116:1496–1504. doi: 10.1001/archopht.116.11.1496. [DOI] [PubMed] [Google Scholar]
- 3.Mangione CM, Lee PP, Gutierrez PR, et al. Development of the 25-item National Eye Institute Visual Function Questionnaire. Arch Ophthalmol. 2001;119:1050–1058. doi: 10.1001/archopht.119.7.1050. [DOI] [PubMed] [Google Scholar]
- 4.Broman AT, Munoz B, West SK, et al. Psychometric properties of the 25-item NEI-VFQ in a Hispanic population: proyecto VER. Invest Ophthalmol Vis Sci. 2001;42:606–613. [PubMed] [Google Scholar]
- 5.Cole SR, Beck RW, Moke PS, Gal RL, Long DT the Optic Neuritis Study Group. The National Eye Institute Visual Function Questionnaire: experience of the ONTT. Invest Ophthalmol Vis Sci. 2000;41:1017–1021. [PubMed] [Google Scholar]
- 6.Guyatt G, Walter S, Norman G. Measuring change over time: assessing the usefulness of evaluative instruments. J Chron Dis. 1987;40:171–178. doi: 10.1016/0021-9681(87)90069-5. [DOI] [PubMed] [Google Scholar]
- 7.Gliklich RE, Hilinski JM. Longitudinal sensitivity of generic and specific health measures in chronic sinusitis. Qual Life Res. 1995;4:27–32. doi: 10.1007/BF00434380. [DOI] [PubMed] [Google Scholar]
- 8.Bressler NM. Submacular surgery: are randomized trials necessary? Arch Ophthalmol. 1995;113:1557–1560. doi: 10.1001/archopht.1995.01100120087016. [DOI] [PubMed] [Google Scholar]
- 9.Submacular Surgery Trials Research Group. Submacular Surgery Trials (SST) Manual of Procedures Springfield, Va: US Dept of Commerce, National Technical Information Service; June 1998. NTIS accession No. PB98–166648.
- 10.Submacular Surgery Trials Pilot Study Investigators. Submacular Surgery Trials randomized pilot trial of laser photocoagulation versus surgery for recurrent choroidal neovascularization secondary to age-related macular degeneration, I: ophthalmic outcomes: Submacular Surgery Trials Pilot Study report number 1. Am J Ophthalmol. 2000;130:387–407. doi: 10.1016/s0002-9394(00)00729-7. [DOI] [PubMed] [Google Scholar]
- 11.Submacular Surgery Trials Pilot Study Investigators. Submacular Surgery Trials randomized pilot trial of laser photocoagulation versus surgery for recurrent choroidal neovascularization secondary to age-related macular degeneration, II: quality of life outcomes: Submacular Surgery Trials Pilot Study report number 2. Am J Ophthalmol. 2000;130:408–418. doi: 10.1016/s0002-9394(00)00730-3. [DOI] [PubMed] [Google Scholar]
- 12.Ferris FL, Kassoff A, Bresnick GH, Bailey I. New visual acuity charts for clinical research. Am J Ophthalmol. 1982;94:91–96. [PubMed] [Google Scholar]
- 13.Tukey JW. Exploratory Data Analysis Reading, Mass: Addison-Wesley Publiahing Co: 1977:39–41.
- 14.Ware JE, Kosinski M, Keller SD. SF-36 Physical and Mental Health Summary Scales: A User’s Manual Boston, Mass: Health Institute, New England Medical Center; 1994.
- 15.Treatment of Age-Related Macular Degeneration With Photodynamic Therapy (TAP) Study Group. Photodynamic therapy of subfoveal choroidal neovascularization in age-related macular degeneration with verteporfin: one-year results of 2 randomized clinical trials: TAP report 1. Arch Ophthalmol. 1999;117:1329–1345. [PubMed] [Google Scholar]
- 16.Bressler NM Treatment of Age-Related Macular Degeneration with Photodynamic Therapy (TAP) Study Group. Photodynamic therapy of subfoveal choroidal neovascularization in age-related macular degeneration with verteporfin: two-year results of 2 randomized clinical trials-TAP report 2. Arch Ophthalmol. 2001;119:198–207. [PubMed] [Google Scholar]
- 17.Macular Photocoagulation Study Group. Argon laser photocoagulation for senile macular degeneration: results of a randomized trial. Arch Ophthalmol. 1982;100:912–918. doi: 10.1001/archopht.1982.01030030920003. [DOI] [PubMed] [Google Scholar]
- 18.Macular Photocoagulation Study Group. Krypton laser photocoagulation for neo-vascular lesions of age-related macular degeneration: results of a randomized clinical trial. Arch Ophthalmol. 1990;108:816–824. doi: 10.1001/archopht.1990.01070080058036. [DOI] [PubMed] [Google Scholar]
- 19.Macular Photocoagulation Study Group. Laser photocoagulation of subfoveal neo-vascular lesions in age-related macular degeneration: results of a randomized clinical trial. Arch Ophthalmol. 1991;109:1220–1231. doi: 10.1001/archopht.1991.01080090044025. [DOI] [PubMed] [Google Scholar]