Abstract
Background
The definition and treatment of glucose intolerance during pregnancy are matters of intense controversy. Our goal was to examine the value of the 75-g oral glucose tolerance test (OGTT) in terms of its ability to predict birth weight percentile in a group of women with singleton pregnancies who received minimal treatment for their glucose intolerance.
Methods
We reviewed the results of OGTTs performed between 24 and 28 weeks' gestation in a group of 300 consecutive high-risk women (mean age 29.5 years [95% confidence interval, CI, 28.9–30.1]; parity 1.5 [95% CI 1.4–1.7]) whose plasma glucose level 1 hour after a randomly administered 50-g glucose load was 8.0 mmol/L or above. These data were compared with results for a randomly selected control group of 300 women whose plasma glucose level 1 hour after a 50-g glucose load was less than 8.0 mmol/L (mean age 28.0 years [95% CI 27.4–28.6]; parity 1.5 [95% CI 1.3–1.6]).
Results
For 76 (25.3%) of the 300 high-risk women, the plasma glucose level 2 hours after a 75-g glucose load (confirmatory OGTT) was 7.8 mmol/L or more, but only 6 of these were treated with insulin, which emphasizes the low level of intervention in this group. Thirty (10.0%) of the neonates in this group were large for gestational age (LGA; adjusted weight at or above the 90th percentile). This proportion did not significantly differ from the proportion for the control group (25 or 8.3%). After exclusion of the 6 insulin-treated women, simple correlations between birth weight percentile and fasting or 2-hour plasma glucose levels were very weak (r = 0.23 and 0.16 respectively; p < 0.01). The correlation between birth weight percentile and fasting or 2-hour plasma glucose persisted in a multiple regression analysis that included the following maternal variables: age, prepregnancy weight, weight gain during pregnancy, parity and smoking. In the multivariate models, the standardized coefficients for fasting and 2-hour plasma glucose levels were low (r = 0.19 [p < 0.001] and r = 0.13 [p = 0.02] respectively). These multivariate models could not explain more than 22% of the total variability in birth weight percentile.
Interpretation
In this population of pregnant, untreated diabetic women, plasma glucose levels (either fasting or after various glucose loads) were independently but poorly correlated with birth weight; no more than 3% to 5% of birth weight variability could be explained by changes in glucose tolerance. Fasting plasma glucose was consistently but marginally better than the plasma glucose level 2 hours after 75-g glucose load for predicting LGA neonates. We conclude that neonatal macrosomia is influenced by variables that are largely independent of plasma glucose concentrations.
Disagreement continues among health care providers regarding several aspects of gestational diabetes mellitus, including criteria for diagnosis, associated perinatal and maternal morbidity, effectiveness of treatment and optimal management strategies.1,2,3,4 Despite the efforts of several expert committees,5,6,7,8 there are no uniform diagnostic criteria, and no agreement has been reached as to the required intensity of intervention. This situation creates confusion for the primary care physicians charged with caring for these women.9
The 75- and 100-g oral glucose tolerance tests (OGTTs) are currently among the most widely used methods for diagnosing diabetes during pregnancy.10 These methods are derived from the work of O'Sullivan and colleagues11,12 who were trying to predict the long-term risk of diabetes in women; however, the results of this research were not intended to be used for predicting the short-term complications of pregnancy such as macrosomia. The threshold values that define gestational diabetes and the number of measurements needed for the diagnosis vary from one consensus statement to another. Much emphasis has been put on finding a single, simple approach to identify women at risk of delivering large-for-gestational-age (LGA) neonates.13 One of these approaches consists of determining plasma glucose level 1 hour after a 50-g glucose load in a nonfasting state at 24 to 28 weeks' gestation, before going on with a more definitive diagnostic OGTT.10 This approach has several limitations. First, it considers the OGTT the “gold standard” for predicting adverse neonatal outcomes such as macrosomia, an imperfect assumption that awaits the results of prospective randomized and controlled clinical trials. Second, adoption of diagnostic thresholds often deters the scientific community from considering maternal plasma glucose levels and birth weights as continuous linear variables. Third, macrosomia is often defined as an absolute birth weight exceeding 4000 g, whereas a definition based on a birth weight percentile adjusted for neonatal sex and gestational age would be more appropriate. Finally, insufficient emphasis is placed on other variables that can have a significant impact on the birth weight percentile (e.g., mother's age, maternal prepregnancy weight and weight gain during pregnancy).
While awaiting the results of large, well-designed clinical trials, practitioners must be guided by the findings of retrospective analyses. However, these can be influenced by interventions such as diet, exercise and insulin therapy. We report here the findings of a retrospective study of a population of pregnant women from the province of Quebec, in whom the level of intervention was either minimal or nonexistent. We show in this homogeneous population that neither fasting plasma glucose level nor plasma glucose 2 hours after a 75-g glucose load is a good predictor of birth weight percentile.
Methods
We reviewed records for 300 consecutive singleton pregnancies for which delivery occurred from 1995 to 1997 at the Centre hospitalier universitaire de Sherbrooke. All of these pregnant women had undergone an O'Sullivan screening test (50-g oral glucose load administered in a nonfasting state) between 24 and 28 weeks' gestation for which the resulting plasma glucose level was 8.0 mmol/L or more and had subsequently undergone a confirmatory test with a 75-g oral glucose load. Plasma glucose levels were measured before and 1, 2 and 3 hours after the latter glucose challenge. This second test was performed in the morning after a 12- to 14-hour fast. All women had been instructed to consume at least 150 g of dietary carbohydrate 3 days before the procedure. This selected population of pregnant women was theoretically at higher risk of gestational diabetes and short-term complications than women with a negative result on the screening test. Therefore, a sample of 300 pregnant women whose plasma glucose level 1 hour after a 50-g glucose load was less than 8.0 mmol/L was randomly selected from the hospital's computer database (from the same time period) for use as controls for some of the analyses presented in this paper. The 1995–1997 index period was selected because it antedated the merger of 2 separate departments of obstetrics and gynecology into a single department in one Sherbrooke hospital. This sample is unique in that it coincides with a time when the degree of aggressive intervention in gestational diabetes was low.
This retrospective study was approved by the Comité d'éthique de la recherche sur l'humain of the Centre hospitalier universitaire de Sherbrooke.
The records of every woman and neonate in the 2 groups (a total of 1200 medical records) were reviewed to obtain details on several important maternal and neonatal variables. The maternal variables were age, date of last menstrual period, prepregnancy weight, weight gain during the current pregnancy and smoking history. The entire study population was white, which reflects the usual patient population at the Centre hospitalier universitaire de Sherbrooke. Every woman underwent an ultrasound examination at about 18 weeks' gestation, which helped to determine gestational age in cases when the date of the last menstrual period could not be obtained from the mother or when there was a discrepancy of more than 2 weeks between the ultrasound estimate and the date of the last menstrual period. For the neonates, sex and birth weight were the most important variables retrieved. The birth weight percentile was calculated precisely for each newborn according to Canadian standards, as defined by Arbuckle and associates14 in 1993. To estimate more accurately and rapidly the birth weight percentiles, Arbuckle's curves for male and female singleton live births were modelled mathematically (for details, see Appendix 1 at www.cmaj.ca). The curves generated in this manner were virtually superimposable and indistinguishable from the ones recently published by Kramer and colleagues15 (data not shown). All these standards take into account gestational age at delivery and sex of the neonate, and they identify the 90th percentile of a neonate born at 40 weeks' gestation as 4200 g for boys and 4000 g for girls. These thresholds were used to define macrosomia or LGA in this study.
Although universal screening for diabetes was performed at our institution between 1995 and 1997, aggressive intervention was not routine — indeed treatment was minimal or nonexistent in certain cases. Briefly, contemporary practice involved minimal dietary advice given by the obstetrician (not a dietitian) and instructions to perform home blood glucose monitoring 3 or 4 times a day for 1 week only in the event of abnormal results at 2 time points on a 75-g OGTT, according to 1979 National Diabetes Data Group criteria (i.e., threshold values of 5.83, 10.56, 9.17 and 8.06 mmol/L at 0, 1, 2 and 3 hours respectively).16 Diabetic women were not routinely seen by a dietitian, and insulin treatment was initiated only if preprandial plasma glucose levels and 2-hour postprandial glucose levels were greater than 6.0 and 8.5 mmol/L respectively. When fasting capillary glucose levels were consistently less than 6.0 mmol/L for 1 week, no further tests were conducted during that pregnancy. Although this approach might be considered minimal, it could nevertheless have had an effect on the short-term outcomes of pregnancy. Medical records were therefore reviewed carefully for any dietary or medical intervention, specifically blood glucose monitoring, dietary consultation or insulin therapy.
All data are expressed as means with 95% confidence intervals (CIs). Simple correlations between continuous variables such as birth weight percentile and plasma glucose level were performed with Pearson's test. Multiple regression models were examined with birth weight percentile as the dependent variable. Because the magnitude of independent variables varied widely, standardized regression coefficients were also calculated to determine which independent variable was the most important in predicting birth weight percentile. Standardization was accomplished by subtracting the mean value of a given independent variable and dividing it by the standard deviation, so that all variables had a mean of 0 and a standard deviation of 1. Differences were considered significant if p was less than 0.05. Finally, receiver operating characteristic (ROC) curves for predicting birth weight at or above the 90th percentile were derived by plotting sensitivity against 1 – specificity for all plasma glucose levels obtained in the fasting state or after the 50- or 75-g glucose loads.17,18
Results
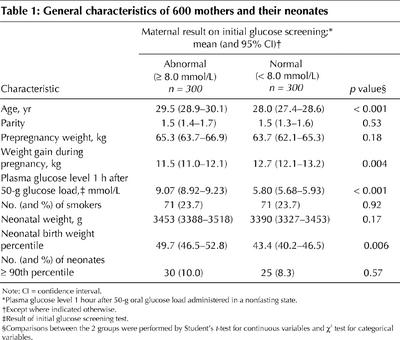
Table 1 presents the characteristics of the 600 women and their neonates. The significant difference in mean plasma glucose level 1 hour after the 50-g glucose load (9.07 v. 5.80 mmol/L; p < 0.001) was to be expected, given that the groups were defined on the basis of this test. Although the proportion of women with an abnormal screening result whose babies were LGA (body weight at or above the 90th percentile) was greater than that for women with a normal screening result, the difference was not statistically significant (difference 1.7%, 95% CI for the difference –3.0% to 6.3%). Women with an abnormal screening result were in general slightly older (p < 0.001) and gained less weight during pregnancy (p = 0.004). However, there were no significant differences between the groups in terms of parity, prepregnancy weight, smoking or absolute birth weight (p > 0.05). The distributions of the absolute birth weights of neonates in the 2 groups are illustrated in Fig. 1.
Table 1
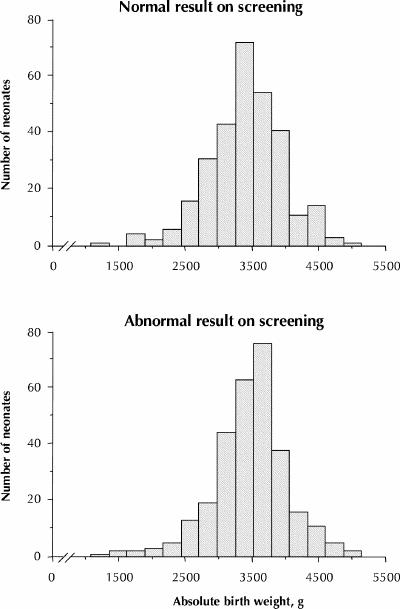
Fig. 1: Distributions of absolute weights of babies from 600 singleton pregnancies according to the results of screening with a 50-g oral glucose load (O'Sullivan screening test) administered to the mothers at 24 to 28 weeks, gestational age. Top: Babies whose mothers had a normal result on the O'Sullivan test (plasma glucose level 1 hour after 50-g glucose load less than 8.0 mmol/L; n = 300). Bottom: Babies whose mothers had an abnormal result on the O'Sullivan test (plasma glucose level 1 hour after 50-g glucose load 8.0 mmol/L or greater; n = 300). Neonates born to 6 women who were treated with insulin during their pregnancies are included in the bottom panel of this figure.
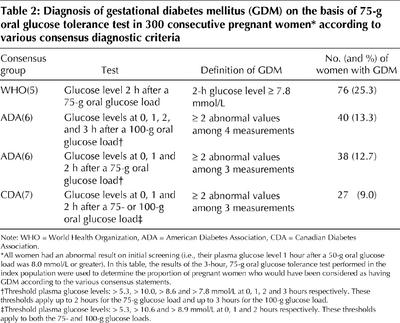
All of the women in the index group underwent a diagnostic or confirmatory 75-g OGTT. According to our retrospective analysis, the proportion of women with gestational diabetes ranged from 9.0% and 25.3%, depending on the diagnostic criteria used (Table 2). Only 6 (2.0%) of the women in the index group were put on insulin after the confirmatory OGTT. For all of these women the plasma glucose level 2 hours after a 75-g glucose load was greater than 10.0 mmol/L (Fig. 2). To avoid the confounding effect that insulin therapy might have had on the birth weight percentile of their offspring, these 6 women were excluded from further analyses, which left a study cohort of 294 women. For only 12 (4.1%) of these 294 women could we obtain evidence that they had been asked to monitor their capillary glucose for 1 week; none was subsequently put on insulin.
Table 2
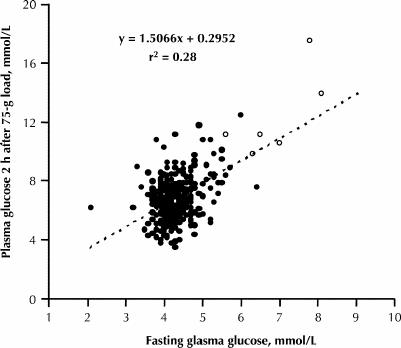
Fig. 2: Simple correlation between fasting plasma glucose level (X axis) and plasma glucose level 2 hours after a 75-g oral glucose tolerance test (OGTT) (Y axis) in 300 pregnant women who had abnormal results on initial screening with a 50-g oral glucose load. The 6 open symbols represent the women who were put on insulin after the OGTT. When the 2 women with fasting plasma glucose concentrations around 8 mmol/L were excluded, the r2 coefficient was reduced to 0.17.
The relation between fasting and 2-hour plasma glucose levels measured during the confirmatory OGTT is illustrated in Fig. 2. The correlation was only modest (r = 0.53, p < 0.001), even though these data were obtained on the same day for each woman.
The relations between birth weight percentile and 3 separate glucose levels (1 hour after a 50-g oral glucose load, fasting and 2 hours after a 75-g oral glucose load) were examined by univariate analysis. The three variables were positively but only weakly correlated with birth weight percentile: r = 0.22 (p < 0.004; n = 594), r = 0.23 (p < 0.001; n = 294) and r = 0.16 (p < 0.008; n = 294) respectively. The correlation coefficient for fasting plasma glucose was slightly greater than that for the other 2 tests, but the differences were minimal and not statistically significant. Fig. 3 presents the birth weight percentiles across various intervals of maternal plasma glucose levels as box-and-whisker plots. The interquartile ranges (upper and lower quartiles) illlustrate the wide dispersion of the observations.
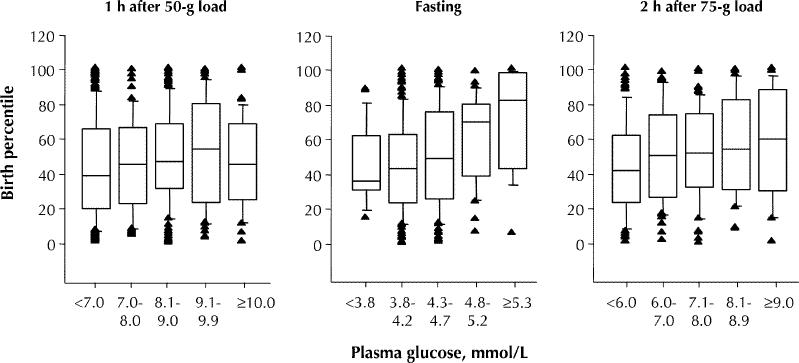
Fig. 3: Box-and-whisker plots of birth weight percentiles according to maternal plasma glucose levels after a 50- or 75-g oral glucose load. The top of each box represents the third quartile (75th percentile) and the bottom the first quartile (25th percentile) of the birth weight percentile. The median of each distribution is indicated by the horizontal line within the box. Weight percentile values below the 10th or above the 90th percentile are shown individually. The numbers of pregnant women for each plasma glucose variable were as follows: 1 hour after 50-g oral glucose load (O'Sullivan test), 594; fasting plasma glucose, 294; and 2 hours after 75-g oral glucose load, 294.
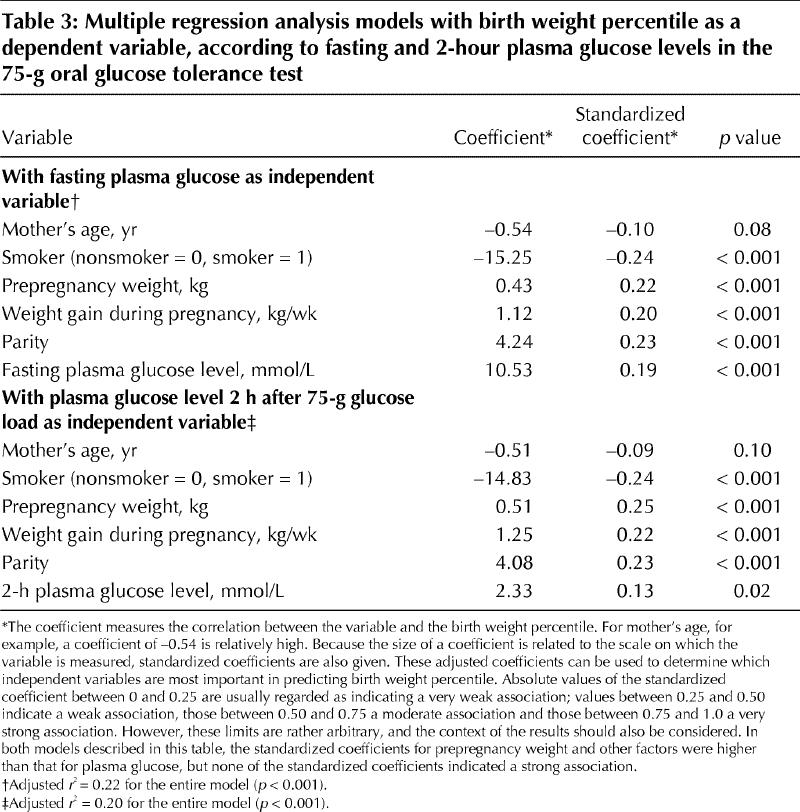
Table 3 gives the details of 2 multiple regression analysis models that were prepared for fasting and 2-hour plasma glucose levels, with birth weight percentile as the dependent variable. In both models, prepregnancy weight, weight gain during pregnancy and parity were significantly and positively associated with birth weight percentile, whereas the association with smoking (considered as a dichotomized variable) was statistically significant but negative. Birth weight percentile correlated with both the fasting glucose level and the level 2 hours after a 75-g glucose load when these were entered separately into the models. When adjusted to eliminate the effect of scale, the standardized regression coefficients for fasting and 2-hour plasma glucose levels were reduced to 0.19 (p < 0.001) and 0.13 (p = 0.02) respectively. The coefficient for fasting plasma glucose was only marginally higher than that for the 2-hour level and explained less than 4% of the variability in birth weight percentile (r2 = 0.192). Even when several variables were considered, the adjusted r2 value for fasting plasma glucose model explained only 22% of the total variability in birth weight percentile. When fasting and 2-hour plasma glucose levels were entered into the same regression model, without changing the other independent variables, fasting plasma glucose remained statistically significant (standardized regression coefficient 0.17, p = 0.003), whereas the 2-hour plasma glucose level no longer predicted the birth weight percentile (standardized regression coefficient 0.07, p = 0.20; data not shown).
Table 3
The ability of 3 plasma glucose variables (1 hour after a 50-g glucose load, fasting and 2 hours after a 75-g glucose load) to predict birth weight at or above the 90th percentile is illustrated in Fig. 4. The line for an ideal test with 100% sensitivity and 100% specificity would extend from the origin to the upper left corner of the graph (i.e., a vertical line). From that perspective, it is apparent that the predictive value of these 3 variables was mediocre, since all of the curves are very close to the diagonal. The area under each ROC curve ranged from 0.52 to 0.67, which demonstrates modest risk stratification performance.17,18 These areas under the curve were not statistically different from one another (Wilcoxon's test, p > 0.05). It should be noted, however, that fasting plasma glucose levels were again marginally better than either of the other 2 levels. It was not possible to define reliable cutoff points to predict LGA neonates.
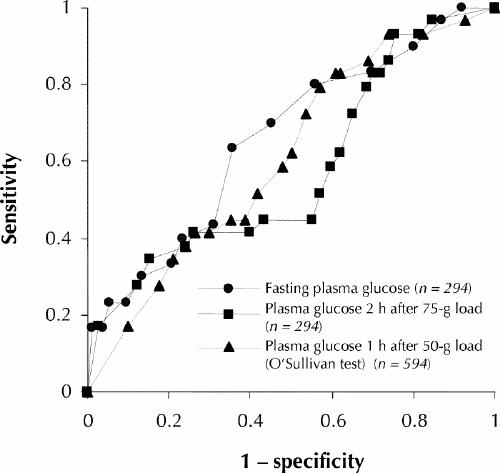
Fig. 4: Receiver operating characteristic (ROC) curves for large-for-gestational-age neonates (90th percentile or larger) against 3 plasma glucose variables: fasting plasma glucose, plasma glucose 2 hours after a 75-g glucose load and plasma glucose 1 hour after a 50-g glucose load (the O'Sullivan screening test). The areas under the ROC curves were 0.67, 0.61 and 0.52 respectively, which indicates the relatively poor diagnostic performance of these tests, and there were no statistically significant differences among them (p > 0.05). The dotted diagonal line illustrates a theoretical test in which there would be no diagnostic discrimination.
Interpretation
In this study we have reported our institutional experience with the 75-g OGTT in a homogeneous population of pregnant white women all of whom had a screening plasma glucose level (1 hour after a 50-g glucose load, the O'Sullivan test) of 8.0 mmol/L or higher. If we accept the proposition that the O'Sullivan test is likely to detect women at high risk for neonatal macrosomia,19,20,21 this group of women would be expected to be at higher risk of delivering LGA neonates. However, despite a low level of intervention (in terms of insulin therapy), our data offer no support for that expectation: just 10% of infants born to these women were LGA, which is precisely the prevalence that would be expected on the basis of the Canadian standards established by Arbuckle and associates14 and Kramer and colleagues.15
Our data have confirmed other reports of a correlation between birth weight and fasting glucose levels or levels after a 75-g glucose load.22,23,24 However, it is clear that birth weight is poorly predicted by any one of these plasma glucose variables. The correlation between birth weight percentile and fasting or 2-hour plasma glucose levels explains no more than 5% (r2 = 0.232, p < 0.001) of the total variability in birth weight percentile, even less when considered in a multiple regression model. In our study, the mother's prepregnancy weight, weight gain during pregnancy and parity were stronger correlates of birth weight percentile than plasma glucose itself, which re-emphasizes the fact that birth weight is largely influenced by genetic and environmental factors.25,26,27,28,29 As for the plasma glucose variables, we observed that the fasting plasma glucose level always correlated better with birth weight than the glucose level 2 hours after a 75-g glucose load, in both univariate and multivariate analyses, as well as with ROC curves.
A confounding factor for the low prevalence of LGA neonates may have been the study population itself, which was almost exclusively white and possibly at lower risk for macrosomia than some other populations, such as Hispanic women.30,31 We also acknowledge that 27.0% of the women in the current study reported a history of smoking. However, such information was difficult to retrieve retrospectively, and it was impossible to determine what proportion of the women continued smoking during pregnancy, a factor known to influence birth weight.26,27 We should also consider the possibility that the 75-g glucose load (as opposed to a 100-g load) might have been less sensitive in identifying women at greater risk of delivering an LGA neonate. However, there is evidence that a smaller glucose load has a negligible influence on glycemic excursion.32,33,34 Finally, the low prevalence of LGA neonates might be explained by dietary intervention not indicated in the medical records, but this is unlikely since most of the women were counselled solely by the obstetric team, with no additional support from a dietitian. Moreover, in a recent evidence-based review of the topic, dietary therapy was not associated with any clear benefits.35
The questions therefore remain as to how many women need to undergo a diagnostic glucose challenge (and the subsequent expense, inconvenience and anxiety of treatment) and what the cost of preventing some of the adverse outcomes of pregnancy will be. Large clinical trials are needed to answer these important questions. In the meantime, if clinicians and their patients want to use glucose tolerance testing to predict future birth weight, however imperfectly, fasting plasma glucose is a better predictor than either the 1-hour, 50-g O'Sullivan test or the 2-hour, 75-g OGTT.
β See related article page 429
Footnotes
This article has been peer reviewed.
Contributors: Drs. Ouzilleau, Roy, Carpentier and Maheux all participated in the acquisition, analysis and interpretation of the data, and review of the manuscript. Dr. Maheux was responsible for the conception and design of the study; he also wrote the manuscript. Dr. Carpentier also provided a critical revision of the manuscript. Ms. Leblanc reviewed the medical records of the 300 women who had normal results on initial screening. All authors gave final approval of the version to be published.
Acknowledgments: We are grateful to the Centre de recherche clinique du Centre hospitalier universitaire de Sherbrooke (CHUS) and the Joe Beattie Memorial Fund for their financial support. We thank Peter Hughes for editorial assistance, as well as our colleagues Jean-Marie Moutquin, Daniel Blouin and Philippe de Wals for their input during preparation of this manuscript. Pierre Maheux was supported by a scholarship from the Canadian Diabetes Association.
Competing interests: None declared.
Correspondence to: Dr. Pierre Maheux, Division of Endocrinology and Metabolism, Université de Sherbrooke, 3001, 12e Avenue Nord, Sherbrooke QC J1H 5N4; fax 819 564-5292; Pierre.Maheux@USherbrooke.ca
References
- 1.Dornhorst A, Chan SP. The elusive diagnosis of gestational diabetes. Diabet Med 1998;15(1):7-10. [DOI] [PubMed]
- 2.Buchanan TA, Kjos SL. Gestational diabetes: Risk or myth? J Clin Endocrinol Metab 1999;84(6):1854-7. [DOI] [PubMed]
- 3.Jarrett RJ. Gestational diabetes: a non-entity? BMJ 1993;306(6869):37-8. [DOI] [PMC free article] [PubMed]
- 4.Ratner RE. Clinical review 47. Gestational diabetes mellitus: After three international workshops do we know how to diagnose and manage it yet? J Clin Endocrinol Metab 1993;77(1):1-4. [DOI] [PubMed]
- 5.WHO Study Group. Prevention of diabetes mellitus. Report of a WHO Study Group. No 844 of Technical Reports series. Geneva, Switzerland: World Health Organization; 1994. [PubMed]
- 6.American Diabetes Association. Gestational diabetes mellitus. Diabetes Care 2002;25(Suppl 1):S94-6.
- 7.Meltzer S, Leiter L, Daneman D, Gerstein HC, Lau D, Ludwig S, et al. 1998 clinical practice guidelines for the management of diabetes in Canada. CMAJ 1998; 159(8 Suppl):S1-29. [PMC free article] [PubMed]
- 8.Canadian Task Force on the Periodic Health Examination. Periodic health examination, 1992 update: 1. Screening for gestational diabetes mellitus. CMAJ 1992;147(4):435-43. [PMC free article] [PubMed]
- 9.Solomon CG, Willett WC, Rich-Edwards J, Hunter DJ, Stampfer MJ, Colditz GA, et al. Variability in diagnostic evaluation and criteria for gestational diabetes. Diabetes Care 1996;19(1):12-6. [DOI] [PubMed]
- 10.Kjos SL, Buchanan TA. Gestational diabetes mellitus. N Engl J Med 1999;341 (23): 1749-56. [DOI] [PubMed]
- 11.O'Sullivan JB, Mahan CM. Criteria for the oral glucose tolerance test in pregnancy. Diabetes 1964;13(3):278-85. [PubMed]
- 12.O'Sullivan JB, Charles D, Mahan CM, Dandrow RV. Gestational diabetes and perinatal mortality rate. Am J Obstet Gynecol 1973;116(7):901-4. [DOI] [PubMed]
- 13.Naylor CD, Sermer M, Chen E, Farine D. Selective screening for gestational diabetes mellitus. N Engl J Med 1997;337(22):1591-6. [DOI] [PubMed]
- 14.Arbuckle TE, Wilkins R, Sherman GJ. Birth weight percentiles by gestational age in Canada. Obstet Gynecol 1993;81(1):39-48. [PubMed]
- 15.Kramer MS, Platt RW, Wen SW, Joseph KS, Allen A, Abrahamowicz M, et al, for the Fetal/Infant Study Group of the Canadian Perinatal Surveillance System. A new and improved population-based Canadian reference for birth weight for gestational age. Pediatrics 2001;108(2):e35. Available: www.pediatrics.org/cgi/content/full/108/2/e35 (accessed 2003 Jan 7). [DOI] [PubMed]
- 16.National Diabetes Data Group. Classification and diagnosis of diabetes mellitus and other categories of glucose intolerance. Diabetes 1979;28(12):1039-57. [DOI] [PubMed]
- 17.Swets JA. Measuring the accuracy of diagnostic systems. Science 1988; 240 (4857): 1285-93. [DOI] [PubMed]
- 18.Hanley JA, McNeil BJ. The meaning and use of the area under a receiver operating characteristic (ROC) curve. Radiology 1982;143(1):29-36. [DOI] [PubMed]
- 19.Sermer M, Naylor CD, Gare DJ, Kenshole AB, Ritchie JWK, Farine D, et al. Impact of increasing carbohydrate intolerance on maternal-fetal outcomes in 3637 women without gestational diabetes. Toronto Tri-Hospital Gestational Diabetes Project. Am J ObstetGynecol 1995;173(1):146-56. [DOI] [PubMed]
- 20.Persson B, Hanson U. Neonatal morbidities in gestational diabetes mellitus. Diabetes Care 1998;21(Suppl 2):B79-84. [PubMed]
- 21.Landy HJ, Gomez-Marin O, O'Sullivan MJ. Diagnosing gestational diabetes mellitus: use of a glucose screen without administering the glucose tolerance test. Obstet Gynecol 1996;87(3):395-400. [DOI] [PubMed]
- 22.Langer O, Mazze R. The relationship between large-for-gestational-age infants and glycemic control in women with gestational diabetes. Am J Obstet Gynecol 1988;159(6):1478-83. [DOI] [PubMed]
- 23.Moses RG, Calvert D. Pregnancy outcomes in women without gestational diabetes mellitus related to the maternal glucose level. Is there a continuum of risk? Diabetes Care 1995;18(12):1527-33. [DOI] [PubMed]
- 24.Sacks DA, Greenspoon JS, Abu-Fadil S, Henry HM, Wolde-Tsadik G, Yao JF. Toward universal criteria for gestational diabetes: the 75-gram glucose tolerance test in pregnancy. Am J Obstet Gynecol 1995;172(2 Pt 1):607-14. [DOI] [PubMed]
- 25.Goldman M, Kitzmiller JL, Abrams B, Cowan RM, Laros RK Jr. Obstetric complications with GDM. Effects of maternal weight. Diabetes 1991;40(Suppl 2):79-82. [DOI] [PubMed]
- 26.Knopp RH, Bergelin RO, Wahl PW, Walden CE. Relationships of infant birth size to maternal lipoproteins, apoproteins, fuels, hormones, clinical chemistries, and body weight at 36 weeks gestation. Diabetes 1985;34(Suppl 2):71-7. [DOI] [PubMed]
- 27.Green JR, Schumacher LB, Pawson IG, Partridge JC, Kretchmer N. Influence of maternal body habitus and glucose tolerance on birth weight. Obstet Gynecol 1991;78(2):235-40. [PubMed]
- 28.Langer O. Gestational diabetes: a contemporary management approach. Endocrinologist 1995;5(3):180-8.
- 29.Sacks DA. Fetal macrosomia and gestational diabetes: What's the problem? Obstet Gynecol 1993;81(5 Pt 1):775-81. [PubMed]
- 30.Homko CJ, Sivan E, Nyirjesy P, Reece EA. The interrelationship between ethnicity and gestational diabetes in fetal macrosomia. Diabetes Care 1995;18(11):1442-5. [DOI] [PubMed]
- 31.Green JR, Pawson IG, Schumacher LB, Perry J, Kretchmer N. Glucose tolerance in pregnancy: ethnic variation and influence of body habitus. Am J ObstetGynecol 1990;163(1 Pt 1):86-92. [DOI] [PubMed]
- 32.Berkus MD, Langer O. Glucose tolerance test periodicity: the effect of glucose loading. Obstet Gynecol 1995;85(3):423-7. [DOI] [PubMed]
- 33.Castro A, Scott JP, Grettie DP, Macfarlane D, Bailey RE. Plasma insulin and glucose responses of healthy subjects to varying glucose loads during three-hour oral glucose tolerance tests. Diabetes 1970;19(11):842-51. [DOI] [PubMed]
- 34.Brustman LE, Gela BD, Moore M, Reilly KD, Langer O. Variations in oral glucose tolerance tests: the 100- versus 75-g controversy. J Assoc Acad Minor Phys 1995;6(2):70-2 [PubMed]
- 35.Walkinshaw SA. Dietary regulation for “gestational diabetes” [Cochrane review]. In: The Cochrane Library; Issue 1, 2002. Oxford: Update Software.


