Abstract
The urea transporters UT-A1 and UT-A3 mediate rapid transepithelial urea transport across the inner medullary collecting duct (IMCD). In a previous study, using a new mouse model in which both UT-A1 and UT-A3 were genetically deleted from the IMCD (UT-A1/3−/− mice), we investigated the role of these transporters in the function of the renal inner medulla. Here we report a series of studies investigating more generally the renal phenotype of UT-A1/3−/− mice.
Pathological screening revealed abnormalities in both the testis (increased size) and kidney (decreased size and vascular congestion) of UT-A1/3−/− mice. Total urinary nitrate and nitrite excretion rates in UT-A1/3−/− mice were more than double those in wildtype mice. Total renal blood flow was not different between UT-A1/3−/− and wildtype mice, but underwent a greater percentage decrease in response to NG-Nitro-L-arginine Methyl Ester Hydrochloride (L-NAME) infusion. Whole kidney glomerular filtration rate was not different in UT-A1/3−/− mice compared to controls and underwent a similar increase in response to a greater dietary protein intake. Fractional urea excretion was markedly elevated in UT-A1/3−/− mice on a 40% protein diet, reaching 102.4 ± 8.8% of the filtered load, suggesting that there may be active urea secretion along the renal tubule.
Although there was a marked urinary concentrating defect in UT-A1/3−/− mice, there was no decrease in aquaporin-2 or -3 expression. Furthermore, although urea accumulation in the inner medulla was markedly attenuated, there was no decrease in NaCl concentration in tissue from outer medulla or 2 levels of the inner medulla.
Index words: UT-A, vasopressin, concentrating mechanism, glomerular filtration rate, fractional excretion
INTRODUCTION
In mammals, nitrogen from dietary protein in excess of that required to satisfy the body’s needs is converted to urea in the liver as part of the urea/ornithine cycle. The kidneys excrete this urea. In humans on moderate or high levels of protein intake, urea production and excretion can amount to several hundred millimoles per day. Such large amounts of any other solute, for example mannitol [1, 2], would obligate large amounts of water excretion by causing an osmotic diuresis. A basic model of urea handling was proposed by Berliner et al [3], hypothesizing that an osmotic diuresis does not occur with urea owing to the accumulation of urea in the inner medullary interstitium, which osmotically balances the high level of urea in the inner medullary collecting duct (IMCD) and urine. This urea accumulation is thought to be largely a consequence of rapid facilitated urea transport across the IMCD epithelium mediated by phloretin-sensitive urea transporters.
In a recent study [4], we demonstrated that genetic deletion of the urea transporters UT-A1 and UT-A3 (generating of so-called “UT-A1/3−/− mice”) completely abolished phloretin-sensitive, vasopressin-regulated urea transport across the IMCD. The deletion of these urea transporters resulted in a marked defect in inner medullary urea accumulation and a marked limitation in the ability of the kidneys to conserve water due to a urea-dependent osmotic diuresis. Furthermore, although urea was depleted from the inner medullary tissue, the concentrations of Na, K, and Cl were unaltered relative to wildtype mice, contrary to what is predicted by the passive concentrating hypothesis of Stephenson [5] and Kokko and Rector [6].
In our previous study, UT-A1/3−/− mice were used to investigate the role of UT-A1 and UT-A3 in the function of the renal inner medulla. In the series of experiments reported in this manuscript we investigate more generally the renal function of UT-A1/3−/− mice. We address whether there are changes in renal structure, renal blood flow, glomerular filtration rate (GFR), corticomedullary solute gradients and Na transporter or aquaporin expression consequent to the deletion of the urea transporters. Furthermore, we have carried out careful measurements of fractional urea excretion in UT-A1/3−/− mice to address overall urea handling in kidneys in which the main urea reabsorptive mechanism beyond the proximal tubule has been deleted. We have also investigated the renal effects of changes in dietary protein intake in the UT-A1/3−/− mice to determine whether these effects are dependent on collecting duct urea reabsorption and the associated medullary urea recycling process. Finally, because UT-A urea transporters are expressed in numerous extra-renal tissues [7], we have begun to examine whether a non-renal phenotype exists in UT-A1/3−/− mice.
METHODS
All animals used in this study were UT-A1/3−/− mice in a C57BL6 background after 10 generations of backcrosses. All studies in this paper were done under the auspices of two ACUC approved animal protocols; 2-KE-31 and K-058-MDB-04.
Whole animal pathology
UT-A urea transporters are expressed in numerous extra-renal tissues, including the heart, liver, brain and testis [7]; however their role in these tissues remains unclear. Therefore, we performed whole animal necroscopy and pathological analysis of 33 different organs and tissues to determine if deletion of urea transporters resulted in a non-renal phenotype. Tissues analyzed: Kidneys, spleen, skeletal muscle, liver, testis, reproductive tract, brain, GI tract (all levels), lungs, heart, thymus, pancreas, sciatic nerve, trachea, spinal cord, esophagus, femur, teeth, nasal sinuses, gall bladder, ears, urinary bladder, bone marrow, eyes, tongue, skin, parathyroid glands, Harderian glands, pituitary gland, thyroid glands, salivary glands, adrenal glands and lymph nodes. For analysis, 3 male wildtype mice and 3 male knockout mice were compared. Animals were euthanized and for some organs (see Table 1) wet weight was measured. All other tissues were emersion fixed in formaldehyde, embedded in paraffin and histopathologic diagnosis was performed. Kidney images were captured using a Leica MZ FL III Fluorescence Stereomicroscope.
Table 1.
Mouse necroscopy. Wet tissue weights for male mice
| n = >4 | Wildtype | Knockout |
|---|---|---|
| Bodyweight (g) | 22.4 ± 1.4 | 21.7 ± 1.0 |
| Brain (g) | 0.443 ± 0.015 | 0.420 ± 0.003 |
| Kidneys (g) | 0.308 ± 0.024 | 0.245 ± 0.012 * |
| Kidney weight/Brain weight | 0.686 ± 0.043 | 0.546 ± 0.015 * |
| Liver (g) | 1.363 ± 0.028 | 1.116 ± 0.072 * |
| Liver weight/Brain weight | 3.078 ± 0.044 | 2.658 ± 0.1583 |
| Spleen (g) | 0.0797 ± 0.0055 | 0.0527 ± 0.0068 * |
| Spleen weight/Brain weight | 0.180 ± 0.016 | 0.125 ± 0.016 |
| Testis (g): Left | 0.0607 ± 0.0075 | 0.0803 ± 0.0033 |
| Right | 0.0603 ± 0.0064 | 0.0780 ± 0.0057 |
| Combined | 0.0605 ± 0.0044 | 0.07917 ± 0.0029 * |
| Testes weight/Brain weight | 0.136 ± 0.010 | 0.186 ± 0.014 * |
| Heart (g) | 0.126 ± 0.008 | 0.109 ± 0.005 |
| Thymus (g) | 0.0683 ± 0.007 | 0.0563 ± 0.002 |
Renal blood flow
Measurements of renal blood flow (RBF) were performed in male UT-A1/3−/− mice (10–12 weeks old). Mice were anesthetized with inactin (100 mg/kg) and ketamine (100 mg/kg). The trachea was cannulated. A cannula was placed in the jugular vein for substance injection and the infusion of isotonic saline at a rate of 0.35 ml/h. Blood pressure monitoring was performed using the left femoral artery. After a flank incision, the left renal artery was carefully dissected free to permit placement of a 0.5PSB nanoprobe connected to a T402-PB flowmeter (Transonic Systems Inc.). The probe was held in place with a micromanipulator. The flow signal was digitized and analyzed using PowerLab software (ADInstruments). RBF was determined for 10 minutes, and values represent the 10-minute average. Following baseline measurements, the response of RBF to intravenous bolus injections of NG-Nitro-L-arginine Methyl Ester Hydrochloride L-NAME (1μg/g BW) was assessed.
Nitrate and nitrite measurements
As an index of total kidney nitric oxide production, we determined the levels of both nitrate and nitrite in urine. A colorimetric assay (Cayman Chemical) was used according to the manufacturer’s guidelines.
Vasopressin measurements
Serum vasopressin levels were measured by radioimmunoassay (Alpco Diagnostics). Mice were euthanized by decapitation, the blood collected and serum processed as described above. Since the assay required 1ml of serum, and the amount of serum collected from each mouse by decapitation was approximately 250μls, four mice were used for one basal measurement (12 total animals per group, n=3).
Metabolic cage studies
Littermate wildtype and UT-A1/3−/− male mice from heterozygous crosses were used for all studies. Animals were maintained in mouse metabolic cages (Hatteras Instruments) for the duration of the study, under controlled temperature and light conditions (12 hour light and dark cycles). Several experimental manipulations were performed as follows:
Effect of dietary protein content on urinary concentrating ability and solute accumulation
Mice received free access to pelleted diet containing 4, 20 or 40% protein by weight (as casein) for 7 days before metabolic cage studies (the starch and sucrose content of the diet was altered in inverse proportion of casein in order to ensure an equivalent calorie intake). Subsequently, mice received a fixed daily ration of 5g of gelled diet per 20g body weight (BW) per day, also with either 4, 20 or 40% protein. The gelled diet was made up of 1ml of deionized water, 4g of special low NaCl synthetic food (0.001% Na w/w, Research Diets), 0.2 mmole NaCl and 25mg agar. Pre-weighed drinking water was provided ad libitum during the initial period of the study. After three days of adaptation to the cages, urine was collected under mineral oil in pre-weighed collection vials for successive 24hr periods. Urine volume was measured gravimetrically assuming a density of one. After the initial collection period, each mouse received a fixed daily ration of 5.7g of gelled diet per 20g BW per day for 24hrs containing 1.7mls of deionized water. Mice did not have access to supplemental drinking water during this period. Urine was collected under mineral oil for 24hrs. Blood was collected as detailed below and kidneys were processed as detailed in Solute content of kidney.
Serum and urine collection
Mice were anaesthetized with isoflurane and blood was collected using retro-orbital eye bleeding. Serum was separated from whole blood using centrifugation at 2,000g and StatSampler collection tubes (StatSpin Inc). Sodium, potassium, chloride, creatinine, urea, glucose, calcium, albumin, magnesium, phosphorus, total protein and uric acid levels in serum were determined using an autoanalyser. Urine samples were centrifuged at 14,000g for 5 min and sodium, potassium, chloride, creatinine and urea levels were determined using an autoanalyser. Serum and urine osmolalities were determined using a vapor pressure osmometer (Wescor).
Solute content of kidney
Kidneys were removed and rapidly dissected into cortex, outer-medulla, inner medulla base (IM1) and papilla (IM2/3) as shown in Figure 9. Segments were blotted on filter paper and placed into pre-weighed microfuge tubes. The entire procedure for dissection and weighing the tissue is estimated to have been less than 3min per kidney. Samples were weighed immediately and subsequently dried over a desiccant at 60° C for 8hrs (after which weight remained constant). After re-weighing, 25μls of deionized, distilled water was added to each tube, tubes were capped, placed at 90° C for 3mins and, after brief centrifugation, stored at 4° C for 24hrs. After centrifugation for 1min at 8,000g the supernatant was analyzed as follows; sodium and potassium concentrations were determined in 5μl samples (diluted in 5mls of 100ppm lithium solution) using a flame spectrophotometer (Model 2655-10, Sherwood Scientific), osmolality was determined in a 10μl sample using a vapor pressure osmometer (Wescor) and urea concentration was measured using a commercially available assay (Biotron Diagnostics). To determine initial solute concentrations, calculations were performed as detailed in the work of Schmidt-Nielsen et al. [8].
Figure 9.
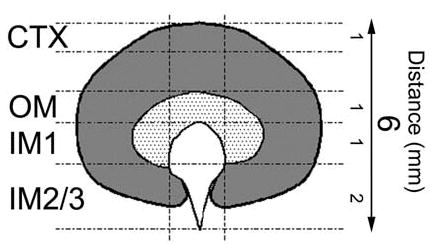
Schematic representation of mouse kidney. The sections of tissue analyzed for determining the solute content along the corticomedullary axis are shown. The average length of the section (in mm) is also highlighted. CTX; cortex, OM; outer medulla, IM1; inner medulla base, IM2/3; inner medulla papillary tip.
Determination of whole kidney glomerular filtration rate (GFR).: FITC-inulin clearance method
GFR measurements were made in conscious mice using FITC-inulin clearance and a modified protocol based on the work of Qi et al. [9]. Mice received free access to pelleted diet (Research diets) containing either 4 or 40% protein by weight (as casein) for 7 days before metabolic cage studies. Mice were housed individually in metabolic cages for three days (as detailed above) before surgery and received gelled food. On the fourth day mice were anaesthetized with isoflurane and an osmotic minipump (Model 2001, Alzet), containing ~3% FITC-inulin, was implanted subcutaneously. Inulin solution was prepared exactly as detailed in [9]. Mice were returned to metabolic cages and continued to receive free access to water and gelled food. On day 6 post-surgery, urine was collected under mineral oil for 24hrs. During urine collection, the collection vessel and metabolic cage base were covered with aluminum foil to minimize exposure of the urine to light. Cages were washed twice with 5mls of 500mM HEPES (pH 7.4) to collect residual fluorescence. Serum was collected by retro-orbital eye bleeds as described above. Fluorescence was measured in 10μl samples as previously described [9] using a Victor-3 1420 Multi-label Counter (Wallac) and the GFR estimated by the 24hr urinary FITC-inulin excretion rate i.e. urinary fluorescence counts per 24hr divided by the concentration of plasma FITC-inulin.
Adaptive changes in renal sodium and water channels
In order to assess whether altered expression of other transporters involved in salt balance or urine concentration occurred in UT-A1/3−/− mice, animals were housed in metabolic cages as detailed above and received a 20% protein diet throughout the study. After 3 days adaptation, half the animals studied were switched to a water restricted diet, containing 1.7 ml water per day, for 36hrs and did not have access to supplemental drinking water during this period. Mice were killed by decapitation and the kidneys processed for immunoblotting.
Immunoblotting
Immunoblotting was performed as previously described [10] using affinity purified, polyclonal antibodies targeted to aquaporin-1 [10], aquaporin-2 [11], aquaporin-3 [12], all three subunits (α, β, γ) of the epithelial Na channel (ENaC) of the collecting duct [13], type 1 Na+/K+(NH4+)-2Cl−-cotransporter (BSC-1) [14], type 3 Na+/H+-exchanger (NHE3) [15], thiazide-sensitive Na-Cl cotransporter (TSC) [16] and the type 2 Na-dependent phosphate transporter (NaPi-2) [16]. For immunoblotting, antibodies were used at a final IgG concentration of between 0.1-0.2μg/ml. A commercial mouse monoclonal antibody to the Na-K-ATPase α-1 subunit (No. 05-369, Upstate Biotechnology, Lake Placid, NY.) was also used. Quantification of the band densities from immunoblots was carried out by laser densitometry (Molecular Dynamics, San Jose, CA). To facilitate comparisons, we normalized the densitometry values such that the mean for the wildtype control mice is defined as 1 (arbitrary units). Quantitative data are presented as mean ± standard error of mean (SEM).
RESULTS
Survey of tissues
Since urea transporters are expressed in numerous extra-renal tissues, a comprehensive pathological survey of numerous tissues from UT-A1/3−/− mice was performed to determine if any abnormalities were present. Observations were made from 33 tissues (see Methods for full list) by both gross (wet weight) and microscopic anatomy from three age-matched UT-A1/3−/− or wildtype mice. Except for the kidney and testis, no abnormalities were apparent. When normalized by brain weight, the kidneys were significantly smaller and the testis significantly larger in knockout animals compared to controls (Table 1). However, microscopic analysis could not detect any differences in cell number, cell type or morphology. Resected kidneys of UT-A1/3−/− mice also had greater blood congestion than kidneys from wild-type animals (representative images are shown in Figure 1A and B), especially in the renal medulla (Figure 1C and D).
Figure 1.
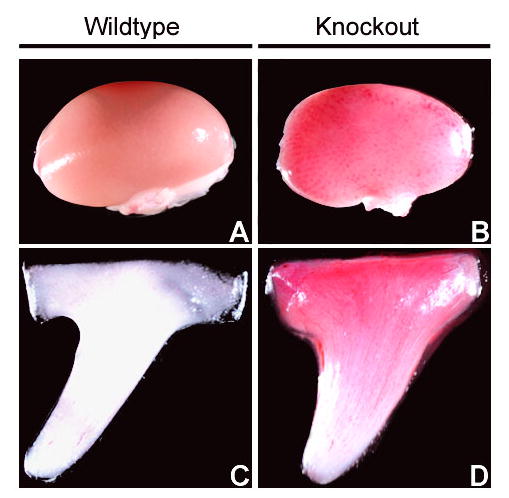
Blood congestion in kidneys of UT-A1/3−/− mice. Representative images of whole kidney and inner medulla from wildtype (A and C) or UT-A1/3−/− mice (B and D) show greater blood congestion in knockout mice.
Urinary NO excretion
Measurements of total urinary nitrate and nitrite (NOx) excretion rates under basal conditions on a 20% protein diet (24 hour urine collections) were performed to determine if the blood congestion observed in UT-A1/3−/− mice kidneys may be related to abnormal nitric oxide (NO) production by the kidney. In knockout mice, NOx excretion (127.0 ± 7.8 nmol/gBW/day) was more than double that in wildtype controls (52.5 ± 9.5 nmol/gBW/day) (Figure 2).
Figure 2.
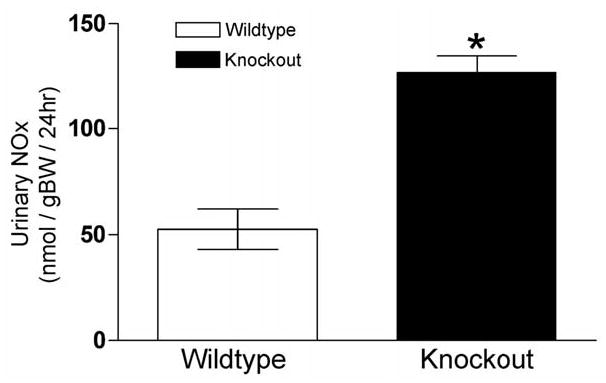
Twenty-four hour total urinary nitrate and nitrite (NOx) excretion. Values are means ± SE, n = 6. Significant difference (p<0.01) between the groups is indicated by *. UT-A1/3−/− mice (solid bars) have a significantly greater NOx excretion than wildtype mice (clear bars).
Circulating vasopressin levels
Another factor that could alter renal blood flow dynamics is vasopressin. Consequently, we measured plasma vasopressin levels in UT-A1/3−/− and wildtype mice. Under basal conditions (free access to water) on a 20% protein diet, we observed no difference in plasma vasopressin levels between the groups (Figure 3).
Figure 3.
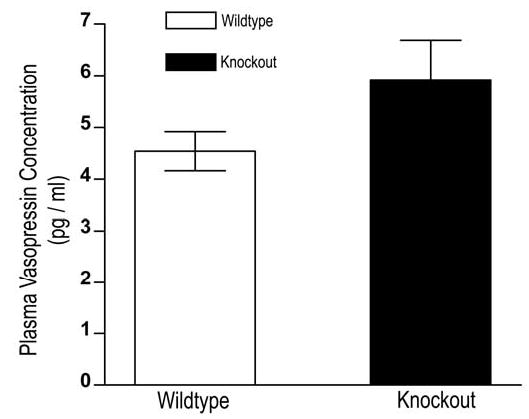
Plasma vasopressin levels of wildtype (clear bars) and UT-A1/3−/− mice (solid bars) under basal conditions. Values are means ± SE; n=3.
Total renal blood flow
Since greater blood congestion was observed in the kidneys of UT-A1/3−/− mice, we carried out measurements of total renal blood flow in anesthetized mice (Figure 4) using an ultrasonic flow probe. Total renal blood flow in the UT-A1/3−/− mice was not significantly different from that observed in age-matched wildtype control mice. Inhibition of NO production by infusion of L-NAME resulted in a significant decrease in total renal blood flow in both knockout mice and controls. However, the percentage decrease due to L-NAME was significantly greater in UT-A1/3−/− mice (39.2 ± 2.4% versus 27.1 ± 4.9%), suggesting a greater role for NO in the maintenance of blood flow.
Figure 4.
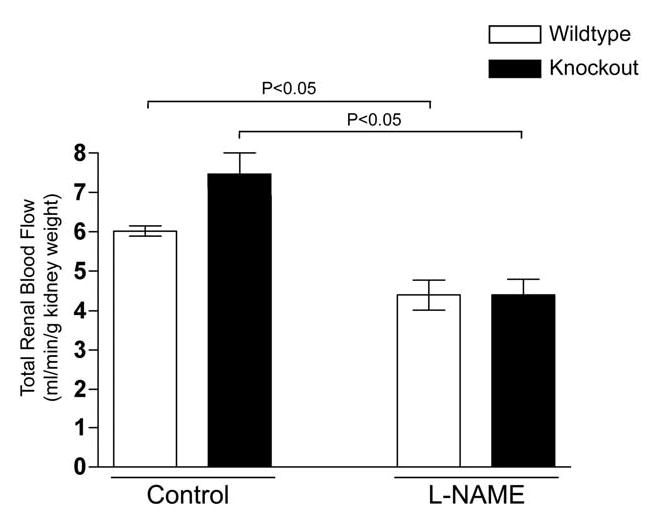
Total renal blood flow (RBF) in wildtype (clear bars) and UT-A1/3−/− mice (solid bars). Values are means ± SE. Administration of NG-Nitro-L-arginine Methyl Ester Hydrochloride (L-NAME, 1μg/g bodyweight) statistically (ANOVA) decreased RBF in both groups of animals (n = 5). However, no significant difference was observed in RBF between wildtype and UT-A1/3−/− mice.
Glomerular filtration rate (GFR)
We determined GFR in conscious UT-A1/3−/− and wildtype mice on two levels of protein intake, 4% and 40%, using FITC-inulin clearance (Figure 5). Increasing the protein content of the diet more than doubled the FITC-inulin clearance in both UT-A1/3−/− mice and wildtype controls (Figure 5 and Table 2). However, no significant differences were observed in inulin clearance between UT-A1/3−/− and wildtype mice under either dietary condition, even when corrected for bodyweight (Figure 5 and Table 2).
Figure 5.
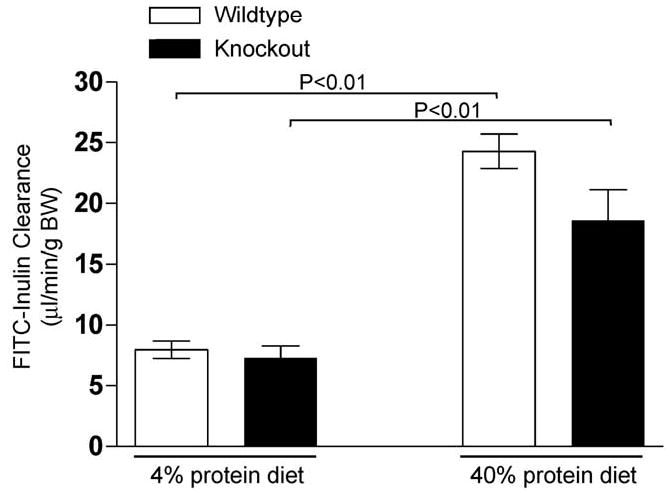
Glomerular filtration rate (GFR) in conscious male mice. FITC-inulin clearance for wildtype (clear bars) and UT-A1/3−/− mice (solid bars) was determined by a microosmotic minipump method. Representative values are mean ± SE and significant differences (ANOVA) are indicated. Administration of a high protein diet (40%) for 7 days dramatically increased GFR in both groups of animals (n = 5). However, no significant difference was observed in GFR between wildtype and UT-A1/3−/− mice.
Table 2.
Urinary concentrating ability, plasma electrolytes and urinary excretion rates
| 4% Protein | 40% Protein | |||
|---|---|---|---|---|
| N = 5 for each group | Wildtype | Knockout | Wildtype | Knockout |
| Bodyweight (g) | 22.6 ± 1.3 | 20.9 ± 0.3 | 20.4 ± 0.3 | 20.0 ± 0.6 |
| Urine Volume (ml/24hr) | 2.05 ± 0.27 | 2.44 ± 0.30 | 2.12 ± 0.18 | 7.80 ± 0.50* |
| Urine osmolality (mosm/kg H2O) | 646 ± 24 | 571 ± 51 | 2613 ± 141 | 788 ± 13* |
| Osmolar excretion (mosm/24hr) | 1392 ± 76 | 1350 ± 57 | 5377 ± 422 | 6151 ± 404 |
| U/P Inulin | 112 ± 9 | 85 ± 6* | 262 ± 28 | 70 ± 9* |
| Inulin clearance (ml/day) | 290.8 ± 17.3 | 219.1 ± 26.5 | 712.6 ± 42.4 | 535.7 ± 77.1 |
| Inulin clearance (ul/min/gBW) | 8.0 ± 0.7 | 7.3 ± 1.0 | 23.9 ± 1.42 | 18.6 ± 2.5 |
| Plasma Na (mM) | 150 ± 1 | 150 ± 0 | 151 ± 1 | 152 ± 1 |
| Plasma Cl (mM) | 123 ± 1 | 126 ± 1 | 122 ± 2 | 123 ± 1 |
| Plasma K (mM) | 5.1 ± 0.2 | 5.0 ± 0.1 | 5.4 ± 0.3 | 5.2 ± 0.3 |
| Plasma Urea Nitrogen (mM) | 2.1 ± 0.1 | 2.1 ± 0.1 | 8.0 ± 0.2 | 6.4 ± 0.4* |
| Urine Na (mM) | 93 ± 12 | 87 ± 7 | 87 ± 3 | 43 ± 9* |
| Urine K (mM) | 79± 6 | 75± 15 | 66 ± 4 | 24 ± 4* |
| Urine urea (mM) | 123 ± 8 | 131 ± 23 | 1464 ± 178 | 462 ± 27* |
| Na excretion (mmol/day) | 239 ± 38 | 232 ± 32 | 237 ± 20 | 302± 35 |
| K excretion (mmol/day) | 181 ± 26 | 189 ± 36 | 178 ± 13 | 188 ± 40 |
| Urea excretion (mmol/day) | 317 ± 39 | 350 ± 71 | 3908 ± 372 | 3516 ± 485 |
| Na Clearance (ml/day) | 1.23 ± 0.20 | 1.47 ± 0.20 | 1.56 ± 0.13 | 1.97 ± 0.22 |
| K Clearance (ml/day) | 33.6 ± 3.8 | 37.1 ± 6.9 | 30.5 ± 2.0 | 33.9 ± 8.9 |
| Urea Clearance (ml/day) | 117.5 ± 18.3 | 156.6 ± 24.3 | 486.6 ± 46.1 | 556.7 ± 94.1 |
| FE Na (%) | 0.41 ± 0.05 | 0.73 ± 0.16 | 0.25 ± 0.05 | 0.39 ± 0.12 |
| FE K (%) | 11.5 ± 0.9 | 15.9 ± 5.6 | 4.3 ± 0.3 | 6.5 ± 1.7 |
| FE Urea (%) | 39.8 ± 4.6 | 77.1 ± 17.7 | 68.2 ± 5.2 | 102.0 ± 8.8* |
| U/P Na | 0.61 ± 0.07 | 0.58 ± 0.05 | 0.57 ± 0.02 | 0.28 ± 0.06* |
| U/P K | 16.6 ± 0.5 | 15.1 ± 3.5 | 11.2 ± 0.8 | 4.4 ± 0.8* |
| U/P Urea | 57.3 ± 3.6 | 61.7 ± 7.1 | 182.5 ± 23.1 | 72.7 ± 6.1* |
Urinary excretion values
A summary of the excretion of water, monovalent cations and urea in wildtype and UT-A1/3−/− mice on a low (4%) or high (40%) protein diet is shown in table 2. Urine volume was greater in UT-A1/3−/− mice only on the high protein diet, resulting in a marked decrease in the urine/plasma (U/P) inulin ratio and a corresponding reduction in urinary osmolality. However, there were no differences in osmolar excretion in UT-A1/3−/− mice versus wildtype controls.
On a high protein diet, plasma urea concentration was significantly lower in UT-A1/3−/− mice than in wildtype controls (Table 2). Plasma concentrations of Na, K, and Cl were not different between UT-A1/3−/− mice and controls.
Fractional urea excretion (FEurea) was markedly elevated in UT-A1/3−/− versus wildtype controls on both the 4% and 40% protein diets. In fact, FEurea reached 102.4 ± 8.8% of the filtered urea in the UT-A1/3−/− mice on the 40% protein diet, a level that may be indicative of net active urea secretion along the renal tubule (see Discussion). Fractional excretion rates of sodium and potassium were not significantly different in UT-A1/3−/− mice versus wildtype controls.
Urinary concentrating ability of UT-A1/3−/− mice
UT-A1/3−/− mice have a urinary concentrating defect that is dependent on the level of urea excretion [4]. Since the main determinant of urea excretion rate is protein intake, in the present study, the effects of three different dietary protein intakes on urinary concentrating ability were determined. Initial observations were made without restriction of water intake (Figure 6). On a low protein intake (4% protein diet), there were no significant differences in fluid consumption, urine flow or urine osmolality between wildtype and UT-A1/3−/− mice. However, on a normal protein intake (20% protein diet), UT-A1/3−/− mice exhibited significantly greater fluid consumption and urine flow than wildtype mice, resulting in a decreased urine osmolality. This decrease in urinary concentrating ability was even greater on a high protein intake (40% protein diet). Furthermore, after an 18hr water restriction (2ml of water per day per 20gBW), UT-A1/3−/− mice on either a 20% or 40% protein diet (but not a 4% protein diet) were unable to reduce their urine flow and could not raise their maximal urinary osmolality above that observed under basal conditions (data not shown). During this 18hr water restriction, the body weight of UT-A1/3−/− mice on a 20% or 40% protein diet decreased by 18.2 ± 0.4% and 24.6% ± 0.3%, respectively. In contrast, UT-A1/3−/− mice on a 4% protein diet were able to maintain fluid balance without a marked loss of body weight (3.0 ± 0.2%).
Figure 6.

Water conservation and urinary concentrating ability of UT-A1/3−/− mice. For all graphs, values are mean ± SE and a significant difference (ANOVA) between wild-type mice (clear bars) and UT-A1/3−/− mice (solid bars) is indicated. Mice received either a 4%, 20% or 40% protein intake for 7 days before and throughout the duration of the study. Graphs show; A, twenty-four hour water consumption; B, urine output under basal conditions (free access to drinking water); C, urine osmolality under basal conditions.
Expression of sodium transporters and aquaporins
The greater urine flow in UT-A1/3−/− mice can be explained by a urea-dependent osmotic diuresis [4]. We hypothesized that changes in the expression of other channels and transporters may, in part, compensate for the observed polyuria. Therefore, we examined the abundance (semiquantitative immunoblotting) of the major Na transporters and aquaporins in kidneys from wildtype and UT-A1/3−/− mice either under normal conditions, where animals had free-access to water, or after water restriction.
Under basal conditions without water restriction, apart from a significant reduction in the expression of the type 2 Na-dependent phosphate transporter (NaPi-2), no other major differences in Na transporter abundances were observed between the groups (Figure 7). However, after 36 hr of water restriction, the abundances of both the thiazide-sensitive Na-Cl cotransporter (NCC) and all three subunits of ENaC were significantly greater in knockout animals compared to controls (Figure 7). In contrast, the expression of NaPi-2 was further reduced in knockout animals to a level that was virtually undetectable by immunoblotting.
Figure 7.
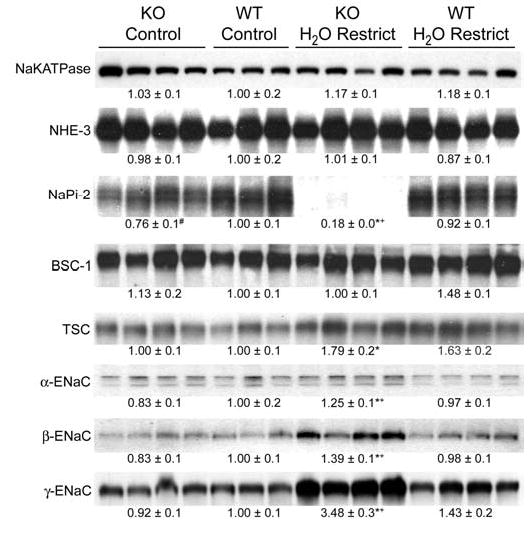
Immunoblots assessing sodium transporter and sodium channel abundances in whole kidney homogenates from wildtype and UT-A1/3−/− mice. Mice received either free access to water (control) or were water restricted for 36hrs. Each lane was loaded with a sample from a different animal. See Methods (“Immunoblotting” subheading) for list of abbreviations. Values are mean band densities ± SE normalized such that the mean for the wildtype mice under control conditions is defined as 1. A significant change in mean band densities within a group under the two experimental conditions is indicated by *. A significant change in mean band densities between the wildtype and UT-A1/3−/− groups under control conditions is indicated by #. A significant change in mean band densities between the wildtype and UT-A1/3−/− groups under water-restricted conditions is indicated by +.
Under basal conditions without water restriction (Figure 8), UT-A1/3−/− mice had greater aquaporin 3 expression levels than wildtype controls. After water restriction, the abundances of both aquaporin 2 and aquaporin 3 increased in both UT-A1/3−/− and wildtype mice, however, the increase in abundances of aquaporins 2 and 3 were greater in knockout mice (Figure 8). Thus, the concentrating defect in UT-A1/3−/− mice cannot be attributed to a defect in long-term regulation of aquaporin 2 or 3.
Figure 8.
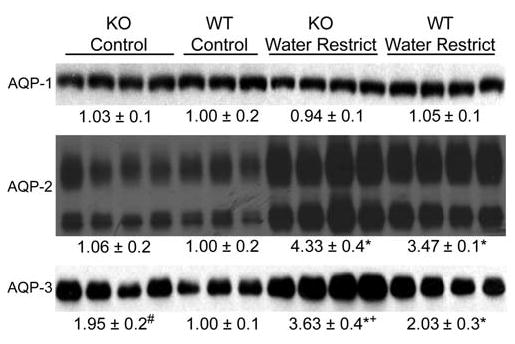
Immunoblots assessing aquaporin water channel abundances in whole kidney homogenates from wildtype and UT-A1/3−/− mice. Mice received either free access to water (control) or were water restricted for 36hrs. Each lane was loaded with a sample from a different animal. Values are mean band densities ± SE normalized such that the mean for the wildtype mice under control conditions is defined as 1. A significant change in mean band densities within a group under the two experimental conditions is indicated by *. A significant change in mean band densities between the wildtype and UT-A1/3−/− groups under control conditions is indicated by #. A significant change in mean band densities between the wildtype and UT-A1/3−/− groups under water-restricted conditions is indicated by +.
Medullary solute gradients
Changes in urea transport in the collecting duct and changes in NO production in the kidney could both have potential effects on corticomedullary solute gradients. Consequently, we carried out analysis of tissue solute composition in dissected cortex, outer medulla, and two levels of inner medulla in UT-A1/3−/− and wildtype mice on 4% and 40% protein diets. In knockout mice on a high protein intake, there was a marked depletion of both osmolality and urea in the inner medulla compared to controls (Figure 10). However, there were no differences between UT-A1/3−/− mice and wildtype control mice in Na concentrations measured in cortex, outer medulla, or inner medulla (Figure 10). In addition, tissue K concentration was not different between UT-A1/3−/− and wildtype mice (not shown). Furthermore, the Na concentration profiles were virtually identical when mice on a 4% diet are compared to mice on a 40% protein diet. Thus, sodium accumulation in both the outer and inner zones of the kidney medulla appears to occur largely independently of tissue urea concentrations.
Figure 10.
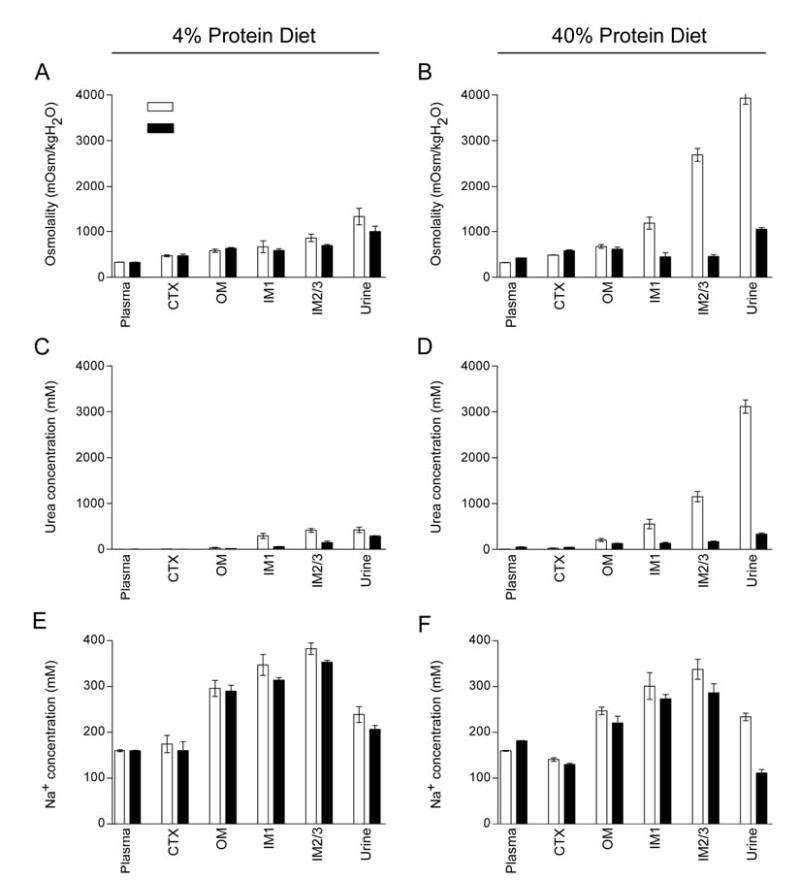
Comparison of kidney solute composition of wild-type and UT-A1/3−/− mice. For all graphs, values are mean ± SE and a significant difference (ANOVA) between wild-type mice (clear bars) and UT-A1/3−/− mice (solid bars) is indicated. Mice received either a 4% or 40% protein intake for 7 days before and throughout the duration of the study. The sections of tissue analyzed for determining values are shown in Figure 7. Graphs show; Osmolality on either a 4% protein intake (A) or 40% protein intake (B); Urea concentration on either a 4% protein intake (C) or 40% protein intake (D); Na concentration on either a 4% protein intake (E) or 40% protein intake (F).
DISCUSSION
In the kidney, the transepithelial movement of urea across the inner medullary-collecting duct (IMCD) is mediated by two members of the UT-A facilitated urea transporter family; UT-A1 and UT-A3. Recently, we developed a mouse model in which both UT-A1 and UT-A3 were deleted from the IMCD (UT-A1/3−/− mice) to investigate the role of these transporters in the function of the renal inner medulla [4]. In this manuscript we address several longstanding hypotheses about the role of urea in renal physiology as discussed in the following:
Role of NO in renal water balance
It is well recognized the renal NO production plays an important role in the regulation of water transport in the renal collecting duct, although it appears to have both inhibitory [17] and stimulatory [18] effects on collecting duct water permeability. Furthermore, NO plays an important role in regulation of thick ascending limb NaCl transport, a process critical to the urinary concentrating mechanism. Hence, it should not seem surprising that changes in NO excretion were found in the UT-A1/3−/− mice in association with the markedly abnormal water conservation capacity of these animals. However, these studies do not directly determine the cause or the consequences of the increased NO excretion in these mice, or of the associated medullary vascular congestion.
The effect of high protein intake on GFR; possible role of urea
It has been known for several years that diets rich in protein increase whole kidney GFR [19, 20]. Studies by Seney and Wright, determined that this increase in GFR results from changes in the tubuloglomerular feedback (TGF) system [21, 22]. Furthermore, they determined that it is not an actual change in the sensing mechanism of the TGF response that is affected by high protein diet, but rather it is an effect on the signal causing the TGF response. They concluded that this diminished TGF response is due, at least in part, to a reduced early distal NaCl concentration, without a change in early distal tubule osmolality [22]. Bankir et al. [23, 24] have proposed that the reduction in early distal NaCl concentration is due to increased concentrations of urea consequent to the high protein intake. The urea concentrations in the late thick ascending limb and early distal tubule are dependent both on the urea concentration of the glomerular filtrate and the extent of urea recycling, a result of passive urea secretion into the loop of Henle from urea reabsorption in the IMCD [25–27]. Since urea recycling is likely to be virtually eliminated in the UT-A1/3−/− mice, it would be predicted that the increase in GFR in response to high protein feeding would be markedly attenuated. However, in our studies, a large protein-dependent increase in GFR was observed in both UT-A1/3−/− and wildtype mice and we observed no significant difference in inulin clearance between the groups under either dietary condition examined. Therefore, these data suggest that urea reabsorption from the IMCD and the process of urea recycling is not an important determinant of the protein-induced increases in GFR observed.
The possibility of active urea secretion along the renal tubule
The excretion of urea, in classical thinking, is thought to depend on two factors: the filtered load of urea and the amount of urea reabsorption that occurs along the nephron. Although secretion of urea into the loop of Henle occurs as part of the urea recycling process discussed in the previous paragraph, this secretion is thought to occur passively. However, several pieces of evidence support the notion that active urea secretion may occur at some point along the renal tubule (reviewed extensively in [28]). Evidence for active urea secretion in rodents was initially provided by Bodil Schmidt-Nielsen [29] and microperfusion studies by Kawamura and Kokko indicated that a low rate of active urea secretion could occur in the rabbit proximal tubule [30], although net urea secretion was not detectable in another study of the rabbit proximal straight tubule [31]. More recently, Kato and Sands have shown that in rats with a low dietary protein intake, urea can be actively secreted in the terminal IMCD [32]. In our studies, the FEurea in UT-A1/3−/− mice on a high protein diet was virtually 100% (Table 2). Conclusive evidence for active urea secretion from clearance studies would require a net fractional urea excretion significantly greater than 100%. Although this benchmark was not achieved, given that at least 30–40% of the filtered load of urea is normally reabsorbed in the proximal tubule [26, 33], the finding of a net fractional excretion of 102.0 ± 8.8 percent (Table 2) strongly suggests the presence of active urea secretion in the mouse renal tubule. To determine where the postulated active urea secretion occurs in the mouse kidney nephron will require micropuncture studies.
Role of medullary urea accumulation in the renal concentrating mechanism
Berliner and his colleagues proposed that medullary urea accumulation serves to prevent urea (present at high levels in the collecting duct lumens) from causing an osmotic diuresis [3]. Our previous study with the UT-A1/3−/− mice demonstrated that in the absence of facilitated urea transport across the IMCD, urea accumulation in the renal inner medulla is markedly attenuated [4]. Consistent with the Berliner model, UT-A1/3−/− mice fed either a normal (20%) or high (40%) protein diet had a significantly greater fluid intake and urine flow than wildtype animals (Figure 6), while UT-A1/3−/− mice on a low protein intake did not show a substantial degree of polyuria. In the latter condition, hepatic urea production is low and urea delivery to the IMCD is predicted to be low, thus rendering the absence or presence of collecting duct urea transport immaterial with regard to water balance. Furthermore, when “challenged” by an 18hr water restriction, UT-A1/3−/− mice on a 20 or 40% protein intake were unable to reduce their urine flow to levels below those observed under basal conditions, resulting in volume depletion and loss of body weight. We can conclude from these findings that the concentrating defect in UT-A1/3−/− mice is due to a urea dependent osmotic diuresis; greater urea delivery to the IMCD results in greater levels of water excretion. Overall, the results are consistent with a role for urea transporters in the maintenance of water balance through their ability to prevent a urea-induced osmotic diuresis.
Potentially, regulation of urea transporters in the IMCD could play a direct role in regulation of water and NaCl excretion by modulating the extent of urea-induced osmotic diuresis. For example, the downregulation of collecting duct urea transporters seen in ECF volume expanded states [34] could be viewed as a homeostatic response that could increase water and salt excretion. Furthermore, some of the effects of glucocorticoids on water balance could be a consequence of the effect of glucocorticoids to downregulate urea transporter expression in the IMCD [35, 36].
The role of urea in the concentration of Na and Cl in the renal medulla
In this study, we carried out an analysis of solute concentrations in cortex, outer medulla and two levels of the inner medulla to assess the separate effects of changes in dietary protein intake and/or deletion of the collecting duct urea transporters on corticomedullary solute gradients. Several striking observations were apparent. First, in wildtype mice, a change in dietary protein intake from 4% to 40% resulted in increased tissue osmolality that was due solely to greater urea accumulation in the inner medulla (Figure 10), the site of expression of the UT-A1 and UT-A3 transporters [37, 38]. Sodium concentrations at all levels of the corticomedullary axis were unaffected by the change in dietary protein intake. Second, in agreement with studies in rats by Schmidt-Nielson et al [39], the concentration of urea in the papillary tip of wildtype mice fed a low protein diet was equivalent to the concentration of urea in the urine, whereas in mice fed a high protein diet, urea concentration in the urine is greater than in the papillary tip, consistent with a failure of urea to completely equilibrate between lumen and interstitium. Third, in contrast to wildtype mice, in knockout mice there was a substantially attenuated corticomedullary osmolality gradient and there was no urea gradient on either diet. However, the corticomedullary sodium gradients were virtually equivalent in wildtype and knockout mice on either level of dietary protein intake. Thus, neither marked medullary urea depletion due to dietary protein restriction, or marked medullary urea depletion due to deletion of collecting duct urea transporters affected the ability of the kidney to form a corticomedullary sodium gradient. Therefore, in contrast to predictions of the passive concentrating hypothesis proposed by Stephenson [5] and by Kokko and Rector [Kokko, 1972 #474, we conclude that NaCl accumulation in the IM is not dependent on either IMCD urea transport or the accumulation of urea in the IMCD interstitium.
Expression of aquaporins and NaCl transporters in UT-A1/3−/− mice
We profiled the changes in renal aquaporin and sodium transporter expression in UT-A1/3−/− mice versus control mice to determine whether compensatory responses could be detected. In general, aquaporin-2 and -3 expression levels were intact in UT-A1/3−/− mice, ruling out a role for dysregulation of these transporters in the demonstrated concentrating defect. Also, in response to restriction of water intake, aquaporin-2 and -3 abundances increased in UT-A1/3−/− mice more than in control mice reflecting a greater degree of water depletion. Furthermore, the levels of sodium transporter expression were not impaired in UT-A1/3−/− mice and appeared to respond appropriately to volume depletion after water restriction. An unexplained finding was that the sodium-phosphate cotransporter NaPi-2 manifested a marked decrease in expression level in the knockout mice versus controls. We have no explanation for this finding, as phosphate intake was identical in the two groups of mice. However, we can speculate that the decreased NaPi-2 expression could in some way be related to the increased renal levels of NO production in the UT-A1/3−/− mice.
Acknowledgments
This study was funded by the Intramural Budget of the National Heart, Lung, and Blood Institute (National Institutes of Health to M.A. Knepper and the Intramural Budget of the National Institute of Diabetes, Digestive and Kidney Diseases to J. Schnermann. Further funding was provided by The Royal Society (UK) and the BBSRC (to C.P. Smith). The authors are grateful for the assistance of Christian A. Combs, manager of the NHLBI Light Microscopy Imaging Facility at the National Institutes of Health and David Caden at Laboratory of Animal Medicine and Surgery, NHLBI, for carrying out analysis of the urine samples.
References
- 1.Atherton JC, Hai MA, Thomas S. Effects of water diuresis and osmotic (mannitol) diuresis on urinary solute excretion by the conscious rat. J Physiol. 1968;197(2):p. 395–410. doi: 10.1113/jphysiol.1968.sp008566. [DOI] [PMC free article] [PubMed] [Google Scholar]
- 2.Appelboom JW, Brodsky WA, Scott WN. Effect of Osmotic Diuresis on Intrarenal Solutes in Diabetes Insipidus and Hydropenia. Am J Physiol. 1965;208:p. 38–45. doi: 10.1152/ajplegacy.1965.208.1.38. [DOI] [PubMed] [Google Scholar]
- 3.Berliner RW, Levinsky NG, Davidson DG, Eden M. Dilution and concentration of the urine and the action of antidiuretic hormone. Am J Med. 1958;24:p. 730–744. doi: 10.1016/0002-9343(58)90377-2. [DOI] [PubMed] [Google Scholar]
- 4.Fenton RA, Chou CL, Stewart GS, Smith CP, Knepper MA. Urinary concentrating defect in mice with selective deletion of phloretin-sensitive urea transporters in the renal collecting duct. Proc Natl Acad Sci U S A. 2004;101(19):p. 7469–74. doi: 10.1073/pnas.0401704101. [DOI] [PMC free article] [PubMed] [Google Scholar]
- 5.Stephenson JL. Concentration of urine in a central core model of the renal counterflow system. Kidney International. 1972;2:p. 85–94. doi: 10.1038/ki.1972.75. [DOI] [PubMed] [Google Scholar]
- 6.Kokko JP, Rector FC. Countercurrent multiplication system without active transport in inner medulla. Kidney International. 1972;2:p. 214–223. doi: 10.1038/ki.1972.97. [DOI] [PubMed] [Google Scholar]
- 7.Sands JM. Renal urea transporters. Curr Opin Nephrol Hypertens. 2004;13(5):p. 525–32. doi: 10.1097/00041552-200409000-00008. [DOI] [PubMed] [Google Scholar]
- 8.Schmidt-Nielsen B, Graves B, Roth J. Water removal and solute additions determining increases in renal medullary osmolality. Am J Physiol. 1983;244(5):p. F472–82. doi: 10.1152/ajprenal.1983.244.5.F472. [DOI] [PubMed] [Google Scholar]
- 9.Qi Z, Whitt I, Mehta A, Jin J, Zhao M, Harris RC, Fogo AB, Breyer MD. Serial determination of glomerular filtration rate in conscious mice using FITC-inulin clearance. Am J Physiol Renal Physiol. 2004;286(3):p. F590–6. doi: 10.1152/ajprenal.00324.2003. [DOI] [PubMed] [Google Scholar]
- 10.Terris J, Ecelbarger CA, Nielsen S, Knepper MA. Long-term regulation of four renal aquaporins in rats. Am J Physiol. 1996;271(2 Pt 2):p. F414–22. doi: 10.1152/ajprenal.1996.271.2.F414. [DOI] [PubMed] [Google Scholar]
- 11.DiGiovanni SR, Nielsen S, Christensen EI, Knepper MA. Regulation of collecting duct water channel expression by vasopressin in Brattleboro rat. Proc Natl Acad Sci U S A. 1994;91(19):p. 8984–8. doi: 10.1073/pnas.91.19.8984. [DOI] [PMC free article] [PubMed] [Google Scholar]
- 12.Ecelbarger CA, Terris J, Frindt G, Echevarria M, Marples D, Nielsen S, Knepper MA. Aquaporin-3 water channel localization and regulation in rat kidney. Am J Physiol. 1995;269(5 Pt2):p. F663–72. doi: 10.1152/ajprenal.1995.269.5.F663. [DOI] [PubMed] [Google Scholar]
- 13.Masilamani S, Kim GH, Mitchell C, Wade JB, Knepper MA. Aldosterone-mediated regulation of ENaC alpha, beta, and gamma subunit proteins in rat kidney. J Clin Invest. 1999;104(7):p. R19–23. doi: 10.1172/JCI7840. [DOI] [PMC free article] [PubMed] [Google Scholar]
- 14.Kim GH, Ecelbarger CA, Mitchell C, Packer RK, Wade JB, Knepper MA. Vasopressin increases Na-K-2Cl cotransporter expression in thick ascending limb of Henle's loop. Am J Physiol. 1999;276(1 Pt 2):p. F96–F103. doi: 10.1152/ajprenal.1999.276.1.F96. [DOI] [PubMed] [Google Scholar]
- 15.Kim GH, Ecelbarger C, Knepper MA, Packer RK. Regulation of thick ascending limb ion transporter abundance in response to altered acid/base intake. J Am Soc Nephrol. 1999;10(5):p. 935–42. doi: 10.1681/ASN.V105935. [DOI] [PubMed] [Google Scholar]
- 16.Kim GH, Masilamani S, Turner R, Mitchell C, Wade JB, Knepper MA. The thiazide-sensitive Na-Cl cotransporter is an aldosterone-induced protein. Proc Natl Acad Sci U S A. 1998;95(24):p. 14552–7. doi: 10.1073/pnas.95.24.14552. [DOI] [PMC free article] [PubMed] [Google Scholar]
- 17.Garcia NH, Pomposiello SI, Garvin JL. Nitric oxide inhibits ADH-stimulated osmotic water permeability in cortical collecting ducts. Am J Physiol. 1996;270(1 Pt 2):p. F206–10. doi: 10.1152/ajprenal.1996.270.1.F206. [DOI] [PubMed] [Google Scholar]
- 18.Bouley R, Breton S, Sun T, McLaughlin M, Nsumu NN, Lin HY, Ausiello DA, Brown D. Nitric oxide and atrial natriuretic factor stimulate cGMP-dependent membrane insertion of aquaporin 2 in renal epithelial cells. J Clin Invest. 2000;106(9):p. 1115–26. doi: 10.1172/JCI9594. [DOI] [PMC free article] [PubMed] [Google Scholar]
- 19.Mackay EM, Mackay LL, Addis T. Factors which determine renal weight. V. The protein intake. Am J Physiol. 1928;86:p. 459–465. [Google Scholar]
- 20.Dicker SE. Effect of the protein content of the diet on the glomerular filtration rate of young and adult rats. J Physiol. 1949;108:p. 197–202. doi: 10.1113/jphysiol.1949.sp004323. [DOI] [PMC free article] [PubMed] [Google Scholar]
- 21.Seney FD, Jr, Wright FS. Dietary protein suppresses feedback control of glomerular filtration in rats. J Clin Invest. 1985;75(2):p. 558–68. doi: 10.1172/JCI111732. [DOI] [PMC free article] [PubMed] [Google Scholar]
- 22.Seney FD, Jr, Persson EG, Wright FS. Modification of tubuloglomerular feedback signal by dietary protein. Am J Physiol. 1987;252(1 Pt 2):p. F83–90. doi: 10.1152/ajprenal.1987.252.1.F83. [DOI] [PubMed] [Google Scholar]
- 23.Bankir L, Bouby N, Trinh-Trang-Tan MM. Possible involvement of vasopressin and urine concentrating process in the progression of chronic renal failure. Kidney Int Suppl. 1989;27:p. S32–7. [PubMed] [Google Scholar]
- 24.Bankir L, Ahloulay M, Bouby N, Trinh-Trang-Tan MM, Machet F, Lacour B, Jungers P. Is the process of urinary urea concentration responsible for a high glomerular filtration rate? J Am Soc Nephrol. 1993;4(5):p. 1091–103. doi: 10.1681/ASN.V451091. [DOI] [PubMed] [Google Scholar]
- 25.Klumper JD, Ullrich KJ, Hilger HH. [Content of urea in collecting tubules of mammalian kidney.] Pflugers Arch. 1958;267(3):p. 238–43. doi: 10.1007/BF00362427. [DOI] [PubMed] [Google Scholar]
- 26.Lassiter WE, Gottschalk CW, Mylle M. Micropuncture study of net transtubular movement of water and urea in nondiuretic mammalian kidney. Am J Physiol. 1961;200:p. 1139–47. doi: 10.1152/ajplegacy.1961.200.6.1139. [DOI] [PubMed] [Google Scholar]
- 27.Lassiter WE, Mylle M, Gottschalk CW. Micropuncture study of urea transport in rat renal medulla. Am J Physiol. 1966;210(5):p. 965–70. doi: 10.1152/ajplegacy.1966.210.5.965. [DOI] [PubMed] [Google Scholar]
- 28.Bankir, L. and M.M. Trinh-Trang-Tan, Urea and the kidney. The Kidney, 6th Ed. edited by Brenner BM, Philadelphia, W.B. Saunders, 2000.
- 29.Schmidt-Nielsen B. Urea excretion in white rats and kangaroo rats as influenced by excitement and by diet. Am J Physiol. 1955;181(1):p. 131–9. doi: 10.1152/ajplegacy.1955.181.1.131. [DOI] [PubMed] [Google Scholar]
- 30.Kawamura S, Kokko JP. Urea secretion by the straight segment of the proximal tubule. J Clin Invest. 1976;58(3):p. 604–12. doi: 10.1172/JCI108507. [DOI] [PMC free article] [PubMed] [Google Scholar]
- 31.Knepper MA. Urea transport in nephron segments from medullary rays of rabbits. Am J Physiol. 1983;244(6):p. F622–7. doi: 10.1152/ajprenal.1983.244.6.F622. [DOI] [PubMed] [Google Scholar]
- 32.Kato A, Sands JM. Evidence for sodium-dependent active urea secretion in the deepest subsegment of the rat inner medullary collecting duct. J Clin Invest. 1998;101(2):p. 423–8. doi: 10.1172/JCI1420. [DOI] [PMC free article] [PubMed] [Google Scholar]
- 33.Clapp JR. Urea reabsorption by the proximal tubule of the dog. Proc Soc Exp Biol Med. 1965;120(2):p. 521–3. doi: 10.3181/00379727-120-30578. [DOI] [PubMed] [Google Scholar]
- 34.Wang XY, Beutler K, Nielsen J, Nielsen S, Knepper MA, Masilamani S. Decreased abundance of collecting duct urea transporters UT-A1 and UT-A3 with ECF volume expansion. Am J Physiol Renal Physiol. 2002;282(4):p. F577–84. doi: 10.1152/ajprenal.00250.2001. [DOI] [PubMed] [Google Scholar]
- 35.Gertner RA, Klein JD, Bailey JL, Kim DU, Luo XH, Bagnasco SM, Sands JM. Aldosterone decreases UT-A1 urea transporter expression via the mineralocorticoid receptor. J Am Soc Nephrol. 2004;15(3):p. 558–65. doi: 10.1097/01.asn.0000113244.37857.ac. [DOI] [PubMed] [Google Scholar]
- 36.Naruse M, Klein JD, Ashkar ZM, Jacobs JD, Sands JM. Glucocorticoids downregulate the vasopressin-regulated urea transporter in rat terminal inner medullary collecting ducts. J Am Soc Nephrol. 1997;8(4):p. 517–23. doi: 10.1681/ASN.V84517. [DOI] [PubMed] [Google Scholar]
- 37.Stewart GS, Fenton RA, Wang W, Kwon TH, White SJ, Collins VM, Cooper G, Nielsen S, Smith CP. The basolateral expression of mUT-A3 in the mouse kidney. Am J Physiol Renal Physiol. 2004;286(5):p. F979–87. doi: 10.1152/ajprenal.00334.2003. [DOI] [PubMed] [Google Scholar]
- 38.Fenton RA, Stewart GS, Carpenter B, Howorth A, Potter EA, Cooper GJ, Smith CP. Characterization of mouse urea transporters UT-A1 and UT-A2. Am J Physiol Renal Physiol. 2002;283(4):p. F817–25. doi: 10.1152/ajprenal.00263.2001. [DOI] [PubMed] [Google Scholar]
- 39.Truniger B, Schmidt-Nielsen B. Intrarenal Distribution of Urea and Related Compounds: Effects of Nitrogen Intake. Am J Physiol. 1964;207:p. 971–8. doi: 10.1152/ajplegacy.1964.207.5.971. [DOI] [PubMed] [Google Scholar]


