

Abstract
The urea transporters, UT-A1 and UT-A3, two members of the UT-A gene family, are localized to the terminal portion of the inner medullary collecting duct (IMCD). In this manuscript, we demonstrate that 4.2-kb of the 5′-flanking region of the UT-A gene (UT-Aα promoter) is sufficient to drive the IMCD-specific expression of a heterologous reporter gene, β-galactosidase (β-Gal), in transgenic mice. RT-PCR, immunoblotting and immunohistochemistry demonstrate that within the kidney, transgene expression is confined to the terminal portion of the IMCD. Co-localization studies with aquaporin 2 show that expression is localized to the principal cells of the IMCD2 and IMCD3 regions. Utilizing β-Gal activity assays, we further show that within the kidney, the β-Gal transgene can be regulated by both water restriction and glucocorticoids, similar to the regulation of the endogenous UT-A gene. These results demonstrate that 4.2-kb of the UT-Aα promoter is sufficient to drive expression of a heterologous reporter gene in a tissue-specific and cell-specific fashion in transgenic mice
Index words: Transgenic, Kidney, Beta-Galactosidase
INTRODUCTION
The study of gene function in vivo has been enhanced by the use of genetically modified animals. Numerous mouse models of renal function have been developed that use “classical” gene targeting techniques to disrupt a particular gene in the germline of an animal, and the subsequent study of the “knockout” model can be used to assess the renal phenotype of the ablated gene (9, 18–21, 36, 37). However, gene deletion throughout the body often results in difficulties assessing the role of a gene in renal function, or a particular nephron segment or cell type. In its most extreme scenario, deletion of a gene results in mortality of the mice, rendering the model unsuitable for characterization (2, 14, 38). In these cases, there is a need to conditionally regulate gene targeting.
As a first step to achieving cell-specific transgene expression, it has been necessary to experimentally determine whether a given promoter region can target expression in a cell- or tissue-specific manner. This has been achieved by the generation of transgenic animals, where a promoter region of interest is linked to a reporter gene, such as β-galactosidase (β-Gal), Green Fluorescent Protein (GFP), or firefly luciferase, and the localization and expression of the reporter gene is examined. Using this approach, several promoters have been identified that are capable of targeting genes to particular nephron segments. For example, the visceral epithelial cells of the glomerulus can be targeted with the promoter for the nephrin gene (Nphs1) (23, 35); proximal tubule cells can be targeted with the type II promoter for λ-glutamyl transpeptidase (29) or the androgen-regulated protein (KAP) (5, 6), whereas proximal tubule cells of the outer medulla can be targeted with the human plasminogen activator inhibitor type I (PAI-1) gene promoter (7); the epithelial cells of the thick ascending limb of the loop of Henle and early distal convoluted tubule can be targeted with the promoter regions of either Tamm-Horsfall protein (13, 34, 40), or the dopamine- and adenosine 3′,5′-cyclic monophosphate (cAMP)-regulated inhibitor of protein phosphatase-1 (DARPP-32) (4); both the human CLC-KB promoter (17) and the B1 subunit of vacuolar H(+)-ATPase (V-ATPase) promoter (22) can localize transgene expression to, amongst other regions, the connecting tubule; and the principal cells of the collecting duct can be targeted with the aquaporin-2 promoter (27, 39).
In the series of experiments detailed in this manuscript we have generated a transgenic line where the expression of a reporter gene, β-gal, is under the control of the mouse UT-A urea transporter promoter, UT-Aα (10). This promoter region, situated at the 5′-end of the gene, is believed to drive the expression of the inner medulla collecting duct (IMCD) specific UT-A isoforms, UT-A1 and UT-A3. Characterization of this line, termed UT-Aα-βGal, shows for the first time that this promoter region is sufficient to drive reporter gene expression in only the principal cells of the IMCD, thus making the promoter a useful tool for achieving cell-specific gene expression or ablation in this segment of the nephron.
METHODS
Construction of targeting vector and generation of transgenic mice
Using standard PCR methodologies and mouse genomic DNA, a 4.2kb fragment of the 5′ flanking region and part of the first non-coding exon of the mouse UT-A gene, were amplified. This PCR fragment was directionally cloned into the SbfI / XhoI sites of the pWHERE plasmid (Invivogen), upstream of the insulated β-Gal reporter gene (Figure 1). The entire targeting vector was sequenced for confirmation (Lark technologies). The plasmid was linearized, E.coli DNA removed by restriction digest with PacI and separated by gel electrophoresis. The DNA was gel extracted (Qiagen), phenol/chloroform extracted, ethanol precipitated and purified with an Elutip-D column (Schleicher & Schuell). The NHLBI Transgenic Core facility generated transgenic founder mice by standard methods. Briefly, the purified transgene was used for microinjection into the male pronucleus of blastocysts derived from C57BL/6 mice and transferred to pseudopregnant females. Transgene incorporation was confirmed in the resultant offspring by Southern blot analysis after an NcoI / NheI restriction enzyme digest of 10μg of genomic DNA. Blots were probed with a 2.5kb β-Gal probe. Transgenic mice showed a 3.1kb fragment resulting from the NcoI / NheI digestion within the transgene. Subsequent to the proven intergration of the transgene by Southern blot analysis, further genotyping of offspring was performed using PCR and the sense primer 5′- CACACTCTGCTCCTCACATATCACTTG (spanning the 3′end of the UT-A promoter, UT-A-F1) and the antisense primer 5′-GCTCTGAGGAAGGCAGAGAGGTCA (reporter gene specific, β-Gal-R1). Transgenic positive animals were subsequently bred with C57BL/6 mice and generations F1–F3 analyzed.
Figure 1.
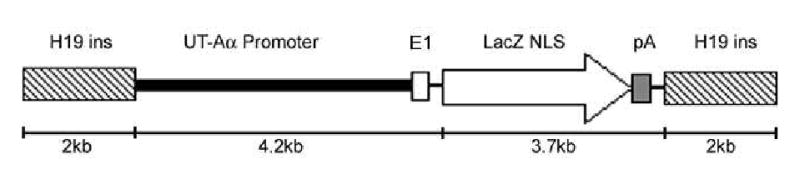
Schematic representation of the construct used for the generation of transgenic mice. E1 is the first non-coding exon of the UT-A gene; LacZ NLS is the β-Gal coding region with a nuclear localization signal; pA is the polyadenylation signal.
Determination of copy number
Real-time PCR was performed on an ABI Prism 7900HT system, using 50ng of genomic DNA, 20 pmoles (each) of gene specific primers UT-A-F1 and β-Gal-R1 and the Quantitect SYBR green PCR kit (Qiagen) according to the manufacturer’s protocol. Specificity of the amplified product was determined using melting curve analysis software, gel electrophoresis and sequencing. The copy number of founder transgenic mice was determined using a serial dilution of mouse genomic DNA containing 0–100000 copies per cell equivalent of transgene DNA (original purified transgene). A standard curve of threshold cycle (Ct) versus copy number was generated and unknowns determined. Equal loading and integrity of genomic DNA was determined using actin specific primers (Forward, 5′-GTGCTGTCTGGCGGCACCACCAT and reverse, 5′-CCTGTAACAACGCATCTCATAT).
RT-PCR analysis of transgene expression
Total RNA was extracted from transgenic or non-transgenic control male mice using the Ribopure kit (Ambion) according to the manufacturer’s guidelines. Potential contaminating DNA was removed from the RNA preparations by 30-min incubation with DNase I (Ambion). Total RNA (1μg) was reverse transcribed using oligo-dT and Superscript II reverse transcriptase (Invitrogen) following the manufacturer’s recommended protocol. RT negative controls were performed to assess the presence of possible genomic contamination of RNA samples. PCR amplification was performed using 0.2 μl of cDNA, 10 pmol of gene specific primers and HotStarTaq (Qiagen). The primers used were 1) β-Gal specific, designed to amplify a 541-bp product (Forward, 5′-GTTGTGCTGCAAAGGAGAGACTGGGAG and reverse, 5′-GCTCTGAGGAAGGCAGAGAGGTCA), 2) Actin specific (see above). After an initial denaturation step at 95°C for 15 min, PCR cycling conditions were 35 cycles of denaturation at 94°C for 30 s, annealing at 62°C for 30 s, extension at 72°C for 60 s, and a final extension at 72°C for 8 min. All PCR products were sequenced for verification.
β-Galactosidase activity assays
Tissues from male transgenic or non-transgenic mice were homogenized in 0.5ml of 100mM potassium phosphate (pH7.8), 0.2% Triton X-100 in the presence of the protease inhibitors leupeptin (5μg/ml) and AEBSF (0.2mM). The samples were centrifuged at 4,000g for 2mins to pellet cell debris. Total protein concentrations were determined in the supernatant (BCA kit; Pierce Chemical Co.). β-Gal activity was measured in triplicate 10μl samples using the Galacto-Light Plus chemiluminescence reporter gene assay system (Applied Biosystems) according to the manufacturer’s protocol and a Victor-3 1420 Multi-label Counter (Wallac).
β-Galactosidase staining
Male transgenic mice were anesthetized with isoflurane and perfused via the heart with cold phosphate buffered saline (PBS, pH 7.4) for 2 min. Multiple tissues were harvested and cut into small (<1cm2) sections. The kidney was dissected into inner medulla, outer medulla and cortex. Tissues were immersion fixed in cold 4% paraformaldehyde on ice for 30mins then subsequently washed in PBS several times. Samples were stained in the dark overnight at 37°C in a solution containing; 50mM Tris HCL (pH 7.5), 15mM NaCl, 1mM MgCl2, 5 mM potassium ferricyanide, 5 mM potassium ferrocyanide and 0.5 mg/mL X-gal. Samples were washed multiple times with PBS and kidney images were captured using a Leica MZ FL III Fluorescence Stereomicroscope. For the vas deferens, the sections were embedded in paraffin; 10μm longitudinal sections were cut, mounted on glass slides, dewaxed with xylene, counterstained with Nuclear Fast Red (Sigma) and viewed with a Nikon E800 Upright microscope.
Immunoblotting
Mice were euthanized by decapitation and the kidney dissected into inner medulla, outer medulla and cortex. Protein preparation and immunoblotting was performed as previously described using an anti-β-Gal purified antibody (Promega), diluted 1:1000.
Immunocytochemistry
Kidneys were fixed by perfusion via the heart with cold PBS for 60 seconds, followed by 4% paraformaldehyde in PBS (pH 7.4) for 3 min. The kidneys were removed and the mid-region was sectioned into 5mm transverse sections and post-fixed for 1 hour in cold 4% paraformaldehyde / PBS, followed by 3x10min washes with PBS. The tissue was dehydrated in a series of ethanol concentrations and left overnight in xylene. The tissue was embedded in paraffin and 5 μm sections were cut (Histopath) and mounted on Superfrost Plus slides (VWR International). Staining was performed as described previously (16) using the following primary antibodies; mouse anti-β-Gal (Promega, diluted 1:1000) or chicken anti-aquaporin-2 (diluted 1:1000) and the following secondary antibodies; goat anti-mouse IgG, Alexa Fluor 680; and goat anti-chicken IgG Alexa Fluor 488 (Molecular Probes). After 1-h incubation at room temperature, coverslips were mounted with Vectashield mounting medium containing DAPI (Vector labs). Microscopy was performed with a Nikon E800 Upright microscope.
Effect of water restriction on UT-A promoter activity in vivo
All animal studies in this paper were done under NIH ACUC approved animal protocols. Male transgenic mice were used for all studies. Animals were maintained in mouse metabolic cages (Hatteras Instruments) for the duration of the study, under controlled temperature and light conditions (12 hour light and dark cycles). Mice received a fixed daily ration of gelled diet per day containing both food and water. The gelled diet was made up of 4g of special low NaCl synthetic food (0.001% Na w/w, Research Diets), 0.2 mmole NaCl, 25mg agar and either 1.7ml (water restricted) or 5ml (control) of deionized water. Five mice were used for each group. Mice did not have access to supplemental drinking water during this period. After three days of adaptation to the cages, urine was collected under mineral oil in pre-weighed collection vials for a 24hr period. Urine volume was measured gravimetrically assuming a density of one. Urine osmolality was determined using a vapor pressure osmometer (Wescor). Kidney inner medullas were dissected, one inner medulla was processed for real-time RT-PCR and the other for β-Gal activity.
Real-time RT-PCR
Total RNA was extracted using the Ribopure kit (Ambion) according to the manufacturer’s guidelines. Real-time RT-PCR was performed as detailed in (8) using UT-A1 or UT-A3 isoform selective primers (24).
Effect of glucocorticoids on UT-A promoter activity in vivo
Male transgenic mice were anesthetized with isoflurane for the subcutaneous implantation of osmotic minipumps (Model 2001, Alzet) containing either dexamethasone (Sigma) in 20% DMSO / isotonic saline (5 mice) or control minipumps containing 20% DMSO / isotonic saline (5 mice). Dexamethasone was delivered at 2μg per gram bodyweight per day. For six days, mice received a fixed daily ration of gelled diet containing 1.7ml of deionized water (see above), but also had free access to supplemental drinking water. Kidney inner medullas were dissected out and processed as described in the section entitled: β-Galactosidase assay. In an identical experiment, the kidney inner medullas were dissected, and processed for real-time RT-PCR, as above.
Statistical Analysis
All values are quoted as means ± SEM. Analysis was performed by t-tests or one-way ANOVA as appropriate, with significance assumed at the 5% level. If ANOVA indicated a significant difference, comparison between groups was performed with the Student-Newman-Keuls method.
RESULTS
Creation of transgenic mice
A 4.2kb region upstream of the first coding exon of the UT-A gene, but containing the transcriptional start site of UT-A1 and UT-A3, was used to generate the UT-Aα-βGal transgene. A similar size region has been characterized previously and was shown to be sufficient for promoter activity in MDCK cells (10). The UT-Aα-βGal transgene was used to create transgenic mice by pronuclear microinjection using standard methodologies. Initially, 51 pups were analyzed for transgene expression by Southern analysis using a β-Gal specific probe (not shown). Five founder animals were identified and UT-Aα-βGal expression was confirmed by PCR analysis using transgene specific primers. Real-time PCR and specific primers were used to estimate the transgene copy number in the founder animals, by comparing the threshold cycle (Ct) of the founder DNA to a standard curve generated from non transgenic mouse DNA spiked with 0–100,000 copies per cell equivalent of the transgene (Figure 2). Founders 2470, 2471 and 2472 had approximately 2, 6 and 10 copies per cell equivalent, respectively, of the transgene, founder 2473 had ~110 copies and line 2474 had ~50 copies. Founder animals were crossed with C57BL6/J mice and the offspring analyzed. Both male and female offspring were analyzed for transgene expression from each of the 5 founder animals, but ultimately only two of the lines, 2473 and 2474, were found to functionally express the transgene. These animals transmitted the transgene to greater than 50% of their offspring and were used to propagate the transgenic line of mice for further experiments. All data shown are from the line 2473.
Figure 2.
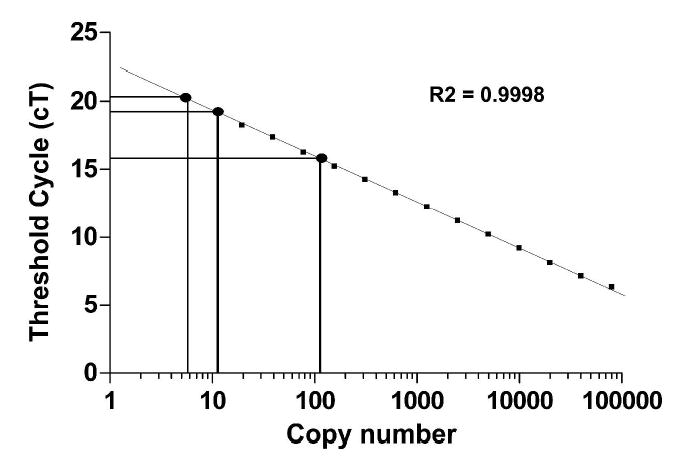
Transgene copy number in founder animals. By real-time RT-PCR, the threshold cycle (Ct) of the founder DNA (examples plotted as filled circles) was compared to a standard curve generated from non-transgenic mouse DNA spiked with 0–100,000 copies per cell equivalent of the transgene (squares). A strong correlation between Ct and copy number is indicated by an R2 value of 0.9998.
RT-PCR analysis of transgene expression
Multiple tissues were analyzed for transgene expression using primers specific for the β-Gal transcript (Figure 3). β-Gal was only expressed in the kidney inner medulla (IM) of the tissues analyzed (Figure 3a) and transgene expression was not evident in non-transgenic control mice (Figure 3b). An identical reaction performed in the absence of reverse transcriptase confirmed that the IM specific product did not result from genomic DNA contamination. Analysis of actin served as a positive control for the RT-PCR reaction.
Figure 3.
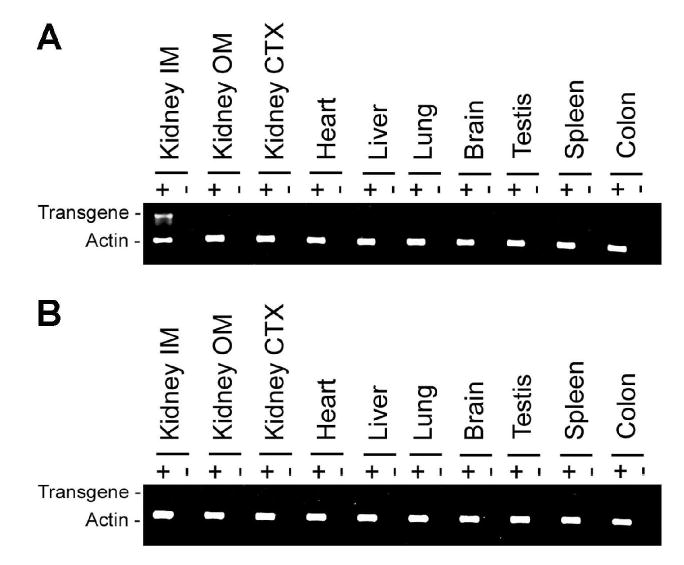
RT-PCR analysis of transgene expression. β-Gal was only expressed in the kidney inner medulla of the tissues analyzed (A) and transgene expression was not evident in non-transgenic control mice (B). In the absence of reverse transcriptase, no products were observed. Analysis of actin served as a positive control for the RT-PCR reaction. IM, inner medulla; OM, outer medulla; CTX, cortex.
Localization of β-Galactosidase
Of the tissues analyzed, X-Gal staining was only apparent in the kidney and vas deferens, whereas no staining was observed in testis, heart, lung, liver and brain. In the kidney, X-Gal staining was localized to the papillary tip and was strongest in the terminal portion of this region (Figure 4). To further characterize the localization of UT-Aα-βGal in the kidney, immunohistochemistry was performed using an antibody against E. coli β-gal. Initially, the specificity of the antibody was determined by western blotting of different kidney regions. A single 114kDa band representing E. coli β-gal was only detected in the kidney IM of transgenic positive animals and was not observed in any other kidney region or in non-transgenic control mice (Figure 5). Staining of kidney sections using the same antibody localized β-Gal immunoreactivity to the IMCD cells, whereas no staining was observed in the thin descending limb of the loop of henle (tDL) (Representative images shown in Figure 6a and b). The staining of the IMCD was strongest in the terminal portion of the papillary tip, IMCD2 and IMCD3, and little staining was apparent in the base region, IMCD1 (Figure 6c). Co-localization studies using an aquaporin 2 (AQP2) specific antibody showed that β-Gal staining was localized to AQP2 expressing cells in the IMCD (Figure 6d–f). Of the sections analyzed, from 4 different animals, there were zero β-Gal positive cells that did not contain AQP2, and virtually all AQP2 containing cells in the IMCD were also positive for β-Gal; suggesting that β-Gal expression is almost complete and localized to the IMCD principal cells.
Figure 4.
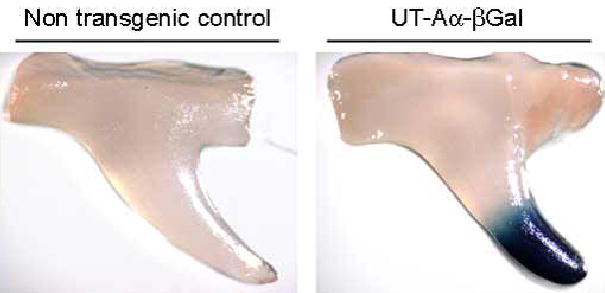
Localization of β-Gal enzyme activity in the kidney. X-Gal staining of the kidney inner medulla demonstrated that β-Gal activity was localized to the papillary tip and was strongest in the terminal portion of this region. No staining was observed in kidneys from non-transgenic control mice.
Figure 5.
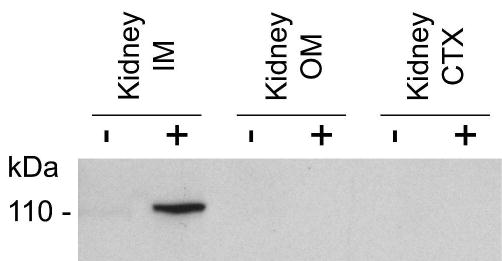
Immunoblot of different kidney regions using an anti β-Gal antibody. A single 114kDa band representing E. coli β-gal was only detected in the kidney IM of transgenic positive animals (+) and was not observed in any other kidney region or in non-transgenic control mice (−).
Figure 6.
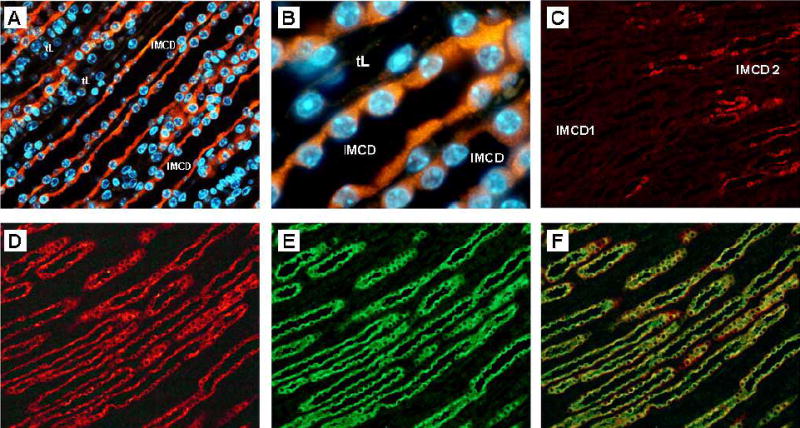
Localization of transgene in kidney inner medulla by immunohistochemistry. A; Low power magnification shows expression of β-Gal transgene (red) is confined to the cells of the IMCD and is not apparent in the thin descending limbs of Henle’s loop (tL). Nuclei are stained blue. B; High power magnification demonstrates that β-Gal staining (red) is apparent in the cytoplasm of the IMCD principal cells. C; Staining is localized to the IMCD2 and IMCD 3 regions, with little staining of the base of the inner medulla, IMCD1. Colocalization studies with an anti-aquaporin 2 antibody demonstrate that β-Gal staining (D, red) and aquaporin 2 staining (E, green) are colocalized in IMCD principal celIs, F.
In the vas deferens, staining was observed in cells surrounding the tubule lumen (Figure 7a). At higher magnification, staining was clearly localized to the columnar epithelial principal cells; the cells that form the apical membrane of the vas deferens tubule (Figure 7b).
Figure 7.
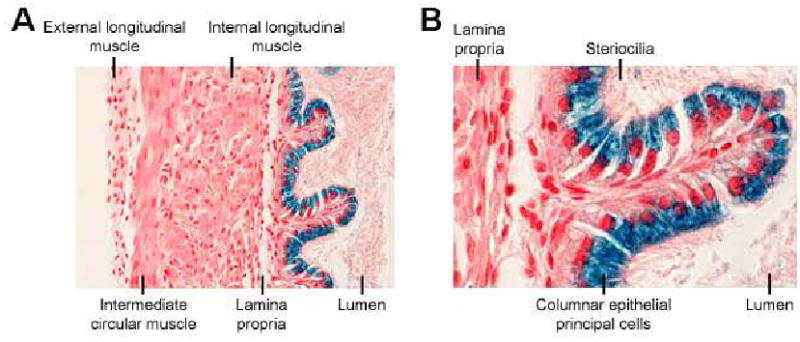
Localization of β-Gal enzyme activity in the vas deferens. X-Gal staining of the vas deferens demonstrated that β-Gal activity (blue staining) was observed in cells surrounding the tubule lumen (A). At higher magnification, staining was clearly localized to the columnar epithelial principal cells (B).
β-Galactosidase activity
To further characterize transgene expression and as a means of examining the regulation of the UT-Aα-βGal transgene, β-Gal enzyme activity was assayed in various tissues. A representative experiment is shown in Figure 8. In UT-Aα-βGal mice, only kidney IM (approximately 20-fold) and vas deferens (approximately 15-fold) showed enzyme activity that was greater than non-transgenic control mice.
Figure 8.
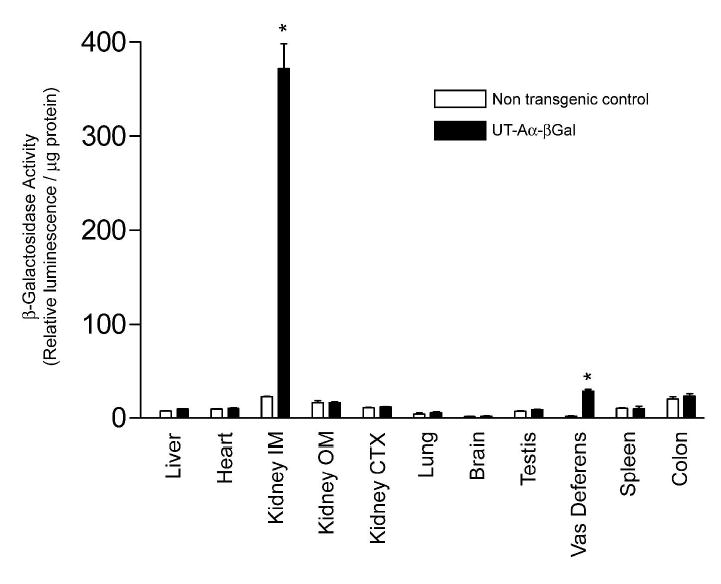
Graph shows β-Gal enzyme activity (expressed as relative light units per μg protein) in multiple different tissues. In UT-Aα-βGal mice (solid bars), only kidney IM and vas deferens showed enzyme activity that was significantly greater (*) than non-transgenic control mice (open bars). n = 4 for each group.
Effect of water restriction on UT-Aα promoter activity in vivo
UT-Aα- β-Gal mice were kept in metabolic cages and received either a water-restricted (1.7mls water a day) or a control (5mls water a day) diet. After 3 days, urine osmolality was significantly greater in the water-restricted group (3317±80mosm/kg H2O) compared to the control group (1061±22 mosm/kg H2O). Kidney IM’s were dissected and β-Gal activity was measured in one inner medulla, whilst the second IM was processed for real-time RT-PCR. β-Gal activity was significantly greater in the water-restricted animals, 428 ± 62 Relative Luminescence Units / μg protein (RLU/μg), compared to the control animals, 241 ± 59 RLU/μg, suggesting that the UT-Aα-βGal transgene could be regulated by osmolality or vasopressin (Figure 9). Real-time RT-PCR using isoform specific primers showed that the normalized mRNA levels of the UT-A3 isoform were significantly increased under water-restricted conditions (2.1 ± 0.22) compared to control conditions (1.0 ± 0.14), whereas the normalized mRNA levels of the UT-A1 isoform were not changed by water-restriction (Figure 10).
Figure 9.
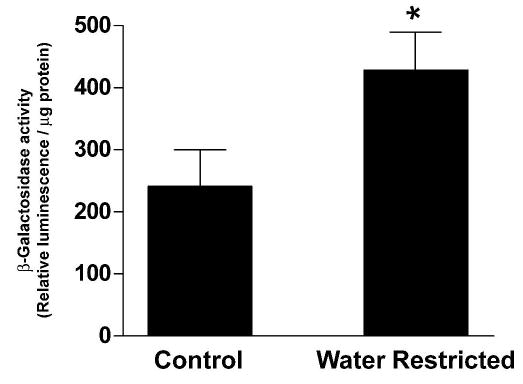
Effect of water restriction on UT-Aα promoter activity in vivo. UT-Aα-βGal mice were water restricted for 3 days, the inner medullas isolated and β-Gal enzyme activity measured. Water restriction resulted in a significant (*) increase in β-Gal activity, (n = 5 for each group).
Figure 10.
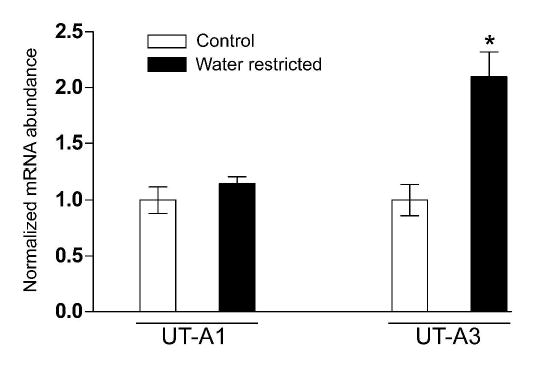
Real-time RT-PCR of kidney inner medulla RNA using isoform specific primers show that the normalized mRNA levels of the UT-A3 isoform are significantly increased (*) under water-restricted conditions (solid bars), whereas the normalized mRNA levels of the UT-A1 isoform are not changed (n = 5 for each group).
Effect of glucocorticoids on UT-A promoter activity in vivo
Glucocorticoids increase fractional urea excretion and decrease urea permeability and UT-A1 protein abundance in the IMCD (26). Further studies have shown that dexamethasone administration significantly decreases the activity of the rat UT-Aα promoter in LLC-PK(1)-GR101 cells and also decreases UT-A1 and UT-A3 mRNA expression (28). To determine whether the same effects of glucocortcoids could be observed in vivo, UT-Aα-βGal mice were administered dexamethasone for 6 days. β-Gal activity in the IM of dexamethasone treated mice was significantly lower than in control mice, 115 ± 29 RLU/μg compared to 273 ± 58 (Figure 11), suggesting that the UT-Aα-βGal transgene was regulated similarly to the endogenous UT-Aα promoter. In an identical experiment, real-time RT-PCR using isoform specific primers showed that the normalized mRNA levels of both UT-A1 and UT-A3 were significantly decreased after 6 days of dexamethasone administration (Figure 12).
Figure 11.
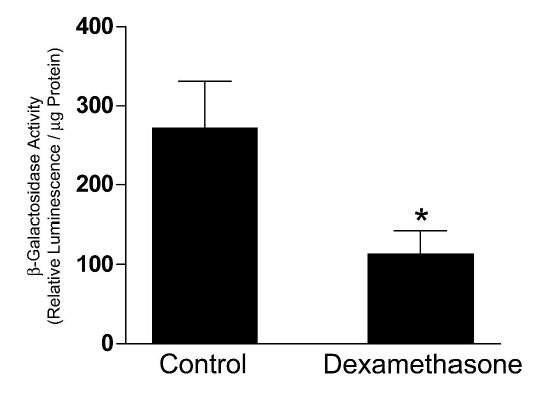
Effect of glucocorticoids on UT-A promoter activity in vivo. UT-Aα-βGal mice were administered dexamethasone for 6 days, the inner medullas isolated and β-Gal enzyme activity measured. Dexamethasone administration resulted in a significant (*) decrease in β-Gal activity (n = 5 for each group).
Figure 12.
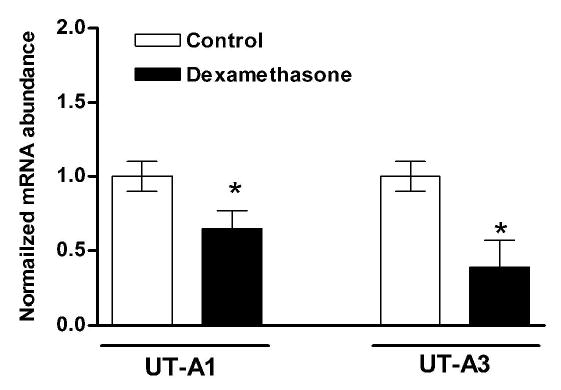
Real-time RT-PCR of kidney inner medulla RNA using isoform specific primers show that the normalized mRNA levels of both UT-A1 and UT-A3 are significantly decreased (*) after dexamethasone administration (solid bars), (n = 5 for each group).
DISCUSSION
The kidney maintains body fluid homeostasis by a series of specific transport processes that occur throughout the highly differentiated nephron. Due to the multiple different cell types and functional heterogeneity of the nephron, standard gene-deletion methods are often unable to provide precise information about a proteins specific role in any particular nephron segment. However, powerful new techniques to analyze gene function in a nephron-specific manner are now being utilized (reviewed in ((3, 15, 33)). The first requisite to generate these cell- or tissue specific knockouts is to characterize the promoter of a particular gene to determine if this region contains all the necessary elements that confer expression in a cell-specific manner.
The urea transporters, UT-A1 and UT-A3, are two members of the UT-A gene family. They are splice products of a single gene and the UT-Aα promoter region, situated at the 5′ -end of the gene, drives their transcription (1, 10, 25). In the mouse, immunohistochemistry has localized both UT-A1 and UT-A3 to the terminal portion of the IMCD. Specifically, UT-A1 is expressed both in the apical region and cytoplasm, whereas UT-A3 is both intracellular and in the basolateral membrane of IMCD principal cells (12, 32). Together, they mediate rapid transepithelial urea transport across the IMCD and thus prevent a urea induced osmotic diuresis (9). In the studies outlined in this manuscript, we used the mouse UT-Aα promoter to drive the expression of the reporter gene β-galactosidase. The aim of the study was to determine if the promoter fragment used contained the elements necessary to confer IMCD specific gene targeting.
Transgenic mice were created with 4.2kb of the mouse UT-Aα promoter driving the expression of a β-Gal reporter gene. This fragment of the UT-Aα promoter was found to be sufficient to drive β-Gal expression in both the kidney and, surprisingly, the vas deferens. In the kidney, β-Gal expression was localized to the terminal portion of the papillary tip. Co-localization studies with AQP2 determined that β-Gal was expressed in the principal cells of the IMCD, and no expression was observed in cells of the thin descending limb of Henle’s loop. Within the IMCD, in the line 2473, virtually all AQP2 containing principal cells were also positive for β-Gal, suggesting that the expression of the UT-Aα-βGal transgene was complete in this mouse line. However, importantly, β-Gal expression was only evident in the IMCD2 and IMCD3 segments, and in contrast to AQP2, there was no staining of IMCD1, the OMCD and the CCD. This pattern of β-Gal expression is consistent with the localization of UT-A1 and UT-A3 in the mouse kidney.
In addition to IMCD specific expression, the UT-Aα promoter region was sufficient to confer increased expression of β-Gal in response to water restriction. The promoter fragment used in these studies contains a tonicity-enhancer element and previous studies in cell culture have shown that the promoter can be up-regulated in response to either hypertonicity or increased cAMP levels (10). However, the use of this transgenic model has shown in vivo that the UT-Aα promoter can be regulated by prolonged antidiuresis. Interestingly, real-time RT-PCR studies revealed that, although their transcription is driven by the same promoter, only the mRNA transcript levels of the UT-A3 isoform were increased in response to water restriction. These results are similar to previous observations in mouse and suggest that their may be a difference in mRNA stability between the UT-A1 and UT-A3 mRNA transcripts; whether this is conferred by the different untranslated regions at the 3′end of the mRNA transcripts remains to be determined.
The administration of dexamethasone to UT-Aα-βGal mice significantly reduced β-Gal, UT-A1 and UT-A3 expression in the IMCD. These results are similar to those that have been observed previously in cell culture (28), indicating that the UT-Aα promoter is down-regulated by glucocorticoids. However, it is unlikely that this atypical regulation is via a glucocorticoid response element (GRE) (28).
A novel finding from this study was that the UT-Aα promoter also targeted expression of β-Gal to the columnar epithelial principal cells within the vas deferens. The vas deferens, along with the epydidymis, is part of a series of ducts responsible for the transport and maturation of sperm after they leave the rete testis. Within this ductal system, sperm is concentrated by water extraction and the composition of the luminal fluid is modified. Although further studies are required to determine the exact UT-A isoform expressed within the vas deferens, it is possible that the role of a urea transporter in this segment is to create an osmotic gradient between the vas deferens lumen and the interstitium and, with the aid of AQP2 also localized in this region (27, 30), provide a mechanism for water extraction and sperm concentration.
In the present study, two unexplained findings were that the UT-Aα-βGal transgene was not expressed in either the testis; where UT-A5 is expressed (11), or in the colon; where UT-A proteins have been localized using various UT-A specific antibodies (31). Two possible explanations for the lack of β-gal activity in these tissues are that the UT-Aα transgene did not contain all the necessary “testis-specific” or “colon-specific” enhancer elements, or that, in the case of UT-A5, a completely different internal promoter drives its transcription. Further studies are required to determine the mechanism of both colon and testis-specific expression.
In summary, we show here that 4.2kb of the 5′-flanking region of the UT-A gene directs expression to the IMCD principal cells of the kidney and that the transcriptional activity of the transgene can be regulated by either glucocorticoids or prolonged antidiuresis, similarly to the endogenous promoter. This transgenic model should facilitate future studies aimed at targeted gene deletion within the IMCD.
Acknowledgments
This study was funded by the Intramural Budget of the National Heart, Lung, and Blood Institute (National Institutes of Health to M.A. Knepper. The authors are grateful for the assistance of Chengyu Liu, manager of the NHLBI Transgenic Core Facility at the NIH and Christian A. Combs, manager of the NHLBI Light Microscopy Imaging Facility at the NIH. The authors would also like to thank Ellis Johns for expert technical assistance.
References
- 1.Bagnasco SM, Peng T, Janech MG, Karakashian A, Sands JM. Cloning and characterization of the human urea transporter UT-A1 and mapping of the human Slc14a2 gene. Am J Physiol Renal Physiol. 2001;281:F400–6. doi: 10.1152/ajprenal.2001.281.3.F400. [DOI] [PubMed] [Google Scholar]
- 2.Berger S, Bleich M, Schmid W, Cole TJ, Peters J, Watanabe H, Kriz W, Warth R, Greger R, Schutz G. Mineralocorticoid receptor knockout mice: pathophysiology of Na+ metabolism. Proc Natl Acad Sci U S A. 1998;95:9424–9. doi: 10.1073/pnas.95.16.9424. [DOI] [PMC free article] [PubMed] [Google Scholar]
- 3.Bianco RA, Keen HL, Lavoie JL, Sigmund CD. Untraditional methods for targeting the kidney in transgenic mice. Am J Physiol Renal Physiol. 2003;285:F1027–33. doi: 10.1152/ajprenal.00207.2003. [DOI] [PubMed] [Google Scholar]
- 4.Blau S, Daly L, Fienberg A, Teitelman G, Ehrlich ME. DARPP-32 promoter directs transgene expression to renal thick ascending limb of loop of Henle. Am J Physiol. 1995;269:F564–70. doi: 10.1152/ajprenal.1995.269.4.F564. [DOI] [PubMed] [Google Scholar]
- 5.Ding Y, Davisson RL, Hardy DO, Zhu LJ, Merrill DC, Catterall JF, Sigmund CD. The kidney androgen-regulated protein promoter confers renal proximal tubule cell-specific and highly androgen-responsive expression on the human angiotensinogen gene in transgenic mice. J Biol Chem. 1997;272:28142–8. doi: 10.1074/jbc.272.44.28142. [DOI] [PubMed] [Google Scholar]
- 6.Ding Y, Sigmund CD. Androgen-dependent regulation of human angiotensinogen expression in KAP-hAGT transgenic mice. Am J Physiol Renal Physiol. 2001;280:F54–60. doi: 10.1152/ajprenal.2001.280.1.F54. [DOI] [PubMed] [Google Scholar]
- 7.Emert MP, Sorenson CM, Basile DP, Rogers JG, Hammerman MR, Billadello JJ. The human plasminogen activator inhibitor type I gene promoter targets to kidney. Am J Physiol. 1998;274:F405–12. doi: 10.1152/ajprenal.1998.274.2.F405. [DOI] [PubMed] [Google Scholar]
- 8.Fenton RA, Chou CL, Ageloff S, Brandt W, Stokes JB, Knepper MA. Increased collecting duct urea transporter expression in Dahl salt- sensitive rats. Am J Physiol Renal Physiol. 2003;285:F143–51. doi: 10.1152/ajprenal.00073.2003. [DOI] [PubMed] [Google Scholar]
- 9.Fenton RA, Chou CL, Stewart GS, Smith CP, Knepper MA. Urinary concentrating defect in mice with selective deletion of phloretin-sensitive urea transporters in the renal collecting duct. Proc Natl Acad Sci U S A. 2004;101:7469–74. doi: 10.1073/pnas.0401704101. [DOI] [PMC free article] [PubMed] [Google Scholar]
- 10.Fenton RA, Cottingham CA, Stewart GS, Howorth A, Hewitt JA, Smith CP. Structure and characterization of the mouse UT-A gene (Slc14a2) Am J Physiol Renal Physiol. 2002;282:F630–8. doi: 10.1152/ajprenal.00264.2001. [DOI] [PubMed] [Google Scholar]
- 11.Fenton RA, Howorth A, Cooper GJ, Meccariello R, Morris ID, Smith CP. Molecular characterization of a novel UT-A urea transporter isoform (UT- A5) in testis. Am J Physiol Cell Physiol. 2000;279:C1425–31. doi: 10.1152/ajpcell.2000.279.5.C1425. [DOI] [PubMed] [Google Scholar]
- 12.Fenton RA, Stewart GS, Carpenter B, Howorth A, Potter EA, Cooper GJ, Smith CP. Characterization of mouse urea transporters UT-A1 and UT-A2. Am J Physiol Renal Physiol. 2002;283:F817–25. doi: 10.1152/ajprenal.00263.2001. [DOI] [PubMed] [Google Scholar]
- 13.Huang YJ, Chretien N, Bilodeau AS, Zhou JF, Lazaris A, Karatzas CN. Goat uromodulin promoter directs kidney-specific expression of GFP gene in transgenic mice. BMC Biotechnol. 2005;5:9. doi: 10.1186/1472-6750-5-9. [DOI] [PMC free article] [PubMed] [Google Scholar]
- 14.Hummler E, Barker P, Talbot C, Wang Q, Verdumo C, Grubb B, Gatzy J, Burnier M, Horisberger JD, Beermann F, Boucher R, Rossier BC. A mouse model for the renal salt-wasting syndrome pseudohypoaldosteronism. Proc Natl Acad Sci U S A. 1997;94:11710–5. doi: 10.1073/pnas.94.21.11710. [DOI] [PMC free article] [PubMed] [Google Scholar]
- 15.Igarashi P. Kidney-specific gene targeting. J Am Soc Nephrol. 2004;15:2237–9. doi: 10.1097/01.ASN.0000136298.09488.D7. [DOI] [PubMed] [Google Scholar]
- 16.Kim SW, Wang W, Nielsen J, Praetorius J, Kwon TH, Knepper MA, Frokiaer J, Nielsen S. Increased expression and apical targeting of renal ENaC subunits in puromycin aminonucleoside-induced nephrotic syndrome in rats. Am J Physiol Renal Physiol. 2004;286:F922–35. doi: 10.1152/ajprenal.00277.2003. [DOI] [PubMed] [Google Scholar]
- 17.Kobayashi K, Uchida S, Okamura HO, Marumo F, Sasaki S. Human CLC-KB gene promoter drives the EGFP expression in the specific distal nephron segments and inner ear. J Am Soc Nephrol. 2002;13:1992–8. doi: 10.1097/01.asn.0000023434.47132.3d. [DOI] [PubMed] [Google Scholar]
- 18.Ma T, Song Y, Yang B, Gillespie A, Carlson EJ, Epstein CJ, Verkman AS. Nephrogenic diabetes insipidus in mice lacking aquaporin-3 water channels. Proc Natl Acad Sci U S A. 2000;97:4386–91. doi: 10.1073/pnas.080499597. [DOI] [PMC free article] [PubMed] [Google Scholar]
- 19.Ma T, Yang B, Gillespie A, Carlson EJ, Epstein CJ, Verkman AS. Generation and phenotype of a transgenic knockout mouse lacking the mercurial-insensitive water channel aquaporin-4. J Clin Invest. 1997;100:957–62. doi: 10.1172/JCI231. [DOI] [PMC free article] [PubMed] [Google Scholar]
- 20.Ma T, Yang B, Gillespie A, Carlson EJ, Epstein CJ, Verkman AS. Severely impaired urinary concentrating ability in transgenic mice lacking aquaporin-1 water channels. J Biol Chem. 1998;273:4296–9. doi: 10.1074/jbc.273.8.4296. [DOI] [PubMed] [Google Scholar]
- 21.Matsumura Y, Uchida S, Kondo Y, Miyazaki H, Ko SB, Hayama A, Morimoto T, Liu W, Arisawa M, Sasaki S, Marumo F. Overt nephrogenic diabetes insipidus in mice lacking the CLC-K1 chloride channel. Nat Genet. 1999;21:95–8. doi: 10.1038/5036. [DOI] [PubMed] [Google Scholar]
- 22.Miller RL, Zhang P, Smith M, Beaulieu V, Paunescu TG, Brown D, Breton S, Nelson RD. V-ATPase B1-subunit promoter drives expression of EGFP in intercalated cells of kidney, clear cells of epididymis and airway cells of lung in transgenic mice. Am J Physiol Cell Physiol. 2005;288:C1134–44. doi: 10.1152/ajpcell.00084.2004. [DOI] [PubMed] [Google Scholar]
- 23.Moeller MJ, Sanden SK, Soofi A, Wiggins RC, Holzman LB. Two gene fragments that direct podocyte-specific expression in transgenic mice. J Am Soc Nephrol. 2002;13:1561–7. doi: 10.1097/01.asn.0000015614.68893.0b. [DOI] [PubMed] [Google Scholar]
- 24.Morris, R. G., S. Uchida, H. Brooks, M. A. Knepper, and C. L. Chou. Altered Expression Profile of Transporters in the IMCD of Aquaporin 1 Knockout Mice. Am J Physiol Renal Physiol , 2005. [DOI] [PubMed]
- 25.Nakayama Y, Naruse M, Karakashian A, Peng T, Sands JM, Bagnasco SM. Cloning of the rat Slc14a2 gene and genomic organization of the UT-A urea transporter. Biochim Biophys Acta. 2001;1518:19–26. doi: 10.1016/s0167-4781(00)00311-0. [DOI] [PubMed] [Google Scholar]
- 26.Naruse M, Klein JD, Ashkar ZM, Jacobs JD, Sands JM. Glucocorticoids downregulate the vasopressin-regulated urea transporter in rat terminal inner medullary collecting ducts. J Am Soc Nephrol. 1997;8:517–23. doi: 10.1681/ASN.V84517. [DOI] [PubMed] [Google Scholar]
- 27.Nelson RD, Stricklett P, Gustafson C, Stevens A, Ausiello D, Brown D, Kohan DE. Expression of an AQP2 Cre recombinase transgene in kidney and male reproductive system of transgenic mice. Am J Physiol. 1998;275:C216–26. doi: 10.1152/ajpcell.1998.275.1.C216. [DOI] [PubMed] [Google Scholar]
- 28.Peng T, Sands JM, Bagnasco SM. Glucocorticoids inhibit transcription and expression of the UT-A urea transporter gene. Am J Physiol Renal Physiol. 2002;282:F853–8. doi: 10.1152/ajprenal.00262.2001. [DOI] [PubMed] [Google Scholar]
- 29.Sepulveda AR, Huang SL, Lebovitz RM, Lieberman MW. A 346-base pair region of the mouse gamma-glutamyl transpeptidase type II promoter contains sufficient cis-acting elements for kidney-restricted expression in transgenic mice. J Biol Chem. 1997;272:11959–67. doi: 10.1074/jbc.272.18.11959. [DOI] [PubMed] [Google Scholar]
- 30.Stevens AL, Breton S, Gustafson CE, Bouley R, Nelson RD, Kohan DE, Brown D. Aquaporin 2 is a vasopressin-independent, constitutive apical membrane protein in rat vas deferens. Am J Physiol Cell Physiol. 2000;278:C791–802. doi: 10.1152/ajpcell.2000.278.4.C791. [DOI] [PubMed] [Google Scholar]
- 31.Stewart GS, Fenton RA, Thevenod F, Smith CP. Urea movement across mouse colonic plasma membranes is mediated by UT-A urea transporters. Gastroenterology. 2004;126:765–73. doi: 10.1053/j.gastro.2003.11.045. [DOI] [PubMed] [Google Scholar]
- 32.Stewart, G. S., R. A. Fenton, W. Wang, T.-H. Kwon, S. White, G. J. Cooper, S. Nielsen, and C. P. Smith. The basolateral expression of UT-A3 in the mouse kidney. Am J Physiol Submitted, 2003. [DOI] [PubMed]
- 33.Stricklett PK, Nelson RD, Kohan DE. The Cre/loxP system and gene targeting in the kidney. Am J Physiol. 1999;276:F651–7. doi: 10.1152/ajprenal.1999.276.5.F651. [DOI] [PubMed] [Google Scholar]
- 34.Stricklett PK, Taylor D, Nelson RD, Kohan DE. Thick ascending limb-specific expression of Cre recombinase. Am J Physiol Renal Physiol. 2003;285:F33–9. doi: 10.1152/ajprenal.00366.2002. [DOI] [PubMed] [Google Scholar]
- 35.Wong MA, Cui S, Quaggin SE. Identification and characterization of a glomerular-specific promoter from the human nephrin gene. Am J Physiol Renal Physiol. 2000;279:F1027–32. doi: 10.1152/ajprenal.2000.279.6.F1027. [DOI] [PubMed] [Google Scholar]
- 36.Yang B, Bankir L, Gillespie A, Epstein CJ, Verkman AS. Urea-selective concentrating defect in transgenic mice lacking urea transporter UT-B. J Biol Chem. 2002;277:10633–7. doi: 10.1074/jbc.M200207200. [DOI] [PubMed] [Google Scholar]
- 37.Yang B, Gillespie A, Carlson EJ, Epstein CJ, Verkman AS. Neonatal mortality in an aquaporin-2 knock-in mouse model of recessive nephrogenic diabetes insipidus. J Biol Chem. 2001;276:2775–9. doi: 10.1074/jbc.M008216200. [DOI] [PubMed] [Google Scholar]
- 38.Yun J, Schoneberg T, Liu J, Schulz A, Ecelbarger CA, Promeneur D, Nielsen S, Sheng H, Grinberg A, Deng C, Wess J. Generation and phenotype of mice harboring a nonsense mutation in the V2 vasopressin receptor gene. J Clin Invest. 2000;106:1361–71. doi: 10.1172/JCI9154. [DOI] [PMC free article] [PubMed] [Google Scholar]
- 39.Zharkikh L, Zhu X, Stricklett PK, Kohan DE, Chipman G, Breton S, Brown D, Nelson RD. Renal principal cell-specific expression of green fluorescent protein in transgenic mice. Am J Physiol Renal Physiol. 2002;283:F1351–64. doi: 10.1152/ajprenal.0224.2001. [DOI] [PubMed] [Google Scholar]
- 40.Zhu X, Cheng J, Gao J, Lepor H, Zhang ZT, Pak J, Wu XR. Isolation of mouse THP gene promoter and demonstration of its kidney-specific activity in transgenic mice. Am J Physiol Renal Physiol. 2002;282:F608–17. doi: 10.1152/ajprenal.00297.2001. [DOI] [PubMed] [Google Scholar]