

Abstract
Insulin signal transduction in adipocytes is accompanied by a burst of cellular hydrogen peroxide (H2O2 facilitates insulin signaling by inhibiting thiol-dependent protein-tyrosine phosphatases (PTPs)) that are negative regulators of insulin action. As hyperglycemia is associated with increased cellular reactive oxygen species, we postulated that high glucose conditions might potentiate the H2O2 generated by insulin and modulate insulin-stimulated protein phosphorylation. Basal H2O2 generation was increased threefold in differentiated 3T3-L1 adipocytes by growth in 25 mM glucose versus 5 mM glucose. High glucose increased the sensitivity of the insulin-stimulated H2O2 signal to lower concentrations of insulin. Basal endogenous total PTP activity and the activity of PTP1B, a PTP implicated in the negative regulation of insulin signaling, were reduced in high glucose conditions, and their further reduction by insulin stimulation was more enhanced in high versus low glucose medium. Phosphorylation of the insulin receptor, IRS-1, and Akt in response to insulin was also significantly enhanced in high glucose conditions, especially at submaximal insulin concentrations. In primary rat adipocytes, high glucose increased insulin-stimulated H2O2 the oxidative inhibition of total PTP production and potentiated and PTP1B activity; however, insulin signaling was not enhanced in the primary cells in high glucose apparently due to cross-regulation of insulin-stimulated protein phosphorylation by activation of protein kinase C (PKC). These studies indicate that high glucose can enhance insulin-stimulated H2O2 generation and augment oxidative PTP inhibition in cultured and primary adipocytes, but the overall balance of insulin signal transduction is determined by additional signal effects in high glucose, including the activation of PKC.
INTRODUCTION
for more than 30 years, it has been known that insulin elicits the generation of hydrogen peroxide (H2O2) in mature adipocytes (for review, see 7). More recently, we have shown that insulin stimulation of adipose and hepatoma cells leads to the rapid generation of a burst of cellular H2O2 that is associated with enhanced early as well as distal activation of the insulin signal transduction pathway (13, 14). The oxidant generated by insulin stimulation influences insulin action at several levels. Initially, cellular protein-tyrosine phosphatases (PTPs) are targets of oxidative inhibition because these enzymes require a reduced cysteine thiol group for catalytic enzyme activity (1, 17). Specifically, the activity of the intracellular PTP homologue, PTP1B, which has been strongly implicated in the negative regulation of insulin signaling, is acutely diminished by insulin stimulation (6, 14). More distally, the oxidant signal from insulin stimulation is integral to the activation of the protein kinase Akt by affecting its upstream interaction with phosphatidylinositol 3′-kinase (13, 16). Thus, alterations in the levels of cellular oxidant molecules can have specific and important effects at various levels of the insulin signaling cascade.
High glucose levels, especially when chronic, cause a rise in cellular reactive oxygen species (ROS) (4). In contrast to insulin-induced ROS, which involves an NADPH oxidase mechanism (15), the oxidative signal resulting from hyperglycemia has been shown to be derived from mitochondrial glycolytic metabolism (4). When glucose levels are excessive and long-standing, potentially deleterious effects on various signaling pathways and cellular homeostatic mechanisms are observed that contribute to the tissue damage underlying the chronic microvascular complications in patients with various forms of diabetes mellitus.
In the present study, we postulated that the ambient glucose concentration may affect the generation of ROS from insulin treatment of cultured and primary adipose cells and that this may, in turn, influence signal transduction in the insulin action pathway. We also evaluated whether the effects of high glucose exposure affected the inhibition of PTPs involved in the insulin signaling cascade, in particular PTP1B.
EXPERIMENTAL PROCEDURES
Materials
Dulbecco’s modified Eagle’s medium (DMEM), penicillin/streptomycin, and fetal calf serum were obtained from GibcoBRL (Grand Island, NY, U.S.A.), and recombinant human insulin was obtained from Sigma (St. Louis, MO, U.S.A.). 5,6-Chloromethyl-2′,7′-dichlorodihydrofluorescein diacetate (DCF-DA; no. C-6827) was from Molecular Probes, Inc. (Eugene, OR, U.S.A.), and enhanced chemiluminescence (ECL) reagents were from PerkinElmer Life Sciences (Boston, MA, U.S.A.). Monoclonal PTP1B antibody (Ab-2) was from Calbiochem/Oncogene Sciences (La Jolla, CA, U.S.A.). Trisacryl protein G was obtained from Pierce (Rockford, IL, U.S.A.). Monoclonal anti-phosphotyrosine (4G10) and polyclonal antibodies to the insulin receptor β-subunit and IRS-1 were from Upstate Biotechnology, Inc. (Lake Placid, NY, U.S.A.). Antibodies to phosphorylated Akt (Ser473) and Akt protein (non-isoform-specific) were purchased from New England Biolabs (Beverly, MA, U.S.A.). para-Nitrophenyl phosphate (pNPP), reduced, carboxamidomethylated, maleylated (RCM) lysozyme, diamide (N,N,N′,N′-tetramethylazodicarboxamide), and bisindolylmaleimide I (GF 109203X) were from Sigma. Horseradish peroxidase-conjugated secondary anti-mouse and anti-rabbit IgG antibodies were obtained from Amersham Biosciences Corp. (Piscataway, NJ, U.S.A.). All other chemicals and reagents, unless otherwise noted, were obtained from Sigma or Fisher Scientific (Pittsburgh, PA, U.S.A.).
Cell culture and treatment conditions
Murine 3T3-L1 preadipocytes were differentiated with insulin, dexamethasone, and isobutylmethylxanthine as described (5). Cells were serum-starved overnight in medium containing 0.5% (wt/vol) bovine serum albumin (BSA) prior to insulin stimulation. For experiments using low glucose conditions (5 mM glucose), the culture medium also contained 20 mM mannitol to maintain osmotic control compared with high glucose medium containing 25 mM glucose.
Isolation, culture, and treatment of primary rat adipocytes
Epididymal adipocytes were isolated from 200-250-g Sprague-Dawley rats (Charles River Laboratories, Wilmington, MA, U.S.A.) as previously described (26) and handled under sterile conditions. The cells were serum-starved overnight and then incubated in DMEM with 0.2% BSA also containing either 5 mM glucose with 20 mM mannitol or high glucose medium containing 25 mM glucose.
Detection of cellular ROS
Differentiated 3T3-L1 adipocytes cultured under the indicated conditions were loaded for 10 min with DCF-DA at 10 μg/ml in colorless DMEM containing 10 mM HEPES buffer, pH 7.4. Extracellular DCF-DA was removed by washing in fresh culture medium, and intracellular H2O2 production was detected by fluorescence on confocal microscopy (Bio-Rad, Hercules, CA, U.S.A.) at an excitation wavelength of 488 nm and emission at 515-540 nm. To avoid photooxidation, the fluorescence image was collected by a single rapid scan with identical parameters for all samples as described (14). The fluorescence intensity was quantitated from sampled images using Scion Image software (Scion Corp., Frederick, MD, U.S.A.). In the primary rat adipocytes, insulin-stimulated ROS were detected using a similar approach of loading with DCF-DA (20 μM) followed by flow cytometry analysis as described by Lu et al. (11).
PTP assay
3T3-L1 adipocytes were serum-starved for 16 h in 5 mM or 25 mM glucose prior to treatment with 100 nM insulin for 5 min and snap-frozen with liquid nitrogen. Rat adipocytes were similarly maintained in culture as described above for 24 h prior to treatment with 100 nM insulin for 5 min and immediately frozen in liquid nitrogen. The frozen samples were introduced into an anaerobic work station (Forma Scientific, Marietta, OH, U.S.A.; model 901024) in a frozen state, and lysed in the anaerobic condition using ice-cold deoxygenated homogenization buffer [150 mM NaCl, 5 mM EDTA, 5 mM EGTA, in 50 mM HEPES, pH 7.5, 1% (vol/vol) Triton X-100 containing a protease inhibitor mixture (Sigma)] followed by brief sonication (27, 28). The whole-cell lysate was cleared by centrifugation at 15,000 g for 20 min, 15,000 g for 20 min for 3T3-L, 100,000 g for 30 min for rat fat cells, and supernatant was saved for the PTP enzyme assay. Protein was estimated using the method of Bradford (3). Aliquots of 30 μg of protein were incubated in a final volume of 100 μl at 37°C for 30 min in reaction buffer containing 10 mM pNPP (Sigma) and 2 mM EDTA in 20 mM MES at pH 6.0 as we have previously described (27). The reaction was stopped by the addition of 900 μl of 0.2 M NaOH, and the absorption was determined at 410 nm. The initial rate of p NPP hydrolysis was estimated from the linear portion of the earliest time points of the enzymatic reaction. PTP activity is reported as the optical density from hydrolysis of pNPP during the initial linear portion of the reaction period.
Where indicated, PTP activity was also measured by hydrolysis of 32P-labeled RCM-lysozyme (25). The initial rate of hydrolysis was estimated from the linear portion of the earliest time points of the enzymatic reaction and reported as DPM 32P released per milligram of protein per minute.
Specific activity of PTP1B
Under anaerobic conditions, PTP1B was immunoprecipitated from cell lysates (500 μg of protein) with a monoclonal antibody directed at a C-terminal epitope that preserves its enzymatic activity (Oncogene Sciences; Ab-2) followed by adsorption to trisacryl protein G. PTP activity was measured by the hydrolysis of pNPP or 32P-RCM-lysozyme in the anaerobic chamber in washed immunoprecipitates as we have described previously (28). Control samples using nonimmune mouse IgG showed minimal background PTP activity (<5% of the activity with Ab-2).
Measurement of phosphorylation of insulin receptors, IRS-1 or Akt
Rat fat cells were cultured and lysed as previously described (26). Serum-starved 3T3-L1 adipocytes were incubated in medium containing 5 mM or 25 mM glucose for the indicated amount of time. After stimulation with 1-100 nM insulin for 5 min, the reactions were stopped by snap-freezing in liquid nitrogen. Cells were then lysed in buffer containing 50 mM HEPES, pH 7.5, 150 mM NaCl, 1% (vol/vol) Triton X-100, 100 mM sodium fluoride, 1 mM EGTA, 1 mM EDTA, 2 mM sodium vanadate, 10 mM sodium pyrophosphate, 1 mM phenylmethylsulfonyl fluoride, and 1 × protease inhibitor mixture (Sigma). The lysates were briefly sonicated and centrifuged at 13,000 g for 10 min, and 30 μg of protein of the cleared supernatant was resolved by sodium dodecyl sulfate (SDS)-polyacrylamide gel electrophoresis [7.5% (wt/vol) polyacrylamide] and transferred to polyvinylidene difluoride (PVDF) membrane using a trans-blot electrophoretic transfer cell (Bio-Rad). PVDF membranes were subjected to immunoblotting with either monoclonal antibody for phosphotyrosine (4G10) to detect insulin receptor β-subunit and IRS tyrosine phosphorylation or polyclonal antibody to detect phospho-Akt. Following incubation with horseradish peroxidase-conjugated secondary antibodies, proteins were visualized by ECL, according to the instructions provided by the manufacturer. To reprobe the blots, the membranes were incubated for 30 min at 50°C in stripping buffer [62.5 mM Tris-HCl, pH 6.8, 100 mM 2-mercaptoethanol, and 2% (wt/vol) SDS] and then washed several times with TBST [20 mM Tris-HCl, pH 7.6, 137 mM NaCl, and 0.1% (vol/vol) Tween 20]. The filters were reprobed with additional antibodies to detect total protein levels of the insulin receptor β-subunit, IRS-1, and Akt, where indicated, and the tabulated data were normalized to the signal from the total protein blot. The immunoblotting signals were quantitated using an ImageStation 440 (Kodak).
Statistical analyses
Quantitative data are expressed as the means ± SEM from replicate determinations. ANOVA with a post-hoc correction was used to determine differences among three or more groups. Student’s t test was used to compare the mean values from two groups. Differences were regarded as significant when the p value was <0.05.
RESULTS
Potentiation of cellular H2O2 production by high glucose in 3T3-L1 adipocytes
3T3-L1 adipocytes maintained in 25 mM glucose showed a threefold increase in basal cellular H2O2, assessed by intracellular DCF fluorescence on confocal microscopy, compared with control cells in 5 mM glucose medium, which also included 20 mM mannitol to control for the osmotic effects of the high glucose conditions (p < 0.001; Fig. 1). Following stimulation with 1 and 10 nM insulin for 5 min, intracellular H2O2 was increased 6.3-fold and 1.5-fold, respectively, in 25 mM glucose compared with control conditions (both p < 0.001), but was similar at 100 nM insulin under both glucose conditions. These data indicated that hyperglycemia did not affect the maximal response, but increased the sensitivity of the insulin-stimulated oxidant signal.
FIG. 1.
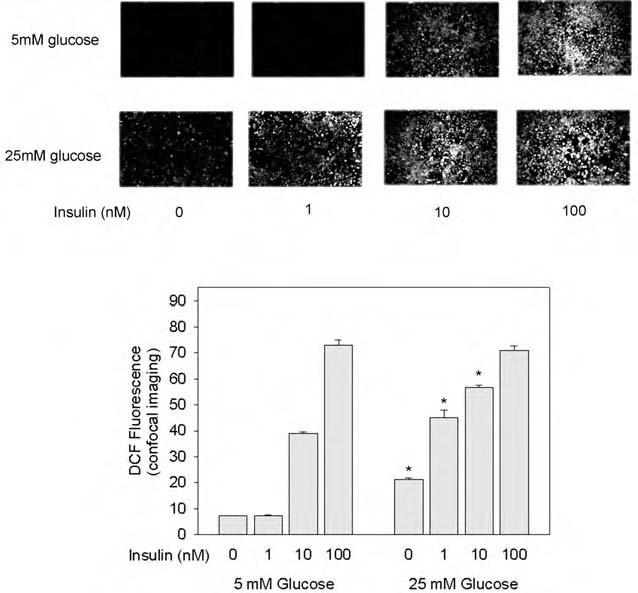
Effect of high glucose incubation on insulin-stimulated H2O2 production in 3T3-L1 adipocytes. Differentiation of 3T3-L1 adipocytes was induced during culture on chambered microscope slides in medium containing 5 mM glucose (also containing 20 mM mannitol as an osmotic control) or high (25 mM) glucose conditions as indicated, from day 5 of differentiation until the experiment was performed 8 days later. After serum starvation overnight, cells were washed, the medium was changed to colorless DMEM containing DCF-DA (10 μg/ml), and the cells were incubated at 37°C for 10 min. During the last 5 min of incubation, cells were also acutely stimulated with insulin (final concentration of 1.0, 10, and 100 nM) as indicated. Intracellular H2O2 production was detected by fluorescence of the cellular DCF-DA signal on confocal microscopy at an excitation wavelength of 488 nm and emission at 515-540 nm. The fluorescent confocal images were quantitated using Scion Image software. In the tabulated data presented in the bar graph, the asterisks indicate p < 0.001 when compared with samples tested at the same insulin concentration but at 5 mM glucose.
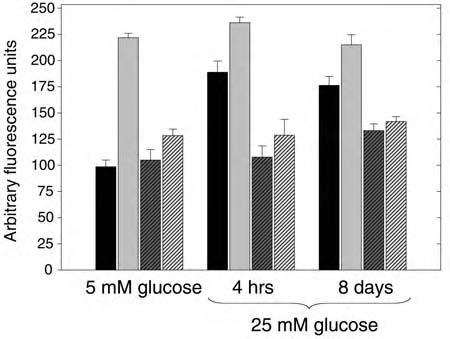
Cellular H2O2 production was also measured in 3T3-L1 adipocytes acutely exposed to high glucose (Fig. 2). Compared with control 5 mM glucose conditions, short-term (4 h) and long-term (8 days) incubation in 25 mM glucose increased intracellular H2O2 production by 3.1-fold and 1.7-fold, respectively (p < 0.05 for all pairwise comparisions by ANOVA).
FIG. 2.
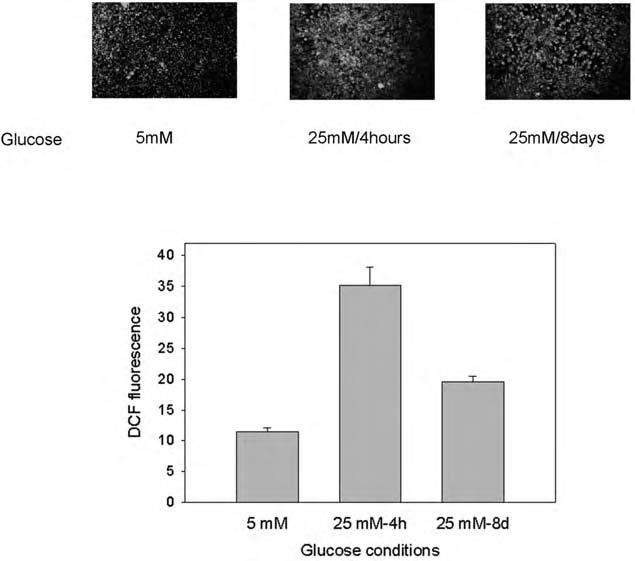
Effect of short-term high glucose incubation on H2O2 production in 3T3-L1 adipocytes. 3T3-L1 cells were differentiated on chambered microscope slides in DMEM containing 5 mM glucose (with 20 mM mannitol) or 25 mM glucose as described in the legend to Fig. 1. For comparison, one set of cultured cells was transferred to high glucose medium for 4 h prior to study. Intracellular H2O2 production was detected by fluorescence of DCF-DA on confocal microscopy, and the fluorescent confocal images were quantitated using Scion Image software. In the tabulated data presented in the bar graph, all pairwise comparisions were significantly different by ANOVA (p < 0.05).
Effect of high glucose on PTP activity in 3T3-L1 adipocytes
As our previous data showed that insulin-induced intracellular H2O2 production causes the oxidative inhibition of PTPs (13, 14, 16), we tested if the increased H2O2 production resulting from high glucose conditions also affected cellular PTP activity. PTP activity was measured in 3T3-L1 adipocyte cell lysates isolated under anaerobic conditions to avoid air oxidation, and without added reducing agents, reflecting the endogenous state of enzyme activity (28). In cells cultured for 8 days under 25 mM glucose conditions, the basal level of endogenous total PTP activity as well as the activity of PTP1B, a PTP implicated in the negative regulation of insulin signaling, was reduced by 24% (p = 0.002) and 19% (p = 0.01), respectively (Fig. 3). Following insulin stimulation (100 nM for 5 min), the activity of total PTPs was reduced to a similar degree from the control without insulin in both glucose conditions (48-50%). However, this resulted in a further reduction of 27% by insulin under high glucose compared with low glucose conditions (p = 0.01). Similarly, the activity of PTP1B was further reduced by 32% following insulin stimulation in high glucose medium (p = 0.03). These data are consistent with an effect of high glucose to enhance the acute inhibition by insulin of thiol-sensitive PTPs by the increase in cellular ROS.
FIG. 3.
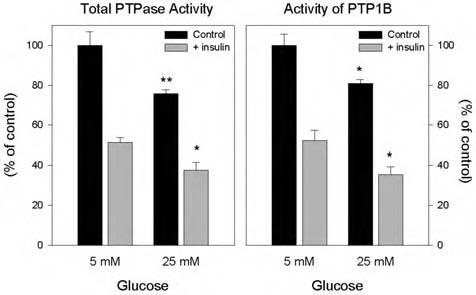
Effect of high glucose on the insulin-induced reduction of PTP activities in 3T3-L1 adipocytes. Total cellular PTP activity (left panel): Following overnight serum starvation, 3T3-L1 adipocytes cultured in 25 mM glucose for 8 days were treated with 100 nM insulin where indicated, then snap-frozen in liquid nitrogen, and lysed within the anaerobic chamber. To measure total PTPase activity, equal amounts of lysate protein (30 μg) were incubated in a final volume of 100 μl at 37°C for 30 min in reaction buffer containing 10 mM pNPP (Sigma) and 2 mM EDTA in 20 mM MES at pH 6.0 without dithiothreitol. The reaction was stopped by the addition of 900 μl of 0.2 M NaOH, and the absorption was determined at 410 nm. Activity of immunoprecipitated PTP1B (right panel): Using equal amounts of lysate protein (500 μg), under anaerobic conditions, lysates were precleared with nonimmune IgG and trisacryl protein G, followed by isolation of PTP1B by immunoprecipitation with a monoclonal antibody directed at a C-terminal epitope that preserves its enzymatic activity (Ab- 2). PTP1B activity was measured in washed immunoprecipitates as indicated above by hydrolysis of pNPP. *p < 0.5, **p < 0.001, compared with the corresponding samples in 5 mM glucose.
Effect of high glucose on tyrosine phosphorylation of the insulin receptor and IRS-1 in 3T3-L1 adipocytes
As insulin signal transduction in adipocytes is accompanied by a burst of cellular H2O2 that inhibits cellular PTPs, we tested whether high glucose conditions, which increased cellular ROS and also appeared to inhibit cellular PTP activity, affected the insulin-stimulated tyrosine phosphorylation of the insulin receptor β-subunit. Culture in high glucose conditions for a prolonged period (8 days) significantly enhanced the insulin-stimulated tyrosine phosphorylation of the insulin receptor at submaximal insulin concentration (1-10 nM) by two- to fivefold compared with low glucose conditions (Fig. 4). Insulin receptor tyrosine phosphorylation stimulated by maximal insulin concentration (100 nM) was also increased on average by 50% compared with control or short-term increased glucose conditions, but was not statistically significant owing to data variation. Similarly, insulin receptor tyrosine phosphorylation under conditions of high glucose for 4 h trended to be increased, but was not statistically significant.
Fig. 4.
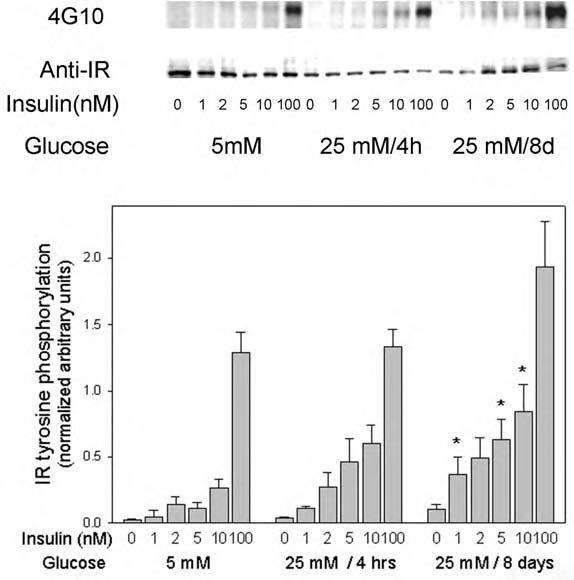
Effect of high glucose on insulin-stimulated tyrosine phosphorylation of the insulin receptor in 3T3-L1 adipocytes. Serum-starved 3T3-L1 cells, incubated under the indicated glucose conditions, were acutely stimulated with the indicated concentrations of insulin for 5 min. The reactions were stopped by snap-freezing the cells in liquid nitrogen followed by cell lysis into homogenization buffer, brief sonication, and micro-centrifugation. The cleared cell lysates (30 μg) were applied to 7.5% polyacrylamide gels containing SDS, transferred to PVDF membranes, and blotted with anti-phosphotyrosine antibody 4G10. After the signal was developed by ECL, membranes were stripped and reblotted with anti-insulin receptor antibodies. In the quantitated data on the bar graph, the asterisks indicate significant differences from the control cells cultured in 5 mM glucose (p < 0.05), as described in the text.
We then studied the effects of short- and long-term high glucose incubation on insulin-induced IRS-1 tyrosine phosphorylation. High glucose significantly enhanced the insulin-stimulated tyrosine phosphorylation of IRS-1 at submaximal insulin concentration (1-10 nM) by up to 2.2-fold (p < 0.05) after 4 h of incubation (Fig. 5). During the prolonged incubation in high glucose, there was a trend toward a similar increase, which was not statistically significant, most likely because of experimental variation.
Fig. 5.
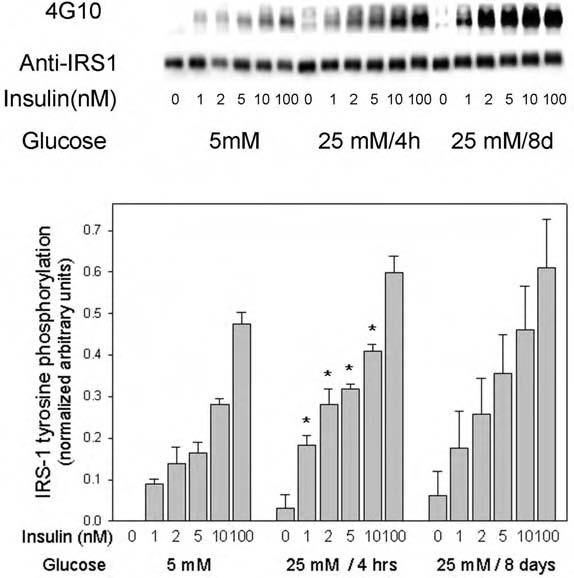
Effect of high glucose on insulin-stimulated tyrosine phosphorylation of IRS proteins in 3T3-L1 adipocytes. These experiments were performed exactly as described in the legend to Fig. 4, except that the IRS protein tyrosine phosphorylation signal was quantitated and the blots were reprobed with an antibody to IRS-1 for normalization. In the quantitated data on the bar graph, the asterisks indicate significant differences from the control cells cultured in 5 mM glucose (p < 0.05), as described in the text.
Effect of high glucose on insulin-stimulated activation of Akt
To determine further the impact of the observed changes in insulin receptor and IRS-1 tyrosine phosphorylation in high glucose medium, we also examined the effect of high glucose incubation on the activation of Akt by immunoblot analysis with phosphospecific (Ser473) antibodies. Insulin-stimulated activation of Akt was significantly enhanced by 4-h and 8-day incubations in medium containing mM glucose at all insulin concentrations tested, from 1 to 100 nM(Fig. 6). Compared with low glucose conditions, the magnitude of the increase in Akt Ser473 phosphorylation was up to 5.5-fold at 4 h and up to 13-fold at 8 days (all p < 0.05). These data indicated that high glucose medium enhanced the sensitivity as well as the responsiveness of activation of Akt in both submaximal and maximal (100 nM) concentrations of insulin.
FIG. 6.
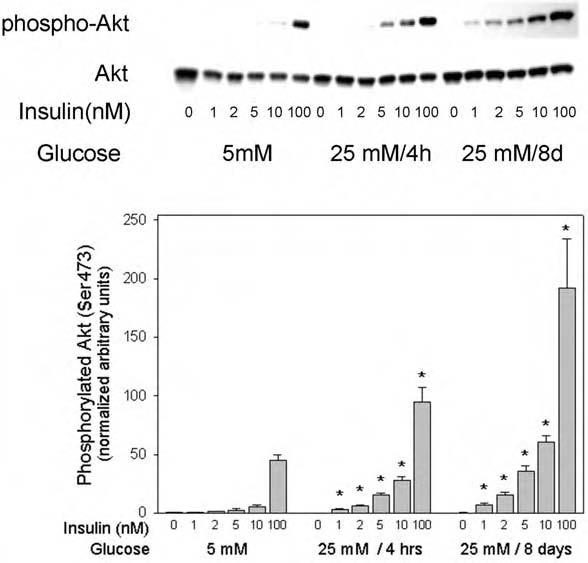
Effect of high glucose on insulin-stimulated Akt Ser473 phosphorylation in 3T3-L1 adipocytes. Serum-starved 3T3-L1 cells were incubated in the indicated glucose condition, stimulated for 5 min with the indicated concentrations of insulin, and samples were processed as described in the legend to Fig. 4. The western blots were probed with phospho-Akt (Ser473) antibody, followed by stripping and rehybridization with antibody to Akt protein for normalization. The asterisks indicate significant differences from the control cells cultured in 5 mM glucose (p < 0.05), as described in the text.
Effect of reducing and oxidizing agents on H2O2 production
N-Acetylcysteine (NAC) is commonly used to provide reducing equivalents directly in the form of the cysteine thiol, as well as to increase the level of reduced cellular glutathione (GSH) by providing cysteine, a component of the GSH tripeptide. Fully differentiated 3T3-L1 adipocytes maintained in high glucose medium were serum-starved for 16 h and treated with 10 mM NAC for 1 h prior to measurement of H2O2 production by loading with DCF-DA (10 μg/ml) for 10 min. Cellular fluorescence was then quantitated by confocal microscopy. Cell treatment with NAC resulted in a significant reduction of cellular H2O2 generation to 29% of the untreated control (p < 0.02; Fig .7).
FIG. 7.
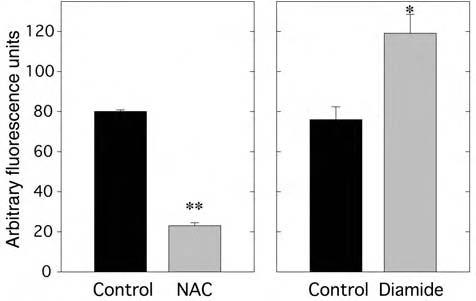
Effect of NAC or diamide on H2O2 production in 3T3-L1 adipocytes under high glucose conditions. NAC (left panel): Fully differentiated 3T3-L1 adipocytes maintained in 25 mM glucose medium were treated with 10 mM NAC for 1 h prior to measurement of H2O2 production by loading with DCF-DA (10 μg/ml) for 10 min followed by confocal fluorescence microscopy. Confocal images were quantitated using Scion Image software. **p < 0.001 versus control. Diamide (right panel): This experiment was performed as described for NAC, except that the cells were treated with diamide (30 μM) for 1 h prior to measurement of cellular H2O2 production on confocal microscopy. * < 0.02 versus control.
We also pretreated cells with diamide, an oxidant that effectively depletes cellular GSH, prior to measuring H2O2 production. Differentiated 3T3-L1 adipocytes maintained in high glucose medium were serum-starved for 16 h, treated with 30 μM diamide for 1 h, and then loaded with DCF-DA (10 μg/ml) for 10 min. The cellular fluorescence was then detected by confocal microscopy. Reduction of cellular GSH by diamide increased the basal cellular H2O2 content by 57% (p < 0.02; Fig. 7).
Effect of mitochondrial inhibitors on high glucose-induced H2O2 production
The increased generation of ROS in bovine aortic endothelial cells induced by growth in high glucose conditions has been shown by Nishikawa et al. to be prevented by various inhibitors of mitochondrial metabolism (19). These include carbonyl cyanide m-chlorophenylhydrazone (CCCP), an uncoupler of oxidative phosphorylation, α-cyano-4-hydroxycinnamic acid (OHCA), an inhibitor of glycolysis-derived pyruvate transport into mitochondria, and thenoyltrifluoroacetone 532 WU ET AL. (TTFA), an inhibitor of electron transport chain complex II. Using concentrations of these agents similar to those shown to be effective in the endothelial cell system, we tested whether each of these inhibitors affected the excess generation of H2O2 induced by high glucose in the 3T3-L1 adipocytes (Fig. 8). Interestingly, each of these mitochondrial inhibitors was effective in this regard: the maximal generation of ROS under high glucose conditions was reduced by CCCP by 19% and 55% at 1.0 and 10 μM (p < 0.05 and p < 0.001), by OHCA by 96% at 2,500 μM (p < 0.001), and by TTFA by 30% and 57% at 10 and 100 μM (p = 0.002 and p < 0.001). These data suggest that increased mitochondrial metabolism from high glucose conditions is involved in the enhanced generation of ROS.
FIG. 8.
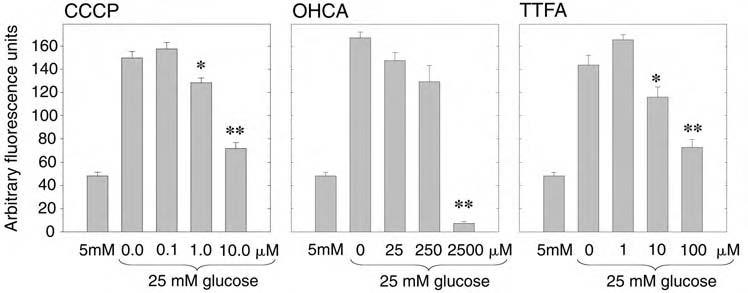
Effect of inhibitors of mitochondrial metabolism on H2O2 production in 3T3-L1 adipocytes under high glucose conditions. Fully differentiated 3T3-L1 adipocytes were maintained in either 5 mM glucose with 20 mM mannitol or 25 mM glucose as shown, prior to treatment with the indicated mitochondrial inhibitor (CCCP, OHCA, TTFA) for 1 h prioto measurement of H2O2 production by DCF-DA loading and confocal fluorescence microscopy. The data from a dose-response with each of the tested inhibitors is shown. * < 0.05 and **p < 0.001 (CCCP); **p < 0.001 (OHCA); * = 0.002 and **p < 0.001 (TTFA), compared with the control samples in 25 mM glucose without inhibitor.
Effect of the flavoprotein oxidase inhibitor, diphenyleneiodonium (DPI), on high glucose and insulin-stimulated H2O2 production
We also tested whether DPI, an inhibitor of flavoprotein-containing oxidases including NADPH oxidase, which we have shown inhibits the burst of intracellular H2O2 from cellular insulin stimulation, affected the generation of H2O2 from high glucose incubation, with and without insulin costimulation. Similar to the experiment shown in Fig. 1, acute insulin stimulation of 3T3-L1 adipocytes maintained in 5 mM glucose increased the generation of cellular ROS by 2.3-fold (Fig. 9). Treatment with 10 μM DPI prior to insulin stimulation had no effect on the basal cellular DCF fluorescence, but completely abrogated the insulin-stimulated increase in cellular H2O2. In cells incubated in high glucose medium for 4 h or 8 days, the basal cellular DCF fluorescence was increased by 91% and 78%, respectively (both p < 0.001), and acute insulin stimulation further increased the glucose effect by 26% and 22%, respectively (p = 0.007 and p = 0.02). Prior incubation with DPI, however, completely inhibited the increase in cellular DCF fluorescence, with or without the costimulation with insulin, indicating that cellular mechanisms susceptible to inhibition with DPI play a role in the enhanced generation of ROS in the presence of high glucose as well as insulin stimulation.
FIG. 9.
Effect of DPI on high glucose and insulin-stimulated H2O2 production. 3T3-L1 adipocytes were cultured in 5 mM glucose or mM glucose for 4 h or 8 days as indicated. Prior to measurement of cellular H2O2 production by loading with DCF-DA and confocal fluorescence microscopy, control cells (black bars) were also treated with 100 nM insulin for 5 min (gray bars) and also with 10 μM DPI without (dark gray hatched bars) or with insulin stimulation (light gray hatched bars).
Potentiation of cellular H2O2 production by high glucose in primary rat adipocytes
Cellular H2O2 generation in primary rat adipocytes was increased by 77% by incubation in mM glucose for 24 h (Fig. 10A). Stimulation with 100 nM insulin for 5 min in low glucose conditions increased H2O2 production by 56%, which was magnified in high glucose incubation to 2.2-fold compared with the basal level in low glucose without insulin stimulation (p < 03).
FIG. 10.
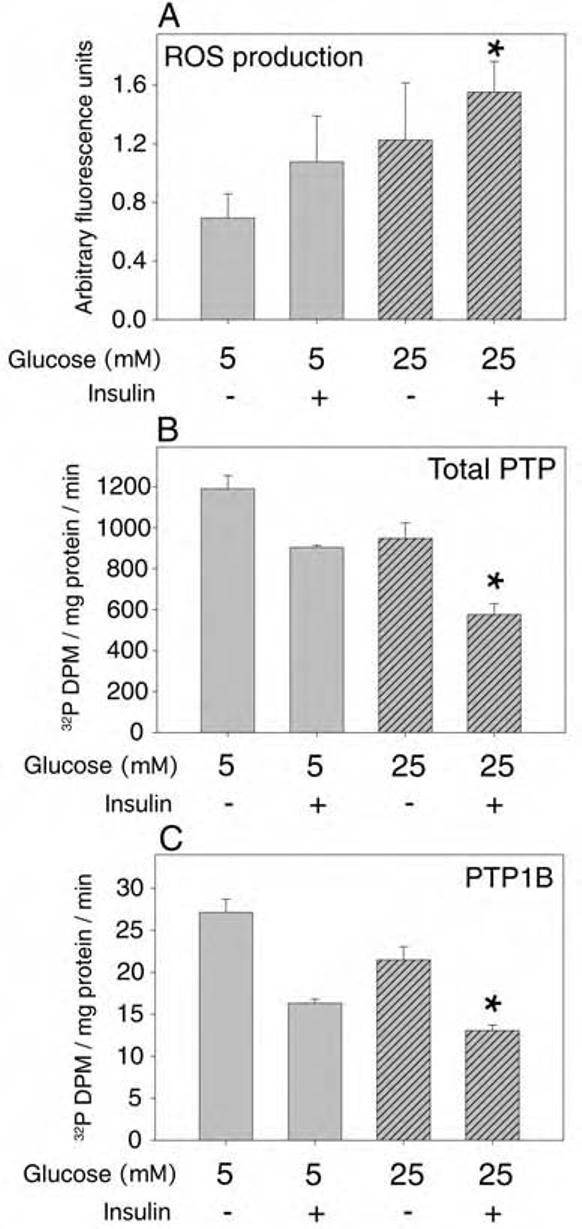
Effect of high glucose and insulin on ROS production and PTP activities in primary cultured rat adipocytes. Primary rat adipocytes were isolated as described in Experimental Procedures and cultured under sterile conditions overnight in DMEM with 0.2% (wt/vol) BSA also containing either 5 mM glucose with 20 mM mannitol or high glucose medium containing mM glucose. (A) Prior to measurement of ROS, the cells were loaded with DCF-DA and, where indicated, stimulated with 100 nM insulin for 5 min followed by flow cytometry analysis. Following the indicated treatments, adipocyte lysates were prepared under anaerobic conditions and the total PTP activity (B) or the specific activity of immunoprecipitated PTP1B (C) was measured by hydrolysis of 32P-RCM-lysozyme, as described in Experimental Procedures. The asterisks indicate a significant difference (p < 0.01) compared with control samples in low glucose without insulin stimulation.
Effect of high glucose on PTP activities in primary rat adipocytes
High glucose incubation conditions also reduced the level of PTP activity in the primary rat adipocytes. Using 32PRCM- lysozyme as substrate, stimulation with 100 nM insulin for 5 min in low glucose medium reduced the total endogenous PTP activity in adipocyte lysates by 24% compared with that in control cells (Fig. 10B). Prior incubation for 24 h in mM glucose followed by stimulation with insulin resulted in a 52% decrease in total PTP activity (p < 0.001). Similar results were obtained using pNPP as PTP substrate (data not shown). The activity of PTP1B immunoprecipitated from the primary adipocytes also reflected the measured alterations in the overall PTP activity (Fig. 10C): stimulation with 100 mM insulin for 5 min reduced the activity of PTP1B in low glucose by 40%, and prior incubation for 24 h in mM glucose followed by stimulation with insulin resulted in a 52% decrease in total PTP activity (p < 0.001).
Effect of high glucose on insulin-stimulated protein phosphorylation in primary rat adipocytes
To determine whether the increase in ROS and reduction in PTP activity in high glucose medium with insulin stimulation in the primary rat adipocytes affected early events in the insulin signaling cascade, we next determined insulin-stimulated tyrosine phosphorylation of the insulin receptor and Ser473 phosphorylation of Akt under these conditions. In contrast to the increased sensitivity to insulin signaling observed in high glucose conditions in the differentiated 3T3- L1 adipocytes (Figs. 4-6), 24-h exposure to high glucose with or without insulin stimulation for 5 min had no effect on tyrosine phosphorylation of the insulin receptor or Ser473 phosphorylation of Akt (Fig. 11). As previous studies have shown that protein kinase C (PKC) may be activated under high glucose conditions and negatively regulate the insulin signaling cascade (18, 21), we tested whether the general PKC inhibitor GF109203X influenced the effect of high glucose on the insulin responsiveness of the primary adipocytes. Treatment of the primary adipocytes with GF109203X (2 μM) during the period of incubation with mM glucose resulted in a 2.4-2.6-fold enhancement (p < 0.001) of insulin-stimulated tyrosine phosphorylation of the insulin receptor and a 2.4-2.7-fold increase (p < 0.001) in Ser473 phosphorylation of Akt stimulated by 10 or 100 nM insulin, respectively, compared with samples incubated in high glucose without the PKC inhibitor (Fig. 11). In further control experiments, cellular treatment with GF109203X had no effect on PTP activity in the rat adipocytes with or without insulin stimulation (data not shown). These results are consistent with our hypothesis that PKC activation overrides the enhancement of insulin signaling by high glucose conditions, which is mediated by increased ROS and reduced activity of cellular PTPs.
FIG. 11.
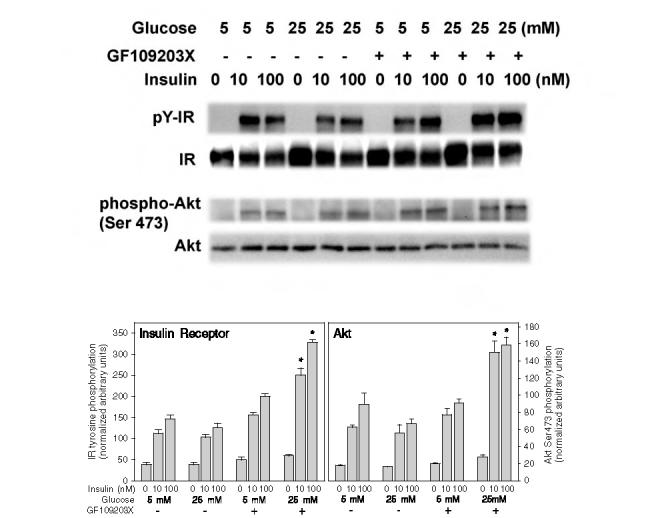
Effect of high glucose on insulin-stimulated tyrosine phosphorylation of the insulin receptor (IR) and Ser473 phosphorylation of Akt in primary rat adipocytes with and without inhibition of PKC. Primary rat adipocytes were incubated under the indicated glucose conditions for 24 h and then acutely stimulated for 5 min with 10 or 100 mM insulin prior to homogenization and western blotting as described in the legend to Fig. 4. The upper blots show the immunoblotting of the tyrosine phosphorylated insulin receptor (pY-IR) using anti-phosphotyrosine 4G10 antibody, the insulin receptor β-subunit (IR), Akt phosphorylated on Ser473 (phospho-Akt), and an Akt protein loading control (Akt). The lower bar graphs reflect the quantitation of the IR tyrosine phosphorylation (left panel) and Akt Ser473 phosphorylation normalized to the protein mass of the IR β-subunit or Akt (right panel). The asterisks indicate significant differences from the corresponding insulin-treated control cells cultured in 5 mM glucose (p < 0.001).
DISCUSSION
We have investigated the effects of increasing the extracellular glucose level on intracellular H2O2 production, PTP activities, and the insulin signaling cascade in differentiated 3T3-L1 adipocytes and primary rat adipocytes. Basal and insulin-stimulated cellular H2O2 levels were increased in the adipocytes cultured in high glucose medium. High glucose conditions reduced the basal endogenous total PTP activity, as well as the activity of PTP1B; the previously reported insulin-stimulated reduction in cellular PTP activity was also enhanced by high glucose conditions. For 3T3-L1 adipocytes, high glucose exposure enhanced the insulin sensitivity of tyrosine phosphorylation of the insulin receptor and IRS-1, and enhanced both the sensitivity and responsiveness of insulin-stimulated activation of Akt. In the primary adipocytes, similar responses were noted, except the effects of high glucose were mitigated by an inhibitory cross-regulation of insulin signaling by cellular PKC activity.
The mechanism of the effect of high glucose conditions on oxidant production likely results from glucose-induced mitochondrial superoxide overproduction (19), as the mitochondrial inhibitors we tested all inhibited the glucose effect to a significant degree in 3T3-L1 adipocytes. Superoxide can then interact with proteins directly, or following its rapid degradation to H2O2 in the cell by superoxide dismutase, H2O2 may be the distal mediator of the oxidant effect on protein function (8, 22). Both 4 h and 8 days of high glucose incubation result in increased H2O2 production. A variety of additional regulators in the cell also appear to contribute to determining the overall magnitude of the oxidant response to glucose, including the cellular level of GSH. We showed that diamide, an oxidant that effectively converts GSH to oxidized glutathione (GSSG), increased the cellular H2O2 content under low and high glucose conditions and enhanced the production of H2O2 in response to insulin stimulation. In vascular smooth muscle cells, the glutathione redox cycle has been shown to play an important role in scavenging superoxide and H2O2 under physiological conditions, and its effectiveness can be modulated by high glucose conditions (23). As DPI also abrogated the increased oxidant signal in response to insulin and high glucose, a flavin-nucleotide-containing oxidase, such as NADPH oxidase, may also be involved in the regulation of this process. These oxidases may be located in cellular membrane fractions, as has been suggested for non-phagocytic homologues of NADPH oxidase (9), as well as in mitochondria (10).
High glucose conditions also decreased the endogenous activity of total cellular PTPs and specifically of PTP1B in both adipose cell types compared with the activities in low glucose medium. This result is consistent with the notion that cellular PTPs are targets of oxidative inhibition because these enzymes require a reduced cysteine thiol group for catalytic enzyme activity (1, 14, 17). The activities of both total cellular PTPs and PTP1B further decreased with insulin stimulation, which increases the oxidant signal under high glucose conditions. Interestingly, these effects also resulted in enhanced insulin-induced insulin receptor and IRS-1 tyrosine phosphorylation, as well as enhanced activation of Akt, a key signaling mediator of insulin action downstream of phosphatidylinositol 3′-kinase. High glucose most likely results in enhanced Akt serine phosphorylation via the effects of H2O2 upstream to activate phosphatidylinositol 3′-kinase, because we have shown previously that H2O2 does not directly alter the catalytic activity of phosphatidylinositol 3′-kinase or Akt (13).
Studies using other cell systems and growth conditions have reported various effects of high glucose conditions on insulin signaling. High glucose exposure in choriocarcinoma cells increased insulin-stimulated tyrosine phosphorylation of its receptor and IRS-1 (2). In contrast, in undifferentiated 3T3-L1 preadipocytes, prolonged high glucose incubation was associated with reduced insulin-stimulated tyrosine phosphorylation of IRS-1 and phosphatidylinositol 3′-kinase association with IRS-1 (5). Prolonged culture of mature adipocytes in high glucose conditions in conjunction with high insulin levels leads to a decrease in insulin sensitivity and responsiveness of 2-deoxyglucose uptake (24). However, in spite of decreased maximal insulin-stimulated receptor tyrosine phosphorylation in the insulin-resistant cells, the insulin receptors showed a diminished extent of tyrosine dephosphorylation in situ, suggesting a complex effect on the receptor tyrosine phosphatase reaction, possibly involving a reduction in cellular PTP activities. Under high glucose culture conditions, various alterations in different cell systems have been reported in the protein level of specific PTPs and in the catalytic activity of certain immunoprecipitated enzymes assayed under reducing conditions (2, 5, 12, 20, 24). These studies, however, apparently did not evaluate the unreduced, endogenous enzyme activity levels assayed under an inert atmosphere as we report in the present work. Clearly, high glucose incubations can lead to complex alterations in cellular responses that are likely to affect both early and distal mechanisms in the insulin action pathway. In addition to altered levels of cellular oxidants that inhibit cellular PTP activity, some of the signaling effects of glucose are likely to result from changes in other signaling systems, including activation of PKC, which has been noted in previous studies to play an inhibitory role in proximal insulin signaling pathways (18, 21).
Our working hypothesis is that the oxidant signal induced by insulin in its metabolic target tissues modulates various aspects of insulin signaling. This involves, at least in part, the oxidative inhibition of thiol-dependent PTP enzymes that regulate the insulin action cascade (13-16). Under conditions of high glucose, the generation of cellular oxidant molecules is enhanced, and this is further potentiated by acute insulin stimulation. We have recently demonstrated that the oxidant signal from insulin modulates a number of cross-regulatory systems in insulin-sensitive cells that are subjected to redox regulation (7, 16). In the present work, we have also found that the overall signaling effect of high glucose is influenced by additional pathways altered under these conditions, including PKC. Modulation of the cellular effects of high glucose on oxidant-sensitive pathways may have important implications for the regulation of proximal insulin signal transduction in the tissues of patients with hyperglycemia due to type 1 or type 2 diabetes mellitus.
ACKNOWLEDGMENTS
This work was supported by NIH grant R01-43396 and a mentor-based fellowship grant to Dr. Goldstein from the American Diabetes Association.
Footnotes
Drs. Wu and Zhu contributed equally to this work.
ABBREVIATIONS
- BSA
- bovine serum albmin
- CCCP
- carbonyl cyanide m-chlorophenylhydrazone
- DCF-DA
- 5,6-chloromethyl-2′,7′-dichlorodihydrofluorescein diacetate
- DMEM
- Dulbecco’s modified Eagle’s medium
- DPI
- diphenyleneiodonium
- ECL
- enhanced chemiluminescence
- GSH
- reduced glutathione
- H2O2
- hydrogen peroxide
- NAC
- N-acetylcysteine
- OHCA
- α-cyano-4-hydroxycinnamic acid
- PKC
- protein kinase C
- pNPP
- para-nitrophenyl phosphate
- PTP
- protein-tyrosine phosphatase
- PVDF
- polyvinylidene difluoride
- RCM
- reduced, carboxamidomethylated, maleylated
- ROS
- reactive oxygen species
- SDS
- sodium dodecyl sulfate
- TTFA
- thenoyltrifluoroacetone
REFERENCES
- 1.Bae YS, Kang SW, Seo MS, Baines IC, Tekle E, Chock PB, Rhee SG. Epidermal growth factor (EGF)-induced generation of hydrogen peroxide. Role in EGF receptor-mediated tyrosine phosphorylation. J Biol Chem. 1997;272:217–221. [PubMed] [Google Scholar]
- 2.Bifulco G, Di Carlo C, Caruso M, Oriente F, Di Spiezio Sardo A, Formisano P, Beguinot F, Nappi C. Glucose regulates insulin mitogenic effect by modulating SHP-2 activation and localization in JAr cells. J Biol Chem. 2002;277:24306–24314. doi: 10.1074/jbc.M202962200. [DOI] [PubMed] [Google Scholar]
- 3.Bradford MM. A rapid and sensitive method for the quantitation of microgram quantities of protein utilizing the principle of protein-dye binding. Anal Biochem. 1976;72:248–254. doi: 10.1006/abio.1976.9999. [DOI] [PubMed] [Google Scholar]
- 4.Brownlee M. Biochemistry and molecular cell biology of diabetic complications. Nature. 2001;414:813–820. doi: 10.1038/414813a. [DOI] [PubMed] [Google Scholar]
- 5.Gagnon A, Sorisky A. The effect of glucose concentration on insulin-induced 3T3-L1 adipose cell differentiation. Obes Res. 1998;6:157–163. doi: 10.1002/j.1550-8528.1998.tb00330.x. [DOI] [PubMed] [Google Scholar]
- 6.Goldstein BJ. Protein-tyrosine phosphatase 1B (PTP1B): a novel therapeutic target for type 2 diabetes mellitus, obesity and related states of insulin resistance. Curr Drug Tar-gets Immune Endocr Metabol Disord. 2001;1:265–275. doi: 10.2174/1568008013341163. [DOI] [PubMed] [Google Scholar]
- 7.Goldstein BJ, Mahadev K, Wu X, Zhu L, Motoshima H.Role of insulin-induced reactive oxygen species in the insulin signaling pathway Antioxid Redox Signal 2005. in press [DOI] [PMC free article] [PubMed] [Google Scholar]
- 8.Kamata H, Hirata H. Redox regulation of cellular signalling. Cell Signal. 1999;11:1–14. doi: 10.1016/s0898-6568(98)00037-0. [DOI] [PubMed] [Google Scholar]
- 9.Lassegue B, Clempus RE. Vascular NAD(P)H oxidases: specific features, expression, and regulation. Am J Physiol Regul Integr Comp Physiol. 2003;285:R277–R297. doi: 10.1152/ajpregu.00758.2002. [DOI] [PubMed] [Google Scholar]
- 10.Li Y, Trush MA. Diphenyleneiodonium, an NAD(P)H oxidase inhibitor, also potently inhibits mitochondrial re-active oxygen species production. Biochem Biophys Res Commun. 1998;253:295–299. doi: 10.1006/bbrc.1998.9729. [DOI] [PubMed] [Google Scholar]
- 11.Lu B, Ennis D, Lai R, Bogdanovic E, Nikolov R, Salamon L, Fantus C, Le Tien H, Fantus IG. Enhanced sensitivity of insulin-resistant adipocytes to vanadate is associated with oxidative stress and decreased reduction of vanadate (+5) to vanadyl (+4) J Biol Chem. 2001;276:35589–35598. doi: 10.1074/jbc.M106783200. [DOI] [PubMed] [Google Scholar]
- 12.Maegawa H, Ide R, Hasegawa M, Ugi S, Egawa K, Iwanishi M, Kikkawa R, Shigeta Y, Kashiwagi A. Thiazoli-dine derivatives ameliorate high glucose-induced insulin resistance via the normalization of protein-tyrosine phosphatase activities. J Biol Chem. 1995;270:7724–7730. doi: 10.1074/jbc.270.13.7724. [DOI] [PubMed] [Google Scholar]
- 13.Mahadev K, Wu X, Zilbering A, Zhu L, Lawrence JTR, Goldstein BJ. Hydrogen peroxide generated during cellular insulin stimulation is integral to activation of the distal insulin signaling cascade in 3T3-L1 adipocytes. J Biol Chem. 2001;276:48662–48669. doi: 10.1074/jbc.M105061200. [DOI] [PubMed] [Google Scholar]
- 14.Mahadev K, Zilbering A, Zhu L, Goldstein BJ. Insulin-stimulated hydrogen peroxide reversibly inhibits protein-tyrosine phosphatase 1B in vivo and enhances the early insulin action cascade. J Biol Chem. 2001;276:21938–21942. doi: 10.1074/jbc.C100109200. [DOI] [PubMed] [Google Scholar]
- 15.Mahadev K, Motoshima H, Wu X, Ruddy JM, Arnold RS, Cheng GJ, Lambeth JD, Goldstein BJ. The NAD(P)H oxidase homolog Nox4 modulates insulin-stimulated generation of H2O2 and plays an integral role in insulin signal transduction. Mol Cell Biol. 2004;24:1844–1854. doi: 10.1128/MCB.24.5.1844-1854.2004. [DOI] [PMC free article] [PubMed] [Google Scholar]
- 16.Mahadev K, Wu X, Motoshima H, Goldstein BJ. Integration of multiple downstream signals determines the net effect of insulin on MAP kinase vs. PI 3′-kinase activation: potential role of insulin-stimulated H2O2. Cell Signal. 2004;16:323–331. doi: 10.1016/j.cellsig.2003.08.002. [DOI] [PubMed] [Google Scholar]
- 17.Meng TC, Fukada T, Tonks NK. Reversible oxidation and inactivation of protein tyrosine phosphatases in vivo. Mol Cell. 2002;9:387–399. doi: 10.1016/s1097-2765(02)00445-8. [DOI] [PubMed] [Google Scholar]
- 18.Motley ED, Kabir SM, Eguchi K, Hicks AL, Gardner CD, Reynolds CM, Frank GD, Eguchi S. Protein kinase C inhibits insulin-induced Akt activation in vascular smooth muscle cells. Cell Mol Biol (Noisy-le-Grand) 2001;47:1059–1062. [PubMed] [Google Scholar]
- 19.Nishikawa T, Edelstein D, Du XL, Yamagishi S, Mat-sumura T, Kaneda Y, Yorek MA, Beebe D, Oates PJ, Hammes HP, Giardino I, Brownlee M. Normalizing mitochondrial superoxide production blocks three path-ways of hyperglycaemic damage. Nature. 2000;404:787–790. doi: 10.1038/35008121. [DOI] [PubMed] [Google Scholar]
- 20.Obata T, Maegawa H, Kashiwagi A, Pillay TS, Kikkawa R. High glucose-induced abnormal epidermal growth factor signaling" growth factor signaling. J Biochem (Tokyo) 1998;123:813–820. doi: 10.1093/oxfordjournals.jbchem.a022009. [DOI] [PubMed] [Google Scholar]
- 21.Pillay TS, Xiao S, Keranen L, Olefsky JM. Regulation of the insulin receptor by protein kinase C isoenzymes: preferential interaction with beta isoenzymes and interaction with the catalytic domain of beta II. Cell Signal. 2004;16:97–104. doi: 10.1016/s0898-6568(03)00090-1. [DOI] [PubMed] [Google Scholar]
- 22.Rhee SG, Chang TS, Bae YS, Lee SR, Kang SW. Cellular regulation by hydrogen peroxide. J Am Soc Nephrol. 2003;14:S211–S215. doi: 10.1097/01.asn.0000077404.45564.7e. [DOI] [PubMed] [Google Scholar]
- 23.Tachi Y, Okuda Y, Bannai C, Bannai S, Shinohara M, Shimpuku H, Yamashita K, Ohura K. Hyperglycemia in diabetic rats reduces the glutathione content in the aortic tissue. Life Sci. 2001;69:1039–1047. doi: 10.1016/s0024-3205(01)01183-3. [DOI] [PubMed] [Google Scholar]
- 24.Tang S, Le Tien H, Goldstein BJ, Shin P, Lai R, Fantus IG. Decreased in situ insulin receptor dephosphorylation in hyperglycemia-induced insulin resistance in rat adipocytes. Diabetes. 2001;50:83–90. doi: 10.2337/diabetes.50.1.83. [DOI] [PubMed] [Google Scholar]
- 25.Wu X, Hardy VE, Joseph JI, Jabbour S, Mahadev K, Zhu L, Goldstein BJ. Protein-tyrosine phosphatase activity in human adipocytes is strongly correlated with insulin-stimulated glucose uptake and is a target of insulin-induced oxidative inhibition. Metabolism. 2003;52:705–712. doi: 10.1016/s0026-0495(03)00065-9. [DOI] [PubMed] [Google Scholar]
- 26.Wu X, Motoshima H, Mahadev K, Stalker TJ, Scalia R, Goldstein BJ. Involvement of AMP-activated protein kinase in glucose uptake stimulated by the globular do-main of adiponectin in primary rat adipocytes. Diabetes. 2003;52:1355–1363. doi: 10.2337/diabetes.52.6.1355. [DOI] [PubMed] [Google Scholar]
- 27.Zhu L, Goldstein BJ. Use of an anaerobic chamber environment for the assay of endogenous cellular protein-tyrosine phosphatase activities. Biol Proced Online. 2002;4:1–9. doi: 10.1251/bpo28. [DOI] [PMC free article] [PubMed] [Google Scholar]
- 28.Zhu L, Zilbering A, Wu X, Mahadev K, Joseph JI, Jabbour S, Deeb W, Goldstein BJ. Use of an anaerobic environment to preserve the endogenous activity of protein-tyrosine phosphatases isolated from intact cells. FASEB J. 2001;15:1637–1639. doi: 10.1096/fj.00-0795fje. [DOI] [PubMed] [Google Scholar]