Abstract
Objective: This article presents some limited results from the Medical Library Association (MLA) Benchmarking Network survey conducted in 2002. Other uses of the data are also presented.
Methods: After several years of development and testing, a Web-based survey opened for data input in December 2001. Three hundred eighty-five MLA members entered data on the size of their institutions and the activities of their libraries. The data from 344 hospital libraries were edited and selected for reporting in aggregate tables and on an interactive site in the Members-Only area of MLANET. The data represent a 16% to 23% return rate and have a 95% confidence level.
Results: Specific questions can be answered using the reports. The data can be used to review internal processes, perform outcomes benchmarking, retest a hypothesis, refute a previous survey findings, or develop library standards. The data can be used to compare to current surveys or look for trends by comparing the data to past surveys.
Conclusions: The impact of this project on MLA will reach into areas of research and advocacy. The data will be useful in the everyday working of small health sciences libraries as well as provide concrete data on the current practices of health sciences libraries.
INTRODUCTION
The need to report the activities of nonacademic health sciences libraries by gathering statistics has been discussed since the early 1980s. Various regional efforts have taken place [1], but the actual measures of activity have not been reported for a national survey since 1972 [2]. The development and implementation of the Medical Library Association (MLA) Benchmarking Network is reviewed in a companion article [3]. This development has now produced the first set of statistical measures of library activity in one class of nonacademic libraries, the hospital library. Efforts of the initiative have expanded to other types of libraries. This paper reports the results of the Benchmarking Network 2002 survey and demonstrates various uses of the data.
BACKGROUND
In an economic climate of managed care and cost cutting in health care, hospital libraries have come under pressure to cut their programs. Some libraries have been eliminated altogether. In 1999, the MLA Board formed the Benchmarking Task Force to develop a way to assist libraries nationwide in gathering comparative statistics. This effort involved many teams and many volunteer hours on the part of MLA members and specific cost outlays in terms of staff and contracts by the association, as reviewed in Dudden [3].
METHODOLOGY
In the summer and fall of 2001 and during the data entry period, all MLA members were asked to submit their data unless their data were included in the Association of Academic Health Sciences Libraries (AAHSL) survey [4, 5]. The Web-based data entry form was open for data collection between December 15, 2001, and March 4, 2002, in the Members-Only section of the MLANET Website. The questionnaire was developed starting in 1999 and beta-tested by seventy-three members during a four-month period in early 2001.
A total of 385 MLA members submitted data via the Web. Participants were from each of the fourteen MLA chapters. Thirteen participants were eliminated because they provided no data in the measures section. Two were eliminated because they were AAHSL libraries. Twenty-six more were excluded because they were not hospital libraries. Eight libraries were from research institutions and 18 from other types of special health sciences libraries. Because these libraries had no bed size or other parameters of size comparable to hospital libraries, the team decided to restrict the analysis to hospital libraries, leaving 344 participants. While there is no definitive source for the number of hospital libraries in the United States and Canada, 3 estimates were located. Wakeley reported 2,167 hospital libraries in 1990, which would mean a 16% return [6]. In 2003, the MLA Hospital Libraries Section (HLS) had 1,388 members, which would present a 25% return [7]. According to data requested from the National Network of Libraries of Medicine in April 2004, 1,929 hospital libraries were full members of the network (DOCLINE participation required) and 982 hospital libraries were affiliate members (no requirement for size or staffing), for a total of 2,911. If the total number were used, the return rate would be 12% for all libraries and 18% for full members [8].
The task force reviewed the submitted data for accuracy. If it was determined that the participant might have misunderstood the question, the librarian was called. If the librarian had not completed the questions about the hospital such as bed size or number of admissions, these numbers were obtained from the latest edition of the American Hospital Association (AHA) Guide to the Health Care Field [9]. Participants were not required to answer every question. After the fact, the task force decided that every record had to have hospital bed size and library full-time equivalents (FTEs). The task force members called those librarians who did not report these numbers. The questions for the Benchmarking Network 2002 survey and the accompanying definitions are provided in Appendixes A and B, available only online <http://www.pubmedcentral.nih.gov/tocrender.fcgi?action=archive&journal=93>. Data on seventy-three measures of activity were collected as well as twelve parameters of size.
No outliers, large or small numbers, were eliminated from the parameters. The measures, however, were edited by eliminating outliers at a natural break. Within the 73 measures, each with a possible number of answers of 344, fewer than 50 numbers were removed. The edited data were finalized and sent to the Outcomes Team by June 2002 for analysis and display of the results as described below in this article.
Development of aggregate tables
Throughout the project, the task force has been asked: “Why do you want to have this data? What is your question?” The response to “why” is to have data available if asked by an administration to prove that the library operations are similar to other libraries of comparable size or to improve services through benchmarking and process improvement. The response to “What is your question?” is that everyone has a different question and the data need to be prepared to answer as many questions as possible.
One such question is: What do librarians do? For instance, “On average, how many monographs does a hospital library circulate?” Of the 242 libraries that answered that question, on average, 1,596 monographs were circulated. Then the problem arises that very large and very small libraries distort the average. One librarian would say, “I have 4 FTEs in my library and I circulate 2,835,” while another might say, “I work in a one-person library and I circulate 471.” The average of all libraries is not that useful when the size of the library varies so much. Tables with parameters of size combined with measures of activity to display the data on the MLANET Members Only Website were developed to take this variation into account. The quartile tables presented in the Survey of Academic and Special Libraries were used as a model but expanded to eight rows with the quartile in the middle [10].
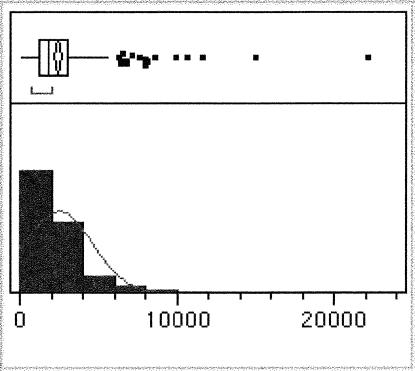
Twelve parameters of size were used for the hospital, training programs, and the hospital library itself. A statistical software program made distributions of the parameters data. Each distribution represented a specific group of numbers. The team needed to determine if the data were distributed as a bell curve or were, at least, distributed symmetrically. As demonstrated in Figures 1 to 3, with so many extreme outliers, distributing the data symmetrically was not possible. The team did not want to exclude any of the participants because they were outliers. The quartile tables became a system of tables divided into eight rows.
Figure 1.
Creating a symmetrical distribution for comparing values for a set of classes; hospital full-time equivalents (FTEs) were used for this demonstration: full distribution
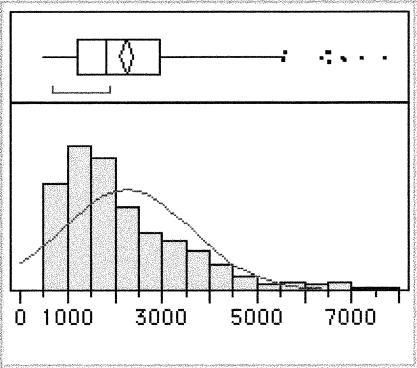
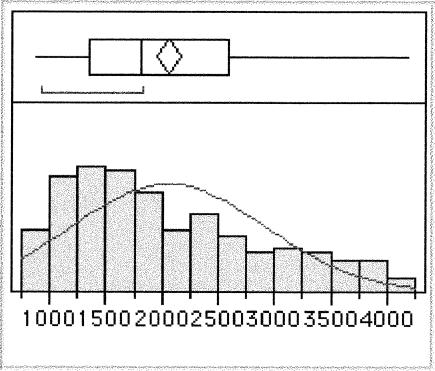
First, the top and bottom 2.5% of the data or the outliers were identified, as demonstrated in Figure 2, and a more symmetrical distribution curve was obtained. Figure 3, with 25% of the outliers eliminated, demonstrates a more symmetrical curve. A third distribution was developed on the remaining numbers, and quartiles were established within the distribution. Tables could then be developed with 8 rows. On the top and bottom rows of the table were the 2.5% extreme outliers. On the next top and bottom rows were the 10% outliers and in the middle were the remaining libraries set in quartiles of approximately 60. This allowed 75% of the respondents to be divided into quartiles that are similar, and the outliers were represented, not eliminated.
Figure 2.
Creating a symmetrical distribution for comparing values for a set of classes; hospital FTEs were used for this demonstration: with 5% eliminated
Figure 3.
Creating a symmetrical distribution for comparing values for a set of classes; hospital FTEs were used for this demonstration: with 25% eliminated
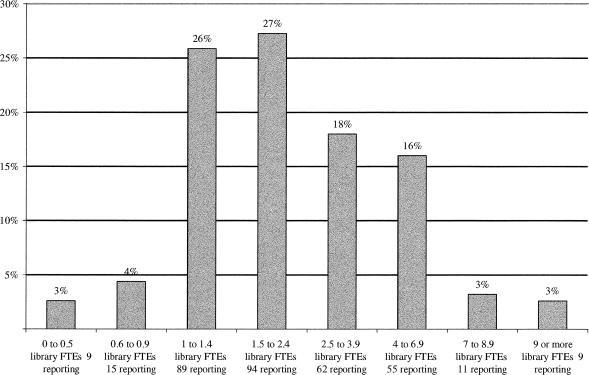
Other distributions were also used. The AHA industry-standard category was modified slightly and used to distribute bed size. Distributions needed to be logical. Distributed quartiles were not logical when using the number of library FTEs as a parameter, because 53% of the respondents had library FTEs between 1 and 2.49. In the data, 80 libraries had exactly 1 FTE and 9 libraries had 1.1 to 1.3. To be able to better analyze the group called a “one-person library,” the team decided to break the tables at 1.4. Figure 4 shows the percentage of participation based on the 8 ranges of library FTE. The figure shows a reasonable distribution, even if not exact, with 25% on the top and bottom and 75% in the middle as described above.
Figure 4.
Percentage of participation in the Benchmarking Network 2002 survey based on the eight ranges of library total FTEs
The 73 measures of library activity, as listed in Appendix A, were reviewed and put into 5 groups: administrative services (financial), administrative services (staffing and other), public services, technical services, and special services. The goal of the Web-based report was to have a table that matched each of the 73 measures with each of the 12 parameters or 876 tables. Each table would show the 8-part distribution and the number of respondents or qualified answers, the mean, median, third quartile, maximum, and minimum. The third quartile, or 75% number, was added following comments from librarians who participated in quality improvement programs, which preferred to measure against the 75% number and not the mean.
Excel macros were developed by an outside firm to produce the tables. Each of the 12 parameters was placed in a distribution. The measures were divided into the 5 groups mentioned above. A library volunteer was trained to produce the tables using the macros. Each group of measures was run against each parameter, producing 60 Excel spreadsheets, each with 6 to 10 measures, for the total of 876 individual tables. The 60 spreadsheets were exported as simple hypertext markup language (HTML) tables and sent to MLA headquarters where the research and information systems group gave them a consistent look and feel for the Website. They were available to all MLA members by September 13, 2002.
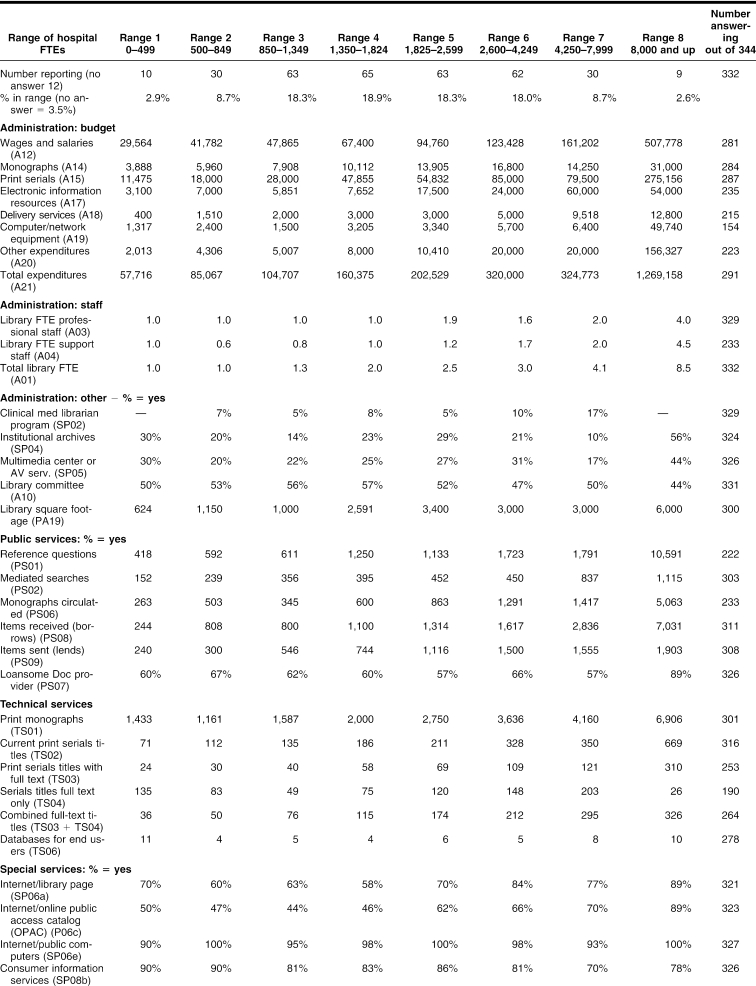
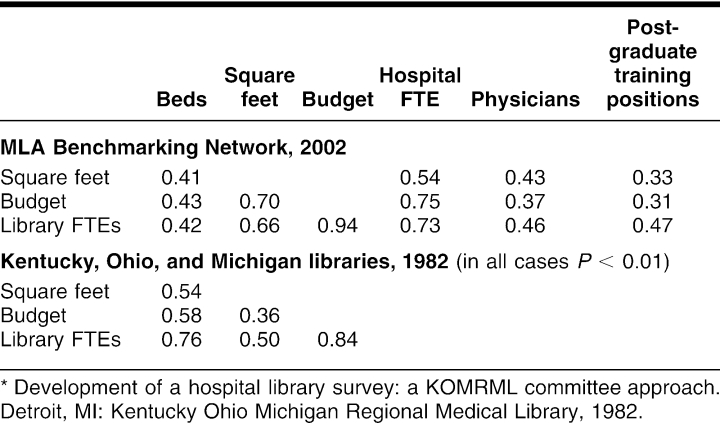
While these tables are still available on MLANET to members at the time of this writing and most likely will be part of the MLA archives, the authors have observed that few of the hospital library surveys done in the past were readily available for use at the time they were done. Of the twelve surveys highlighted in Van Toll's article, “Hospital Library Surveys for Management and Planning: Past and Future Directions,” only five were in easily available publications [1]. The surveys were neither widely known nor easy to find even at the time they were completed. Table 1 represents the median value for most of the survey questions. Due to size restrictions, not all answers are represented, but they are all available on the Web. By publishing these median data in a major publication, the data will be widely available for future researchers. The median number was chosen because wide dispersion between the minimum and maximum can often distort the mean. The hospital total FTE parameter was chosen because there was a significant correlation with measures of library size such as space (0.54), budget (0.75), and staff (0.73) (Table 8). Table 1 reflects the state of hospital libraries in 2001 with data gathered in the Benchmarking Network 2002 survey between December 2001 and March 2002.
Table 1 Aggregate table of various library activity measures (median values) in each of eight ranges of total hospital full-time equivalents (FTEs)
Table 8 Correlation scores among selected survey questions on the Bench marking Network 2002 survey and the Kentucky Ohio Michigan Re gional Medical Library (KOMRML) 1980 survey*
Development of the interactive site
An interactive site where individuals could select parameters and measures and obtain a list of matching libraries for benchmarking use was a major goal of the project. The aggregate tables served as a template for an interactive site. A contract was given to an outside firm, Ego-Systems, and an interactive site was developed by February 2003. All the libraries that participated in the survey have access to the interactive site. Other MLA members can purchase access.
Once on the interactive site, users land on the Benchmarking Network Report Selection page. Here begins a three-step process. In step one, a time period and/ or a geographic area is chosen. In step two, parameters of size are chosen. The library's data are displayed so users can see how they answered the question. Users can choose to use system hospitals only, single hospitals only, or neither or select teaching hospital, nonteaching hospital, or neither. They can choose a range from any of the twelve parameters of size. If they choose too many, most likely they will get no matches. If less than five institutions meet the selected criteria, the institutions are not identified due to privacy of the data. To increase the number of matching institutions, users need to go back to the selection page and choose fewer criteria. Step three allows users to choose the area of measures they want to see: administrative services (financial and other areas), public services, technical services, or special services. The results include a list of institutions that can be used for benchmarking. Appendix A of the companion article describes how to use the list of libraries for benchmarking projects [3].
Sample size
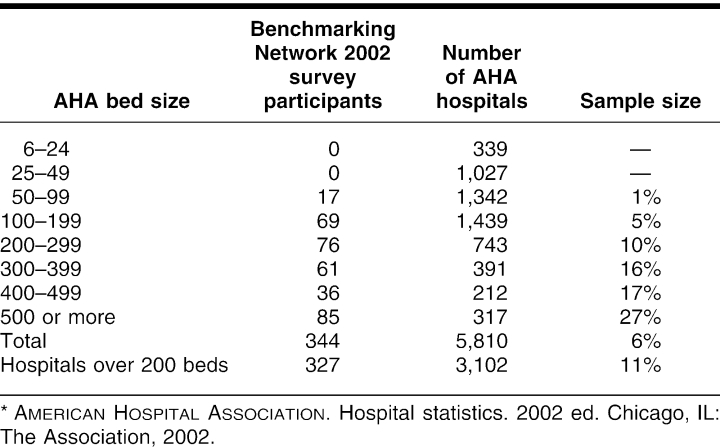
The already reported response rate of 16% to 23% represents a good sample of hospital libraries nationwide. How can the quality of the sample be judged? Table 2 compares the Benchmarking Network 2002 survey participants to the number of AHA hospitals in the bed-size categories the AHA uses, as collected in the 2002 edition of Hospital Statistics [11]. The sample size of large hospitals is well represented, and the smallest hospitals did not participate in the Benchmarking Network 2002 survey. In the 100-to-199-bed category, 69 libraries reported and 1,439 hospitals. This is an approximately 5% sample size (69/1439 = 0.0479) of all hospitals, whether or not the hospital has a library. For hospitals over 200 beds, the sample size was 10% to 27% of the AHA hospitals. This is a more than adequate sample size.
Table 2 Sample size of the Benchmarking Network 2002 survey participants based on American Hospital Association (AHA) bed size categories*
Participants
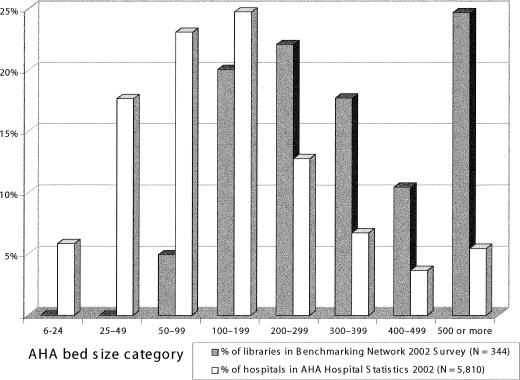
Again using the data from the Benchmarking Network 2002 survey and AHA's Hospital Statistics 2002 [11], the percentage of participants in the survey and the percentage of beds in each AHA bed-size category can be compared, as shown in Figure 5. Using the 8-bed size categories for AHA's 5,810 hospitals, the percentage of hospitals and survey participants in each category was determined. The bed-size category of 100–199 has the strongest match, containing 24.8% of hospitals and 20% of library participants. No libraries reported in the under-50-bed-size hospitals, which made up 23.5% of all hospitals. Hospitals over 300 beds made up 15.8% of all hospitals, whereas in the Benchmarking Network 2002 survey, 53% of participants were in this range.
Figure 5.
Benchmarking Network 2002 survey participants and American Hospital Association (AHA) member hospitals in 2002*: comparison of the percentage of participants and the percentage of beds in each AHA bed size category* American Hospital Association. Hospital statistics. 2002 ed. Chicago, IL: The Association, 2002.
Various uses of the data
The Benchmarking Network 2002 survey data can be used in many ways. The data can be used to answer a specific question, to start an internal review of a library process, to perform traditional benchmarking, and to identify benchmarking partners. The data could also be used to answer specific questions or to test a hypothesis or do research. Other uses could be refuting or updating previous surveys or comparing the data to other surveys, either in the present or from the past.
Answering a question using the reports.
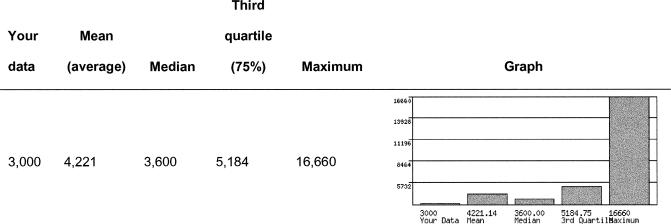
Many times, librarians are asked to provide data by administrators or they just wonder how they compare on a single activity. A sample question might be, “What is the average number of monographs held in various sizes of institutions compared to my institution?” Table 3 and Figure 6 demonstrate the 2 reporting systems of the Benchmarking Network. Table 3 shows an 8-row table from the aggregated tables, and Figure 6 shows a result from the interactive site. Assume a librarian's institution has 565 beds; on the aggregate table, it falls in range 6 (500–749 beds). Forty-nine matching libraries are on the aggregate table and 53 on the interactive site. (The numbers are different between the two reports because two different computer programs were used.) The interactive site also produces a graph. This library holds 3,000 monographs, as seen on the interactive report, and the median number for this group is 3,061 on the aggregate table and 3,600 on the interactive site. The mean is a little higher, 4,221 on both sites, distorted by the outliers. Note that the middle 4 rows of the aggregate table, divided into quartiles, have between 30 and 70 libraries represented. The interactive site also includes a list of the names of the 53 hospitals that matched, which could be used in outcomes benchmarking as described below.
Table 3 Comparison of the Benchmarking Network 2002 survey reporting systems: aggregate table: number of print monographs held for each of 8 ranges for number of staffed beds
Figure 6.
Comparison of the Benchmarking Network 2002 survey reporting systems: output from the interactive site: number of print monographs: 53 hospitals matched criteria of number of staffed beds of 500 to 749
Performing internal process reviews.
The literature on how to do benchmarking has been reviewed by Todd Smith and Markwell [12]. The authors differentiate between classic or “process” benchmarking and “outcomes” benchmarking. While this kind of classic benchmarking and service review goes on, it is not often reported as benchmarking in the literature. A librarian can now use the Benchmarking Network 2002 survey results to improve internal processes by finding benchmarking partners on a national level as described in Appendix A of the companion article [3]. Written by Todd Smith and Markwell, the MLA Benchmarking Network Survey Participant's Guide to Finding Benchmarking Partners lays out a step-by-step process for finding benchmarking partners and starting a process using the interactive site. The team hopes that any libraries doing this will report their experience in the literature.
Performing outcomes benchmarking.
Outcomes benchmarking can be done by libraries participating in the survey as a group and then purchasing and using the data in spreadsheet format to analyze their situation as compared to the whole of the survey or parts of the survey. Two good examples of benchmarking done before the Benchmarking Network 2002 survey demonstrate how the survey would have helped with outcomes benchmarking. Goodwin describes a successful but difficult process, wherein she had to gather all her own statistics and make her own decisions on which data to gather [13]. Harris reports afterward that, like Goodwin, his project lacked clear guidelines from the administration and his imposed timeline was too short [14].
Using the Benchmarking Network 2002 survey, the Northern and Southern California Kaiser Permanente libraries successfully completed such a project. Twenty-six Kaiser libraries participated in the survey as a coordinated group, as reported by Bertolucci and Van Houten at MLA '02 and MLA '03 [15, 16]. The eleven libraries in the Northern California district analyzed the data and presented their finding to the administration. They compared three items from their budgets—books, journals, and staff—to the median benchmarking data for other libraries of like size. They then submitted a request for additional funding, presenting the discrepancy they found between the funding for those budget items for the Kaiser libraries and the median for libraries documented in the benchmarking data as evidence for it. The analysis showed that funding of book and journal expenditures and staff for other libraries, as reported in the benchmarking data, were significantly higher than for these items in the Kaiser library budgets. When requesting a budget increase, the librarians developed scenarios of how additional money would be spent using three different funding levels. The medium scenario, which increased funding by one million dollars for the eleven libraries, was subsequently approved.
Testing hypotheses.
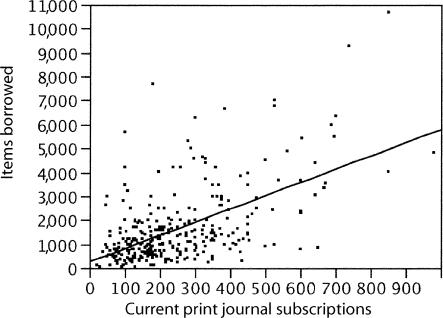
The Benchmarking Network 2002 survey data can be used to retest a hypothesis. A question might be: “How does the number of total print serials compare to the number of interlibrary loans borrowed?” The theory being tested would be that the more serials a library has, the fewer interlibrary loans (ILLs) have to be borrowed, in other words, the number of subscriptions owned is negatively correlated to with the number of items borrowed. In an article by Dudden, this null hypothesis was tested on local data [17]. That study, with 50 libraries in Colorado and Wyoming, showed a marginally positive correlation of 0.29 (P = 0.523). The null hypothesis was contradicted in that study.
As shown in Figure 7, testing the same hypothesis in the Benchmarking Network 2002 survey, with 315 libraries answering the questions, shows a significant positive correlation 0.057 (P < 0.0001). The null hypothesis is again contradicted. These findings were supported by two other studies that showed that purchasing more journal subscriptions did not result in a decrease in ILL borrowing [18, 19]. Based on the results of these three studies and Figure 7 from the Benchmarking Network 2002 survey, it can be suggested that purchasing more journal subscriptions would most likely not significantly decrease ILL requests.
Figure 7.
Correlation between the number of items borrowed and the number of current print journal subscriptions using the MLA Benchmarking Network 2002 survey: borrowed items to current journal subscriptions, significantly positive correlation 0.57 (P < 0.0001)
Testing statements from previous surveys.
The data can also be used to prove statements in previous studies to either be inaccurate or have changed over time. While talking about “highly advanced, highly wired” libraries, a 1999 study refers to “a vast underclass of hospital libraries that have very much fallen behind the times.” The survey of academic and special libraries quoted here surveyed 130 libraries, of which 22 were hospital and other health care libraries [10]. Looking at the Benchmarking Network 2002 survey data to see how “highly wired” the 344 hospital libraries are in 2001, some of the special services questions that related to computer and Internet use in the library were analyzed. Table 4 shows that 99% of the respondents have computer workstations in the library, 57% have online public access catalogs, 71% have library Web pages, and 33% support Web design. On another aggregate table, 264 libraries reported purchasing an average of 232 electronic full-text journals for their users. As stated above, the sample size for hospitals over 200 beds was between 10% to 27% of the AHA hospitals. Based on this larger survey, the authors would challenge the finding of the previous survey and comment that these hospital libraries were remarkably “wired.” They either changed remarkably in two years or the previous authors came to their conclusion with too small a sample.
Table 4 Computer resources and services in hospital libraries reported in the Benchmarking Network 2002 survey
Comparing with other current surveys.
In the future, the Benchmarking Network Editorial Board (BNEB) will attempt to merge the MLA data with comparable AAHSL data. In 2002, the authors were given access to the AAHSL data and found some comparable aggregate numbers. Tables 5 through 7 demonstrate some of these comparisons. It is interesting that the ILL lending activity for the 344 small libraries represented a little more than half as much as the 131 large academic health sciences libraries represented in a AAHSL survey. Other numbers reflected the different collection emphasis of the different types of libraries. As a group, the health sciences libraries represented in the 2 surveys hire personnel and purchase products with a combined expenditure of over $408 million.
Table 5 Comparing the Benchmarking Network 2002 survey with the AAHSL 2002 survey: What is the combined total number of service requests and resources in selected categories?
Another type of question is: “How does the percentage of support staff compare between the two types of libraries?” While the academic libraries do have a larger percentage, it is not as different from hospital libraries as might be assumed. “How does the percentage of total expenditures spent on print serials compare?” Again the percentages are remarkably close when it would seem hospital libraries would not be able to spend as much.
Comparing to past studies.
A major hospital library survey from the past was the 1980 Kentucky Ohio Michigan Regional Medical Library (KOMRML) hospital library survey [20]. In a survey of 596 hospitals in Kentucky, Ohio, and Michigan identified in the AHA Guide to the Health Care Field, 360 questionnaires were returned for a 60% return rate. Of these, 311 libraries reported data, but 49 had no libraries. The survey committee reported 4 correlations using the data they collected. Table 8 compares the KOMRML correlations with correlations from the Benchmarking Network 2002 survey.
In 1980, the number of beds was the standard count for the size of a hospital. So the correlations in the KOMRML survey for bed size were very strong, with more than 0.5 in all cases and 0.76 for library staff. In the Benchmarking Survey, this was no longer true, with 0.41 to 0.43 being the correlations. In 2002, library activity correlated more to hospital FTEs. This is a statistical example of what most people already know. Hospitals now have large outpatient activities and other enterprises that make total FTE a more reasonable number to justify library size than the number of beds. Other interesting changes have taken place, such as the change in the correlation between budget and square footage (0.36 changed to 0.70) and budget and library FTEs (0.84 changed to 0.94). Does this mean libraries have more space? Does this mean salaries are a larger part of the budget than 20 years ago?
Using the survey to develop standards.
These same kinds of correlations were done to assist the MLA Hospital Libraries Section Standards Committee in developing a formula for library staffing in their 2002 standards [21, 22]. The Outcomes Team worked with the HSL Standards Committee in the spring of 2002 to develop these numbers [16]. The formula is “Total institutional full time equivalents (FTE)/700 = minimum library FTE,” where the FTE includes the medical staff. Qualifications fare also provided for extra services provided by the library. In Table 8, total hospital FTE has a more significant correlation than number of beds, physicians, or residents. The index factor of 700 was also developed using the data from the Benchmarking Survey, comparing the total hospital FTE indexed by 700 with the reported staffing in the libraries.
DISCUSSION
As demonstrated in the various analyses above, having data on the activities of nonacademic health sciences libraries provides many avenues for research and advocacy. While it is not expected that hospitals under fifty beds will support a library, increasing the number of hospital library participants in the fifty-to-ninety-nine-bed range will need to be addressed in future surveys. Small research projects internal to the library operation can be accomplished using this comparative data. An educational effort needs to be made so that members can learn to use the data more efficiently for these small research projects or benchmarking. MLA has been offering continuing education courses on benchmarking for the last few years. The team hopes that librarians will report their research and projects in the literature. As outlined in MLA's research policy, Using Scientific Evidence to Improve Information Practice, even these small research projects should be a part of a librarian's self-improvement [23].
If a librarian has a simple question and wants to know what others do in an area, it is possible that the aggregate tables or the interactive site can supply an answer. Outcomes benchmarking can be planned in advance, and the Benchmarking Network can be used to gather data. Many assumptions are made about small health sciences libraries, and these assumptions can now be tested with this data. Surveys from the past can be compared to look for trends. In the future, these trends can be studied with the benchmarking data as more surveys are done. While using numeric guidelines in standards is controversial, developers of standards can certainly use the survey results as a guide to best practices.
CONCLUSION
The various uses of the data presented in this article demonstrate the importance of the MLA Benchmarking Network data to research efforts in medical librarianship. MLA has done survey research into the salaries of medical librarians since 1983 with a program of triennial surveys, the most recent reported by Wallace [24]. AAHSL has done surveys of library activity since 1975. The AAHSL data serve the members “as a highly regarded and essential management tool.” [5] The annual surveys have become part of the culture of AAHSL. The success of this program serves as an example for MLA. The triennial salary survey has become part of MLA's culture. The Benchmarking Network surveys could also become part of MLA's culture. While the diversity of MLA's nonacademic members poses a continuing challenge, a supported program of MLA member surveys has a great potential for research and advocacy and as an individual library management tool.
Table 6 Comparing the Benchmarking Network 2002 survey with the AAHSL 2002 survey: How does the percentage of support staff compare between the two types of libraries?
Table 7 Comparing the Benchmarking Network 2002 survey with the AAHSL 2002 survey: How does the percentage of expenditures on print serials compare between the two types of libraries?
APPENDIX A
Medical Library Association: Benchmarking Network data worksheets for 2002
Institution and library profiles: single library profile worksheet
Time period
PA01. Indicate the year for which you are reporting this data: ______ calendar year ______ fiscal year from: month ______ year ______ to: month ______ year: ______
General hospital information
PA02. Indicate your hospital's ownership status: ______ government ______ investor-owned ______ nongovernment ______ nonprofit ______ other
PA03. Indicate whether your institution is: ______ teaching hospital ______ nonteaching hospital
PA04. Indicate your institution's care category (choose only one): ______ general medical and surgical ______ tertiary care ______ psychiatric or mental health ______ rehabilitation or chronic disease ______ research facility ______ pediatric or other specialty ______ other (please list):
PA05. Total number of physicians in the hospital (please include both full-time physicians employed or appointed by the hospital and any affiliated community physicians): ______
PA06. Total number of hospital (not library) full-time equivalents (FTEs) (exact as known or according to the most recent American Hospital Association [AHA] guide): ______
PA07. Total number of patient discharges annually? ______
PA08. Total number of hospital outpatient visits annually (exact as known or according to the most recent AHA guide)? ______
PA09. Total bed count in the hospital (exact as known or as defined by the most recent AHA guide): ______
PA10. Total number of admissions in your institution annually (exact as known or according to the most recent AHA guide): ______
For teaching hospitals only (nonteaching hospitals continue to question PA17)
PA11. How many postgraduate training position concurrent slots are available in the hospital annually? (e.g., you may have 5 slots with 20 residents rotating through within a year) ______
PA12. How many medical school clerkship slots are available in the institution annually (e.g., there may be 25 slots, but 100 students that rotate through in a year)? ______
PA13. Does your library provide services to any school of nursing students or faculty? ______ yes ______ no
PA14. If yes, how many school of nursing student slots are available annually in the institution(s) your library serves? ______
PA15. Does your library provide services to any school of allied health students or faculty? ______ yes ______ no
PA16. If yes, how many allied health student slots are available annually in the institution(s) your library serves? ______
General library information
PA17. Does your library have a branch location? ______ yes ______ no (If no, skip to question PA19.)
PA18. If yes, will your data for this benchmarking survey (all questionnaires) include branch location data? ______ yes ______ no
PA19. What is the total area of your library, in square feet?
PA20. How many hours per seven-day week is the library open for service?
PA21. Does your library provide twenty-four-hour physical or electronic access to any medical staff? ______ yes ______ no
Institution and library profile: system library profile worksheet
Time period
PB01. Indicate the year for which you are reporting this data: ______ calendar year ______ fiscal year from: month ______ year ______ to: month ______ year: ______
General institution information
Note: For related questions PB03 and PB04 through PB15 and PB16, your answers may be the same for both related questions, depending on your library's status.
PB02. How many hospitals are in the health system? ______
PB03. Indicate your hospital's ownership status: ______ government ______ investor-owned ______ nongovernment ______ nonprofit ______ other
PB04. Indicate whether your institution is: ______ teaching hospital ______ nonteaching hospital
PB05. Indicate your institution's care category (choose only one): ______ general medical and surgical ______ tertiary care ______ psychiatric or mental health ______ rehabilitation or chronic disease ______ research facility ______ pediatric or other specialty ______ other (please list):
PB06. Total number of physicians in the health system (please include both full-time physicians employed or appointed by the system and any affiliated community physicians): ______
PB07. Total number of physicians in the institution(s) your library serves (please include both full-time physicians employed or appointed by the system and any affiliated community physicians for your specific institution): ______
PB08. Total number of health system (not library) FTEs (exact as known or according to the most recent AHA guide): ______
PB09. Total number of FTEs in the institution(s) your library serves (exact as known or according to the most recent AHA guide): ______
PB10. Total number of patient discharges annually in the total health system (exact as known or according to the most recent AHA guide)? ______
PB11. Total number of patient discharges annually in the institution(s) you serve (exact as known or according to the most recent AHA guide)? ______
PB12. Total number of health system outpatient visits annually? ______
PB13. Total number of outpatient visits annually in the institution(s) you serve? ______
PB14. Total bed count throughout the full health system (exact as known or as defined by the most recent AHA guide): ______
PB15. Total bed count in the institution(s) you serve (exact as known or as defined by the most recent AHA guide): ______
PB16. Total number of admissions throughout the full health system annually (exact as known or according to the most recent AHA guide). ______
PB17. Total number of admissions in the institution(s) you serve (exact as known or according to the most recent AHA guide). ______
For teaching hospitals only (nonteaching hospitals continue to question PB26)
PB18. How many postgraduate training position concurrent slots are available in the hospital annually (e.g., the system may have 20 slots with 80 residents rotating through in a year)? ______
PB19. How many postgraduate training position concurrent slots are available annually in the institution(s) your library serves (e.g., you may have 5 slots with 20 residents rotating through within a year)? ______
PB20. How many medical school clerkship slots are available throughout the health system annually (e.g., there may be 75 slots, but 300 students that rotate through within a year)? ______
PB21. How many medical school clerkship slots are available in the institution(s) your library serves (e.g., there may be 25 slots, but 100 students that rotate through them within a year)? ______
PB22. Does your library provide services to any school of nursing students or faculty? ______ yes ______ no
PB23. If yes, how many school of nursing student slots are available annually in the institution(s) your library serves? ______
PB24. Does your library provide services to any school of allied health students or faculty? ______ yes ______ no
PB25. If yes, how many allied health student slots are available annually in the institution(s) your library serves? ______
General library information
PB26. Library services in the health system are: ______ centralized ______ decentralized
PB27. How many libraries are in the health system? ______
PB28. In the system, how many institutions maintain separate listings in the AHA guide? ______
PB29. Does your health system operate under a single state license? ______ yes ______ no
PB30. Does your library configuration serve only a specific population within the system? ______ yes ______ no
PB31. How many hours per seven-day week is your library open for service? ______
PB32. Does your library provide twenty-four-hour physical or electronic access to any medical staff? ______ yes ______ no
PB33. Do any other libraries in the health system provide twenty-four-hour access to any medical staff? ______ yes ______ no
PB34. What is the total square footage of your library? ______
Administration questionnaire worksheet
Library personnel
A01. Indicate the FTEs of all employees in your library: ______
A02. A full-time employee in my institution works: ______ 35 hours per week ______ 37.5 hours per week ______ 40 hours per week ______ other, if other, indicate hours: ______
A03. Indicate the total number of FTE professional staff in your library (includes librarians, archivists, network staff, etc.): ______
A04. Indicate the total number of FTE support staff in your library (do not include student assistants to be counted in question A06): ______
A05. Indicate the total volunteer hours of all volunteers who work in your library (report as hours per month): ______
A06. Indicate the total student assistant hours of all student assistants who work in your library (report as hours per month): ______
A07. In the institution's organization chart, is the library considered a separate department with a distinct budget? ______ yes ______ no
A08. In the institution's organization chart, under what area does the library report? ______ hospital education ______ information systems ______ medical education ______ medical records ______ medical staff/medical director ______ other
A09. What is the title of the person to whom the director of the library reports? ______
A10. Does your institution maintain a library committee? ______ yes ______ no
Library operating expenditures
A11. Please indicate how you would like MLA to handle your financial data (choose only one):
______ I can enter data, and MLA can report it individually or in aggregate.
______ I can enter data, but MLA should only report it in aggregate or within preselected ranges (with other members' data).
______ I cannot report any financial data.
Note: Do not include one-time or capital purchases, such as security systems, in your operating expense figures.
A12. Total expenditures for salaries and wages (exclude fringe benefits) $ ______
A13. Total expenditures for staff development and professional travel: $ ______
A14. Total expenditures for monographs: $ ______
A15. Total expenditures for print serials: $ ______
A16. Total expenditures for audiovisual or media resources: $ ______
A17. Total expenditures for electronic information resources: $ ______
A18. Total expenditures for delivery services: $ ______
A19. Total expenditures for computer or network equipment (approximate, if institution centralizes): $ ______
A20. Report any other operating expenses not listed above: $ ______
A21. Total operating expenses: $ ______
Library income
A22. Does your library receive any financial support from the medical staff in the hospital? ______ yes ______ no (if no, skip to question A24)
A23. If yes, how much (round to the nearest whole dollar amount)? $ ______
A24. Does your library receive any income from fee-based services? ______ yes ______ no (if no, skip to question A26)
A25. If yes, how much (round to the nearest whole dollar amount)? $ ______
A26. Does your library have access to other sources of funding? ______ yes ______ no
Public services questionnaire worksheet
Information services
PS01. Indicate the total number of reference questions received annually: ______
PS02. Indicate the total number of mediated searches performed in your library annually: ______
PS03. If known, how many of those mediated searches were directly related to patient care? ______
PS04. Indicate the total number of educational program sessions offered by your library annually: ______
Resource use
PS05. Indicate the total number of participants annually in educational program sessions offered by your library: ______
PS06. Indicate the total number of monographs circulated from your library annually: ______
PS07. Interlibrary loaning (ILL) or borrowing: indicate whether or not your library is an official Loansome Doc provider: ______ yes ______no
PS08. Indicate the approximate number of items of all types your library borrows or receives from outside sources annually (include ILL and commercial document delivery services): ______
PS09. Indicate the approximate number of items of all types your library lends or sends to outside sources annually: ______
Technical services questionnaire worksheet
TS01. Indicate the total number of print monograph titles in your library's collection: ______
TS02. Indicate the total number of current print serials titles: ______
TS03. Indicate the total number of electronic full-text serials titles that are also received in print format that are accessible from your library: ______
TS04. Indicate the total number of electronic full-text serials titles that are not received in print format that are accessible from your library: ______
TS05. Indicate the total number of electronic full-text monograph software applications in your library that are accessible from your library (i.e., count each individual unique title): ______
TS06. Report the number of externally produced bibliographic databases for which you have purchased access for your users, including purchase through consortial contracts: ______
Special services questionnaire worksheet
Indicate whether or not your library provides these types of photocopying services:
SP01a. mediated photocopying services (library staff performs the service) ______ yes ______ no
SP01b. self-serve photocopying services (library provides the equipment for end users to copy materials) ______ yes ______ no
SP02. Does your hospital or library maintain a clinical medical librarian program? ______ yes ______ no
SP03. If yes, how many FTEs are dedicated to this program? ______
SP04. Does your library maintain your institution's archives? ______ yes ______ no
SP05. Is your library responsible for a multimedia or learning center or institutional audiovisual services? ______ yes ______ no
Indicate whether or not your library provides these Web access services to end users and clients (Internet or intranet):
SP06a. basic Web page ______ yes ______ no
SP06b. interface access to bibliographic databases ______ yes ______ no
SP06c. online public access catalog (OPAC) ______ yes ______ no
SP06d. specific services (e.g., library forms, electronic reference, or ILL) ______ yes ______ no
SP06e. computer workstation(s) for Web access ______ yes ______ no
SP06f. support to institution-wide intranet development ______ yes ______ no
SP06g. support for Website or Web page design ______ yes ______ no
Indicate whether or not your library manages any of the following:
SP07a. allocate portion of library budget to continuing medical education (CME) services: ______ yes ______ no
SP07b. purchase materials that directly relate to CME: ______ yes ______ no
SP07c. regularly schedule CME sessions for physicians ______ yes ______ no
SP07d. record and maintain the institutions' physician CME records ______ yes ______ no
Indicate whether or not your library maintains these consumer health information services:
SP08a. provides services and information to medical staff ______ yes ______ no
SP08b. provide services and information to patients and families ______ yes ______ no
SP08c. provide services and information to the general public ______ yes ______ no
SP08d. maintains a separate consumer health information facility either within or outside the library ______ yes ______ no
SP09. Indicate the number of consumer health reference questions answered annually: ______
Indicate whether or not you offer any of the following as revenue producing services to any part of your clientele:
SP10a. self-service photocopying (e.g., coin-operated machine) ______ yes ______ no
SP10a. mediated photocopying ______ yes ______ no
SP10b. mediated searching ______ yes ______ no
SP10c. ILL services ______ yes ______ no
SP10d. audiovisual equipment circulation ______ yes ______ no
APPENDIX B
Medical Library Association: Benchmarking Network data definitions for 2002
The following definitions cover terms appearing in the various benchmarking questionnaires. The listings below (alphabetical under questionnaire section headings) may be printed and are instantly available while you fill out the questionnaires. Terms are not repeated for each questionnaire; they are defined only once here.
Institution and library profile
24-hour access: The library or hospital provides some means (security guard entry, key-card entry, etc.) to allow staff to enter and use the library at other than normal operational hours.
Allied health (professional): A health professional qualified by training and frequently by licensure to assist, facilitate, or complement the work of physicians, dentists, podiatrists, nurses, pharmacists, and other specialists in the health care system. (JCAHO:11)
AHA: American Hospital Association.
AHA guide: AHA Guide to the Health Care Field, a directory of hospitals, multihospital systems, health-related organizations, and AHA members published annually by Health Forum, a subsidiary of AHA. It includes hospital-specific data, including accreditation information, facilities and services, utilization data, expenses, personnel, etc.
Bed count: The total number of staffed beds regularly maintained by a health care organization for inpatients (JCAHO:24).
Calendar year: The full twelve-month period beginning January 1 and ending December 31.
Fiscal year: Any twelve-month period for which an organization plans the use of its funds.
Full-Time Employee, Full-Time Worker: According to the Bureau of Labor Statistics, a person employed at least thirty-five hours per week.
Full-time equivalent (FTE): A work force equivalent of one individual working full-time for a specific period, which may be made up of several part-time individuals or one full-time individual (JCAHO:97).
Gate count: The number of persons entering or exiting the library during a defined time period.
Health system, health care system: A network of organizations and individuals who provide health services in a defined geographic area. A health system is established, according to AHA, when a single hospital owns, leases, or contract-manages nonhospital, preacute, and/or postacute health-related facilities (for example, wellness services, mental health services, outpatient services, employer health services, long term care), or two or more hospitals are owned, leased, sponsored, or contract managed by a central organization. In the latter case, a single holding company board of directors has the programmatic and fiscal responsibilities to promote the health of the community (JCAHO:112).
Medical school clerkships: Medical students working with patients, usually in their third year.
Open for service: Include only those hours the library is staffed and provides all normal services.
Outpatient: An individual who receives health care services in a clinic, emergency department, or other health care facility without being lodged overnight in that facility as an inpatient (JCAHO:191).
Outpatient visit: A visit by a patient who is not lodged in the hospital while receiving medical, dental, or other services. Each appearance of an outpatient in each unit constitutes one visit regardless of the number of diagnostic and/or therapeutic treatments that a patient receives (JCAHO:191).
[Patient] discharge: The point at which a patient's active involvement with an organization or program is terminated and the organization or program no longer maintains active responsibility for the care of the patient. Types of discharge are discharge by death, discharge by transfer, and discharge to home (JCAHO: 73).
Physician: A doctor of medicine or doctor of osteopathy who—by virtue of education, training, and demonstrated competence—is fully licensed to practice medicine and may be granted clinical privileges by a health care organization to perform specific diagnostic or therapeutic procedures (JCAHO:204).
Postgraduate training position: Include any physician in supervised practice of medicine among patients in a hospital or in its outpatient department with continued instruction in the science and art of medicine by the staff of the facility. Also includes clinical fellows in advanced training in the clinical divisions of medicine, surgery, and other specialty fields preparing for practice in a given specialty. These physicians are engaged primarily in patient care.
School of nursing students: Your library provides services to nursing students who are affiliated with your hospital: associate of arts (AA) program, registered nurse (RN), bachelor of science in nursing (BSN) program, master of science in nursing (MSN), or doctoral level.
Specialty hospital: A hospital that serves a specific population (e.g., children) or provides treatment for specific conditions or diseases (e.g., cancer).
Teaching hospital: A medical school–affiliated or university-owned hospital with accredited programs in medical, allied health, or nursing education. Hospitals that educate nurses and other health personnel but that do not train physicians or that have only programs of continuing education for practicing professionals are not considered to be teaching hospitals (JCAHO:257).
Tertiary hospital: Tertiary hospitals provide highly specialized services for more severe illnesses and conditions. Tertiary hospitals may have specialty units, such as coronary intensive care, trauma or perinatal/ neonatal intensive care units. They are usually teaching hospitals.
Administration
Audiovisual or media resources: Include videotapes, audiotapes, slide sets, microforms, and appropriate equipment. Include any of these resources dedicated to special activities (e.g., CME).
Computer or network expenses: Include expenses for computer networks or their components, new or replacement, for staff or public use. Include costs for hardware maintenance or purchases, integrated library system expenses, cataloging utilities, operating systems, network wiring, network management, general software maintenance or purchase (exclude specific software included in questions A16 and A17), printers, hubs, peripherals, etc.
Delivery services: In this context, include document delivery expenses, public information services such as current awareness services or table of contents distribution, literature alert services, daily news services, copyright clearances, etc. Exclude cataloging utility services.
Electronic information resources: Include electronic versions of journals and monographs, databases, CD-ROMs, software, DVD, and laser disks, as well as any single, health system, or consortial licensing agreements.
Fee-based services: Any library services for which you charge the user a separate fee. Examples include photocopying services, search services, ILLs, fax services, etc.
Medical staff financial: Support your library receives funds from your medical staff on a regular recurring basis, apart from and in addition to hospital funds.
Operating expenses: Monies paid over a period of time to maintain a property, operate a business, or provide services. In this survey, do not include capital expenses for new buildings, furniture, etc.
Other sources of funding: Your library has access to alternate sources of funding (e.g., endowments, grants, donations, etc.).
Part-time employee (PTE): According to the Bureau of Labor Statistics, a person who works less than thirty-five hours per week. Part-time employees usually do not receive the same health insurance, retirement, or other benefits full-time employees receive.
Serials: Serials are publications issued over a period of time, usually on a regular basis (for example, weekly) with some sort of numbering used to identify issues (for example, volumes, issue numbers, dates). A serial, unlike other multivolume publications such as encyclopedias or the complete works of literary authors, does not have a foreseeable end. Examples of serials include popular magazines (Newsweek), scholarly journals (JAMA), electronic journals (The Scientist), and annual reports.
Staff development: For this survey, include all funds expended for staff professional development, including meeting registration fees, lodging expenses, travel expenses, books, or journals that remain the property of the staff member or any tuition reimbursement expenses that come from the library's budget.
Public services
Educational programs: Education service to groups that includes formal instruction in some subject, such as the structure of the literature, techniques of information management, or research methodology appropriate for a discipline. Includes sessions sponsored by the library or given as part of a class in a formal curriculum.
Interlibrary borrowing: Your library borrows materials from other institutions for your users.
Interlibrary loaning: Your library loans materials from your collection to other institutions.
Library orientation: Educational services to individual users or groups designed to introduce new or potential library clients to the facilities, organization, and services of the library (Shedlock).
Mediated literature searches: Your library provides a library staff–mediated search service for your users. Mediated searches usually involve a reference interview with the client to determine appropriate resources and construction of the search. Count a single topic as one search, no matter how many databases were used.
Patient: An individual who receives care or services. Similar terms used by various health care fields. Include client, resident, customer, individual served, patient and family unit, consumer, or health care consumer (JCAHO:195).
Reference question: An information request that requires knowledge, use, recommendations, interpretation, or instruction in the use of one or more information sources by a member of the library staff. Does not include routine direction requests, even though answered at a reference desk.
Technical services
Title: A separate bibliographic whole, whether issued in one or several volumes, reels, disks, slides, or other parts. Titles are defined as in the Anglo-American Cataloguing Rules. A monograph or serial title may be distinguished by its unique International Standard Book or Serial Number (ISBN/ISSN). The term applies equally to print or nonprint materials.
Special services
Clinical medical librarian program: You or your staff perform the function of a clinical librarian by accompanying clinical staff on rounds and providing literature for specific patient charts.
Consumer health information services: Your library provides materials for patient and family health education either to staff for teaching in a formal presentation or in a separate patient education resource center or your library provides information services on an appropriate level to patients and families and/or is open to your community.
Institutional archives: The historical archives for your institution (excluding patient records).
Continuing medical education (CME): Continuing education as it applies to physicians. CME may be gained via formal coursework, medical journals and texts, teaching programs, and self-study courses (JCAHO:55).
Definition sources
The Benchmarking Task Force used the following resources for defining terms. All materials are copyrighted by the respective institutions.
Joint Commission on Accreditation of Healthcare Organizations. Lexicon: dictionary of health care terms, organizations, and acronyms. 2nd ed. Chicago, IL: The Commission, 1998.
Shedlock, J, ed. Annual statistics of medical school libraries in the United States and Canada Survey instrument. Chicago, IL: Association of Academic Health Sciences Libraries: forthcoming.
Association for Library Collections and Technical Services, Serials Section Education Committee. Unraveling the mysteries of serials. [Web document]. Chicago, IL: American Library Association, 1996. [cited 21 Sep 1999]. <http://www.ala.org/alcts/publications/unraveling.html>.
Footnotes
* Based on presentations at MLA '02, the 102nd Annual Meeting of the Medical Library Association; Dallas, TX; 2002; and MLA '03, the 103rd Annual Meeting of the Medical Library Association; Orlando, FL; 2003.
Contributor Information
Rosalind Farnam Dudden, Email: duddenr@njc.org.
Kate Corcoran, Email: corcoran@mlahq.org.
Janice Kaplan, Email: jkaplan@nyam.org.
Jeff Magouirk, Email: magouirkj@njc.org.
Debra C. Rand, Email: drand@lij.edu.
Bernie Todd Smith, Email: btoddsmith32@hotmail.com.
REFERENCES
- Van Toll FA, Calhoun JG. Hospital library surveys for management and planning: past and future directions. Bull Med Libr Assoc. 1985 Jan; 73(1):39–42. [PMC free article] [PubMed] [Google Scholar]
- Miller JD. Health sciences libraries in hospitals. Bull Med Libr Assoc. 1972 Apr; 60(2 suppl):19–28. [PMC free article] [PubMed] [Google Scholar]
- Dudden RF, Corcoran K, Kaplan J, Magouirk J, Rand D, and Todd Smith B. The Medical Library Association Benchmarking Network: development and implementation. J Med Libr Assoc. 2006 Apr; 94(2):107–17. [PMC free article] [PubMed] [Google Scholar]
- Byrd GD, Shedlock J. The Association of Academic Health Sciences Libraries annual statistics: an exploratory twenty-five-year trend analysis. J Med Libr Assoc. 2003 Apr; 91(2):186–202. [PMC free article] [PubMed] [Google Scholar]
- Shedlock J, Byrd GD. The Association of Academic Health Sciences Libraries annual statistics: a thematic history. J Med Libr Assoc. 2003 Apr; 91(2):178–85. [PMC free article] [PubMed] [Google Scholar]
- Wakeley PJ, Foster EC. A survey of health sciences libraries in hospitals: implications for the 1990s. Bull Med Libr Assoc. 1993 Apr; 81(2):123–8. [PMC free article] [PubMed] [Google Scholar]
- Membership Committee, Hospital Libraries Section, Medical Library Association. HLS Membership Committee annual report 2002–2003. [Web document]. 2003. [cited 1 Mar 2005]. <http://hls.mlanet.org/Organization/reports03/membership03.pdf>. [Google Scholar]
- Hamasu C. Personal communication. Salt Lake City, UT: National Network of Libraries of Medicine. Midcontinental Region, Apr 2004. [Google Scholar]
- American Hospital Association. American Hospital Association guide to the health care field. Chicago, IL: The Association, 2001. [Google Scholar]
- Primary Research Group. The survey of academic and special libraries: a new report from Primary Research Group. 2001 ed. New York, NY: Primary Research Group, 2000. [Google Scholar]
- American Hospital Association. Hospital statistics. 2002 ed. Chicago, IL: The Association, 2002. [Google Scholar]
- Todd-Smith B, Markwell LG. The value of hospital library benchmarking: an overview and annotated references, print and Web resources. Med Ref Serv Q. 2002 Fall; 21(3):85–95. [DOI] [PubMed] [Google Scholar]
- Goodwin C. Report on a benchmarking project. Natl Netw. 1999 Oct; 24(2):16–7. [PubMed] [Google Scholar]
- Harris L. Report from down under: results of a benchmarking project. Natl Netw. 2000 Apr; 24(4):8–9. [PubMed] [Google Scholar]
- Fulda PO, Satterthwaite RK. eds. Proceedings, 102d Annual Meeting, Medical Library Association, Inc., Dallas, Texas; May 17–23, 2002. J Med Libr Assoc. 2003 Jan; 91(1):103–36. [PMC free article] [PubMed] [Google Scholar]
- Fulda PO, Satterthwaite RK. eds. Proceedings, 103rd Annual Meeting, Medical Library Association, Inc., San Diego, California; May 2–7, 2003. J Med Libr Assoc. 2004 Jan; 92(1):117–54. [PMC free article] [PubMed] [Google Scholar]
- Dudden RF, Coldren S, Condon JE, Katsh S, Reiter CM, and Roth PL. Interlibrary loan in primary access libraries: challenging the traditional view. Bull Med Libr Assoc. 2000 Oct; 88(4):303–13. [PMC free article] [PubMed] [Google Scholar]
- Costello J, Duffy C.. Academic interlibrary loan in New York state: a statistical analysis. J Interlibrary Loan Inf Supply. 1990;1(2):41–3. [Google Scholar]
- Miller J. Primary clientele as a predictor of interlibrary borrowing: a study of academic health sciences libraries. Bull Med Libr Assoc. 1997 Jan; 85(1):11–5. [PMC free article] [PubMed] [Google Scholar]
- Development of a hospital library survey: a KOMRML Committee approach. Detroit, MI: Kentucky Ohio Michigan Regional Medical Library, 1982. [Google Scholar]
- Gluck JC, Hassig RA, Balogh L, Bandy M, Doyle JD, Kronenfeld MR, Lindner KL, Murray K, Petersen J, and Rand DC. Standards for hospital libraries 2002. J Med Libr Assoc. 2002 Oct; 90(4):465–72. [PMC free article] [PubMed] [Google Scholar]
- Hassig RA, Balogh L, Bandy M, Doyle JD, Gluck JC, Lindner KL, Reich KL, and Varner D. Standards for hospital libraries 2002 with 2004 revisions. J Med Libr Assoc. 2005 Apr; 93(2):282–3. [PMC free article] [PubMed] [Google Scholar]
- Medical Library Association. Using scientific evidence to improve information practice: the research policy statement of the Medical Library Association. [Web document]. Chicago, IL: The Association, 1995. [rev. 15 Dec 2000; cited 15 Jan 2004]. <http://www.mlanet.org/research/science1.html>. [Google Scholar]
- Wallace M, McMullen TD, and Corcoran K. Findings from the most recent Medical Library Association salary survey. J Med Libr Assoc. 2004 Oct; 92(4):465–72. [PMC free article] [PubMed] [Google Scholar]


