Abstract
A method for determining the internal energy of biomolecule ions activated by collisions is demonstrated. The dissociation kinetics of protonated leucine enkephalin and doubly protonated bradykinin were measured using sustained off-resonance irradiation (SORI) collisionally activated dissociation (CAD) in a Fourier transform mass spectrometer. Dissociation rate constants are obtained from these kinetic data. In combination with Arrhenius parameters measured with blackbody infrared radiative dissociation, the “effective” temperatures of these ions are obtained. Effects of excitation voltage and frequency and the ion cell pressure were investigated. With typical SORI–CAD experimental conditions, the effective temperatures of these peptide ions range between 200 and 400 °C. Higher temperatures can be easily obtained for ions that require more internal energy to dissociate. The effective temperatures of both protonated leucine enkephalin and doubly protonated bradykinin measured with the same experimental conditions are similar. Effective temperatures for protonated leucine enkephalin can also be obtained from the branching ratio of the b4 and (M + H − H2O)+ pathways. Values obtained from this method are in good agreement with those obtained from the overall dissociation rate constants. Protonated leucine enkephalin is an excellent “thermometer” ion and should be well suited to establishing effective temperatures of ions activated by other dissociation techniques, such as infrared photodissociation, as well as ionization methods, such as matrix assisted laser desorption/ionization.
Introduction
Fourier transform mass spectrometry (FTMS) has become a powerful tool for the analysis of large biopolymers due to its high mass measuring accuracy (sub ppm),1 sensitivity (subattomole detection possible),2 ultrahigh resolving power (>105 at m/z 1000),3 and extensive capabilities for MSn experiments.4 In combination with electrospray ionization, tandem FTMS has been applied to biomolecules as large as bovine serum albumin (66.8 kDa).5 Many different activation methods have been implemented in FTMS to fragment large biomolecular ions. These methods include collisionally activated dissociation (CAD),6–8 surface-induced dissociation (SID),10–12 infrared multiphoton dissociation (IRMPD) both with a CO2 laser13 and blackbody radiation,14,15 and electron capture dissociation (ECD).16
CAD has been widely used in a variety of mass spectrometers for the structural elucidation of biopolymers. In FTMS, CAD can be implemented with both on6,17–21 and off-resonance methods.8,22,23 With on-resonance CAD, the kinetic energy of an ion is increased using a radio frequency (rf) signal with a frequency equal to the ions’ cyclotron motion. Ions are excited to a radius corresponding to the desired kinetic energy and undergo collisions with a gas, the pressure of which is static18 or pulsed.17 Multiple collisions occur under typical experimental conditions. Additional collisions can increase the energy deposited into the ion. However, each sequential collision that occurs after the rf wave form is turned off has a lower center-of-mass collision energy. This reduces the efficiency of these subsequent collisions. Multiple excitation collisional activation (MECA), in which undissociated precursor ions are repeatedly reexcited after they relax back to the center of the FTMS cell, has the advantage that the fragmentation efficiency can be increased.19,20 This was first demonstrated as a method to improve the efficiency of dissociating peptide ions formed by 252Cf plasma desorption.20 McLafferty and co-workers8 applied MECA to the 11+ charge state of the protein ubiquitin and demonstrated that much higher fragmentation efficiency (80%) could be obtained compared to a conventional on-resonance CAD experiment (fragmentation efficiency <30%). Brauman and co-workers21 demonstrated that repetitive acceleration and deceleration of trapped ions without ejecting them from the cell could be accomplished by periodically phase shifting the resonant excitation wave form 180°. In this very low energy (VLE) CAD experiment, ions undergo multiple collisions with the target gas and the internal energy of the ion is slowly increased.
Off-resonance wave forms can also be used to increase the kinetic energy of ions. With sustained off-resonance irradiation (SORI) CAD, ions are excited with an rf wave form that has a frequency that is typically between ~75 Hz and 4 kHz off-resonance with the cyclotron frequency of the precursor ion.22 This causes the ions to undergo many acceleration/deceleration cycles, as the excitation frequency and the cyclotron frequency of the ions go in and out of phase (the beat frequency). The cyclotron radius (r(t)) of the ions varies sinusoidally as a function of time (eq 1),
| (1) |
where ΔΩ is the beat frequency, which is the difference between the ions cyclotron frequency and the applied excitation frequency, ε is the electric field used for the excitation, and B is the magnetic field strength.22
McLafferty and co-workers8 evaluated MECA, VLE, SORI, and conventional CAD methods for the dissociation of large multiply charged biomolecular ions formed by electrospray ionization and concluded that SORI–CAD is the preferred method due to its high dissociation efficiency, selectivity, and relatively simple implementation. Smith and co-workers9 have demonstrated MS4 of the protein cytochrome c using SORI–CAD. The dissociation spectra varied dramatically for cytochrome c variants that differed by only 3 out of 104 amino acids. Shin and Han24 have demonstrated that the oscillating cyclotron radius of ions excited with SORI can be exploited to radially separate ions of slightly different m/z, leaving only ions of one m/z on axis in the path of the laser light. This allows mass-selective photodissociation without ejecting ions from the cell. Smith and co-workers25 used SORI–CAD to remove noncovalent adducts from biomolecular ions, without significant dissociation of covalent or specific noncovalent interactions. This in-trap “cleanup” simplifies the mass spectra and provides improved mass measuring accuracy for large proteins.
The maximum center-of-mass collision energy in SORI–CAD can be varied as a function of several readily adjusted parameters, including the excitation wave form frequency and amplitude, and the collision gas pressure inside the FTMS cell. The translational energy (Etr) of the excited ions in the SORI experiment is given by
| (2) |
where e is the ion charge, t is the duration of the excitation wave form, and m is the mass of the ion.22
The steady-state kinetic energy distribution of ions activated with a phase-shifting resonant rf signal (VLE, a process similar to SORI excitation) has been modeled by Craig and Brauman.26 The distribution was found to differ significantly from a standard thermal Boltzmann distribution. Beauchamp and co-workers27,28 used SORI–CAD dissociation data in conjunction with RRKM calculations to investigate the dissociation mechanisms of deprotonated peptides, and suggested that the SORI–CAD process could be modeled with the master equation to obtain threshold dissociation energies. However, the internal energy distribution and effective temperature (Teff) of ions activated by SORI has not been well characterized.
Measuring the internal energy distribution of an activated ion population is a difficult challenge. One common approach is to use a “chemical thermometer.”29,30 An ideal thermometer ion fragments by a simple sequence of reactions with well-known activation energies and transition state entropies. From the observed fragmentation, the internal energy distribution of the dissociating ion population can be inferred. A number of thermometer ions have been used, including Fe(CO)5,29–31 methanol,32 and n-butylbenzene.21,33 For example, Brauman and co-workers21 used n-butylbenzene, for which the ratio of fragment ions m/z 91 to 92 as a function of internal energy for dissociation is known,34 to gauge how far above threshold ions are activated with VLE-CAD. Thibault et al.35 have suggested that the ratio of a4 to b4 fragment ions from protonated leucine enkephalin could be used as a measure of the degree of internal excitation. They found that the ratio of the intensities of the a4 to b4 fragments increased linearly with the center-of-mass collision energy with collisional activation in a hybrid mass spectrometer. Vachet and Glish36 investigated the use of heavy gases to improve the efficiency of collisional activation in an ion trap. They used the ratio of a4 to b4 fragment ions from leucine enkephalin to gauge the energy deposition into the ion as a function of different collision gases. Very recently, McLuckey and co-workers37 measured leucine enkephalin dissociation kinetics as a function of resonant excitation amplitude in a quadrupole ion trap to investigate the relationship between excitation amplitude and ion internal energy.
Here, we demonstrate that peptide ions, whose Arrhenius activation parameters have been measured with blackbody infrared radiative dissociation (BIRD), can be used as “thermometer ions,” to quantitatively characterize the internal energy deposited by CAD. The SORI–CAD dissociation kinetics of several peptide ions are measured. In combination with Arrhenius activation parameters measured by BIRD, the effective temperature of the ion population activated by SORI as a function of several different experimental parameters is obtained.
Experimental Section
All peptides were obtained from Sigma (St. Louis, MO) and were used without further purification. Gas-phase ions were generated by electrospray from ~500 μM 50/50 MeOH/H2O solutions. The Fourier transform mass spectrometer used in this work is equipped with a 2.7 T superconducting magnet and an Odyssey Data system (Finnigan-FTMS, Madison, WI). This instrument is described elsewhere.14
A typical sequence used in these experiments is illustrated in Figure 1. A 1 s “quench” delay, in which one of the trapping plates is held at + 9.5 V and the other at −9.5 V, is used to remove any residual ions from the cell at the start of the experiment. The electrospray generated ions are accumulated in the FTMS cell for 3–5 s. Nitrogen gas is introduced through a pulsed valve to enhance ion trapping during the ion accumulation step. The precursor ion of interest was isolated using stored wave form inverse Fourier transform (SWIFT)38 excitation to eject all unwanted ions from the cell. SORI–CAD was performed with a single-frequency low amplitude (0.9–7Vpp) excitation wave form applied 200 to 1200 Hz below the ions measured cyclotron frequency (ωc). Excitation wave forms were monitored with a Tektronix digital oscilloscope (Tektronix Inc., Beaverton, OR). The voltage on the trapping plates was lowered from 6 to 1.5 V during the SORI excite and the detection slice to minimize its effect on the ions’ cyclotron frequency. Nitrogen was used as a collision gas at pressures between 1 and 8.3 × 10⁻⁶ Torr and was introduced for 2 s prior to, during and 1–2 s after the SORI pulse. Cell pressures were measured using an uncalibrated ion gauge. The pressure in the FTMS cell returned to the base pressure of ~5 × 10⁻⁹ Torr after a 5 s delay prior to detection.
Figure 1.
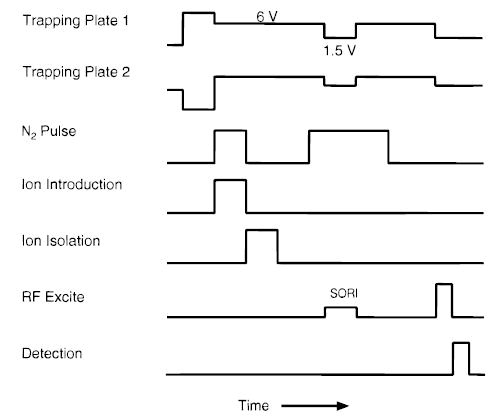
Experimental sequence for SORI–CAD experiments.
Double resonance experiments with SORI excitation were implemented in two ways. In one, a 5 ms 1.5Vpp SORI rf wave form and one or more 10 Vpp double resonance rf wave form-(s) are digitized and summed together. This wave form is saved as a SWIFT wave form and applied to the cell during the SORI reaction delay. Additional 10Vpp rf wave form(s) were applied for 500 ms immediately after this SWIFT to continue ejecting any fragment ions formed after the SORI excite wave form was turned off. The other method was implemented with only single frequency wave forms. A short (5–15 ms) SORI pulse was applied in the typical manner; this pulse was immediately followed by the application of a second single frequency excite (10Vpp) on resonance with one of the fragment ions. This double resonance excite was applied for 10–1000 ms. The same results were obtained with both methods. The latter method was employed more often because it is easier to implement.
The SORI–CAD kinetic data were collected by varying the duration of the single frequency rf excitation wave form. Pseudo-first-order rate constants for dissociation were obtained by performing a standard unweighted linear least-squares analysis to a plot of ln([M+]/([M+] + ∑[F+])) versus the time of the SORI pulse, where M+ and F+ are the precursor and fragment ions, respectively.
Results and Discussion
Dissociation Products and Pathways of Leucine Enkephalin.
The major fragment ions of protonated leucine enkephalin (LE) observed with SORI–CAD (Figure 2) are the same as those observed by other “slow heating” dissociation techniques,39 such as resonant excitation collisional activation in an ion trap mass spectrometer40 and BIRD in FTMS.41 A double resonance experiment was performed to determine which fragment ions are formed directly from the dissociation of LE versus those formed by consecutive reactions under these SORI–CAD conditions. In this experiment, a selected fragment ion is continuously ejected from the FTMS cell as the precursor ion dissociates. A typical SORI–CAD spectrum of LE using a wave form applied for 5 ms 500 Hz below the cyclotron frequency of the ion (maximum kinetic energy eV) at a pressure of 2 × 10⁻⁶ Torr is shown in Figure 2a. The spectrum in Figure 2b was obtained under identical conditions but with an additional rf excitation (Vpp = 10 V) applied on resonance with the b4 ion during the SORI–CAD excite. Because significant dissociation can occur immediately after the SORI excite wave form is turned off (vide infra), the double resonance rf excitation is also continuously applied for an additional 1 s after the SORI excitation. The only fragment ion of significant abundance (>3%) observed is (M + H − H2O)+. When the (M + H − H2O)+ ion is continuously ejected from the cell, the abundances of all the other ions are not affected (Figure 2c). These results indicate that singly protonated LE dissociates to form b4 and (M + H − H2O)+ directly under these experimental conditions. A similar experiment in which the a4 ion was continuously ejected (Figure 2d) resulted in the appearance of only the b4 and (M + H − H2O)+ fragment ions. This indicates that the smaller fragment ions observed in Figure 2a are formed by subsequent dissociation of the a4 ion.
Figure 2.
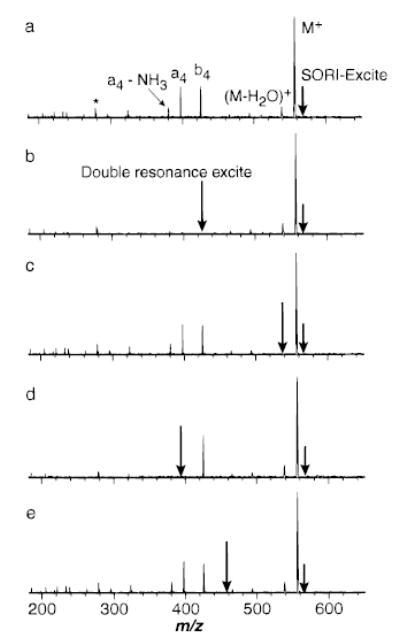
(a) SORI–CAD spectrum of protonated leucine enkephalin with the excitation frequency applied for 10 ms, 500 Hz below the ions cyclotron frequency (2.5 Vpp). Spectra collected under the same conditions as (a) but with an addition excitation (10Vpp) to continuously remove (b) the b4 ion, (c) (M + H − H2O)+, (d) the a4 ion, and (e) m/z 450 (b–e are double resonance experiments). * indicates a harmonic of the precursor ion.
Figure 2e shows a SORI–CAD spectrum measured under identical conditions as Figure 2a but with an additional rf excitation at m/z 450 that is off-resonance with all ions. This SORI spectrum is identical to that obtained without any additional rf excite (Figure 2a), indicating that the continuous rf excite effects only the fragment ions that are on resonance. The excitation wave form used for the double resonance experiment does not significantly perturb any other ions in the FTMS cell.
The dissociation pathways for singly protonated LE deduced from these double resonance experiments are shown in Scheme 1.
SCHEME 1.

These two parallel processes are subsequently referred to as i and ii. These pathways are the same as those observed previously using BIRD.41 Glish and co-workers40 reported slightly different results for CAD in an ion trap; 87% of the a4 ion was formed by subsequent dissociation of the b4 ion, but 13% was formed directly from protonated LE.
SORI–CAD Kinetics.
Collision Frequencies.
With SORI–CAD, multiple low-energy collisions are used to slowly heat an ion. Collision frequencies for LE were calculated by estimating a collision cross section, calculating the velocities of singly protonated LE ions, and determining the average collision frequency over many cycles of SORI excitation. Using ion mobility, Bowers and co-workers42 determined that singly protonated bradykinin (1061 Da) has a globular conformation with a cross section of 245 Å2. A collision cross section of ~150 Å2 for LE (556 Da) was estimated by modeling it as a sphere with half the volume of bradykinin. Using the hard sphere model, the arithmetic average of the cross sectional radii of LE and N2 was used to estimate the mean free path as a function of N2 pressure. The translational energies in the absence of collisions (eq 2) were used to calculate the velocity and collision frequency of ions excited by an off-resonance wave form. Because these parameters are a function of time, the collision frequency was calculated at discrete temporal increments over many acceleration/deceleration cycles and averaged to obtain an average collision frequency for a given set of excitation parameters.
Ion Motion.
Ions that are excited by a slightly off-resonance wave form continuously undergo many acceleration/deceleration cycles. The kinetic energy of the excited ions and their position in the cell is a periodic function of time (eq 2). Thus, the ions’ kinetic energy immediately after the SORI excitation is turned off is a function of the length of the excitation wave form provided that collisions, which can dephase the ions, do not occur during this time. Ions that are left kinetically excited after the SORI wave form is stopped can continue to dissociate before the final excitation/detection step. This effect is illustrated in Figure 3 which shows the abundance of singly protonated LE as a function of the time that the nitrogen gas pulse is extended after the SORI wave form is turned off. The SORI frequency is 200 Hz lower than the cyclotron frequency of the ion. Thus, the ions undergo one complete excitation/deexcitation cycle every 5.0 ms. No dissociation occurs when the SORI wave form is applied for 5.0 ms, even when the nitrogen gas is introduced for an additional 1000 ms after the irradiation step.
Figure 3.
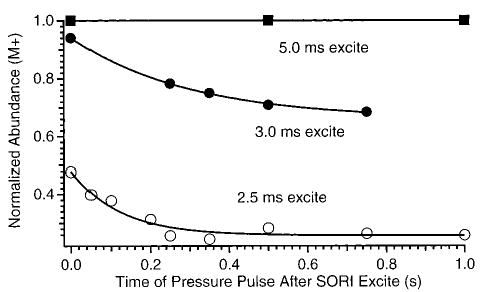
SORI–CAD dissociation data (ΔΩ = 200 Hz, Vpp = 850 mV) as a function of the time that the nitrogen gas pulse is extended after the irradiation of the ions. The three irradiation times leave the ions at their maximum radius (5.0 mm, 2.5 ms), an intermediate radius (4.4 mm, 3.0 ms), and minimum (unexcited) (5.0 ms) radius.
The collision frequency of protonated LE is ~100 s−1 with the experimental conditions used to obtain the data in Figure 3. On average, the ions do not undergo any collisions during the 5.0 ms that the SORI wave form is applied. In addition, the ions are returned to the center of their original orbits at the end of the 5 ms so that they are left with no net kinetic energy. Thus, few if any energetic collisions occur and no dissociation is observed. In contrast, 52% fragmentation occurs when the ions are irradiated with the same SORI wave form under otherwise identical conditions but for only 2.5 ms (Figure 3). The ions are excited for one-half of one complete beat when the SORI wave form is stopped. This leaves the ions in their maximum cyclotron radius (5.0 mm, 7.9 eV of kinetic energy). On average, the ions do not undergo any collisions during the SORI wave form, but collisions can occur after the wave form is turned off but prior to detection. The extent of dissociation increases with the duration of nitrogen pulse gas after the SORI step for times up to ~400 ms (Figure 3). After 400 ms, no additional fragmentation is observed presumable due to the collisions which remove most of the excess kinetic and internal energy. Similar results are obtained when the ions are excited for 3.0 ms. The overall extent of dissociation is less compared with the 2.5 ms wave form, because the ions have a smaller kinetic energy (7.1 eV) when the wave form is stopped at 3.0 ms.
Five single scan (no averaging) SORI–CAD spectra of LE with a 200 Hz off-resonance wave form applied for 2.5 ms (no additional pulse gas after excite) had an average fragmentation efficiency of 47 ± 7%. When the pulse gas is left on for an additional 1 s after the SORI wave form, the fragmentation efficiency was 74 ± 1%. The lower reproducibility of the spectra when the pulse valve and SORI excite are turned off simultaneously is presumably due to variations in the pressure in the main vacuum chamber after the pulse valve is turned off and the chamber pumps out. Maintaining a constant pressure in the FTMS cell as the ions collisionally cool after the SORI wave form (Figure 1) improves the reproducibility of the experiment. All SORI–CAD kinetics described subsequently are obtained in this manner.
Beat Frequency.
Figure 4 shows the normalized abundance of singly protonated LE as a function of irradiation time for a 75.27 kHz excitation wave form (ΔΩ = 250 Hz, eV). At short irradiation times (<20 ms), the normalized abundance of singly protonated LE is sinusoidal as a function of time. The frequency of this oscillation is 250 Hz which corresponds to the beat frequency between the SORI wave form and the ions’ cyclotron frequency. This sinusoidal behavior at short irradiation times is due to a coherent packet of ions being left with different kinetic energies when the excitation wave form is stopped as discussed in the preceding section. It is interesting to note that the “tops” of the sine wave are relatively flat. This is most likely due to the necessity for ions to be excited above a certain threshold kinetic energy before dissociation is observed.
Figure 4.
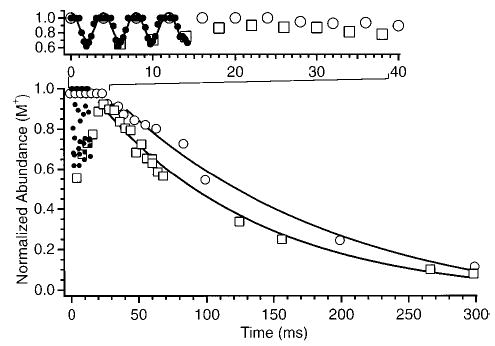
Normalized precursor ion abundance of protonated leucine enkephalin as a function of SORI excitation time. The open squares and open circles represent data points sampled at times in which the excitation wave form is stopped exactly when the irradiated ions have a maximum and minimum cyclotron radius, respectively.
In the absence of collisions, the ions are repeatedly accelerated to a maximum kinetic energy (eq 2) as a coherent packet. With collisions, this initially coherent ion packet will dephase with time. This behavior for SORI excitation is similar to that reported by Craig and Brauman26 for ions accelerated by phase-shifting a resonant rf signal. With the conditions used to obtain the Figure 4 data, the average collision frequency is ~230 s−1. On average, one collision occurs every 4.4 ms or once during a beat cycle. At short irradiation times, the majority of dissociation occurs after the excitation wave form is turned off. As the number of beats increases, the amplitude of the oscillation decreases (Figure 4). This damping of the oscillations with increased irradiation time was also observed by Shin and Han.24 This damping is due to the dephasing of the ion packet.
Rate Constants.
The effects of the beat frequency observed at short times complicate the extraction of accurate kinetic data at these short times. However, the data at longer times can be readily fit to pseudo-first-order kinetics. This is illustrated in Figure 4, which shows data points obtained at times corresponding to when the SORI wave form is stopped exactly when the irradiated ions have a maximum (open squares) and a minimum (open circles) cyclotron radius. The dissociation rate constant is obtained from the slope of the natural log plot of these kinetic data at long times where the sinusoidal behavior is no longer apparent. The natural log of these data fit a straight line at long times (≥35 ms under these experimental conditions). For the Figure 4 data, the rate constants corresponding to the ions “parked” at their maximum and minimum radius after the SORI wave form is turned off are 10.0 and 9.4 s−1, respectively. This indicates that the ions have reached a steady-state internal energy distribution and that the majority of the dissociation occurs during the SORI wave form for these relatively long excitation times.
Effective Temperature.
A measure of the internal energy deposited into ions activated by SORI–CAD can be obtained by comparing the SORI–CAD kinetics to those measured by BIRD at a given temperature. Figure 5a shows a plot of ln-{[M+]/([M+] + ∑[F+])} versus time for LE dissociated by BIRD (203 °C) and SORI–CAD (ΔΩ = 1200 Hz, eV). The dissociation kinetics obtained for both activation methods are nearly the same (kSORI = 0.092 s−1, kBIRD = 0.088 s−1) under these experimental conditions. Mass spectra from these kinetic data for both SORI–CAD and BIRD at a reaction delay of 5 s are shown in Figure 6a and b. The fragmentation efficiencies (∑ [F+]/(∑[F+] + [M+])) are 38.6% and 39.4%, for dissociation by SORI–CAD and BIRD, respectively. Under these gentle SORI–CAD conditions, once the b4 ion is formed from the parent, it does not have sufficient internal or kinetic energy to undergo subsequent dissociation. At higher excitation amplitudes, additional fragment ions are formed by subsequent dissociation of the b4 ion (Figure 6c). In the BIRD experiment, the fragment ions remain in the heated FTMS cell for the entire duration of the experiment. These fragment ions are further activated by black body photons and can continue to dissociate. As illustrated by the double resonance experiments, however, the dissociation pathways for LE are identical with both of these activation methods. Thus, the dissociation kinetics for both of these activation techniques are directly comparable.
Figure 5.
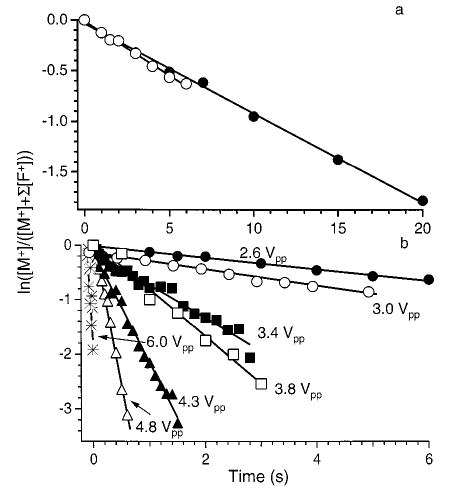
Dissociation data for protonated leucine enkephalin fit to unimolecular kinetics. (a) Blackbody infrared radiative dissociation kinetics obtained with a cell temperature of 203 °C (○) and SORI–CAD kinetics with an excitation 1200 Hz below the ions cyclotron frequency (2.6 Vpp) (•); (b) SORI–CAD kinetics collected at different excitation voltages (ΔΩ = 1200 Hz, cell pressure = 2.6 × 10⁻⁶ Torr).
Figure 6.
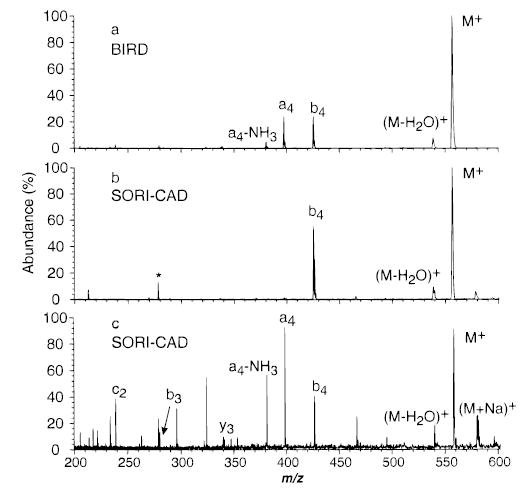
Dissociation spectra of protonated leucine enkephalin with (a) BIRD (5 s reaction, 203 °C), and (b) SORI–CAD (ΔΩ = 1200 Hz) with a 2.6Vpp wave form applied for 5 s, and (c) 6.0 Vpp wave form, applied for 10 ms. * indicates a harmonic of the precursor ion.
The primary dissociation products of doubly charged bradykinin (BK) with both SORI–CAD and BIRD are the b2/y7 complementary ions as well as loss of water (Figure 7). The ratio of loss of water to b2/y7 formation is 0.36 and 0.10 for SORI–CAD and BIRD, respectively. Although the major fragments for both activation method are the b2/y7 ions, the different branching ratios will introduce some error to the extracted effective temperature. The fragments observed for dissociation of BK2+ with SORI–CAD under these experimental conditions are slightly different than those reported by Heck and Derrick.23 With their higher energy collisions ( eV), loss of water and formation of the b1/y8 were the primary fragments observed; the combined intensity of the b2 and y7 ions was 40% that of the (M + 2H − H2O)2+ ion.
Figure 7.
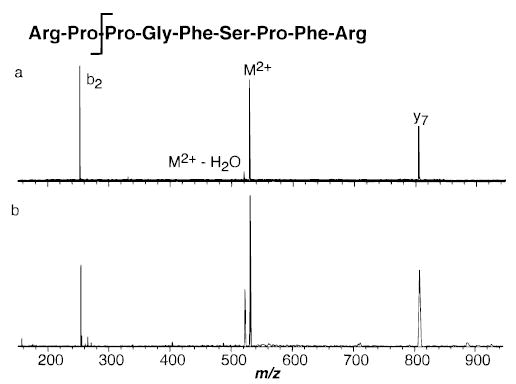
Spectra of doubly protonated bradykinin dissociated by (a) BIRD (30 s reaction delay, 150 °C), and (b) SORI–CAD (0.5 s reaction delay, ΔΩ = 1200 Hz).
Under the BIRD conditions employed, the dissociation of both LE and BK occurs in the rapid energy exchange (REX) limit.41,43 In this limit, the rates of energy transfer in to and out of the ion far exceed the unimolecular dissociation rate and the ions equilibrate with the blackbody radiation field. In the REX limit, the internal energy of the ion population is given by a Boltzmann distribution and the ion internal energy can be described by a temperature. In the SORI–CAD experiment, the internal energy distribution is not well characterized. Under a given set of SORI–CAD conditions, the ion population reaches a steady-state energy distribution and dissociates with a pseudo-first-order rate constant, kSORI. Using the standard definition of “effective temperature,”44 Teff of the SORI–CAD ion population is given by eq 3:
| (3) |
where Ea and A are the REX limit Arrhenius activation energies and frequency factors, respectively, and kthermal is the unimolecular rate constant for the dissociation of a Boltzmann population of the ions at temperature Tthermal. The measured overall Arrhenius activation energies and frequency factors for the dissociation of LE41 and BK43 are given in Table 1. As defined, the Teff of ions dissociated by SORI–CAD is equal to Tthermal when kSORI = kthermal. For example, the rate constant for dissociation of LE ions activated by SORI–CAD using a 1200 Hz off-resonance excite with a eV (Figure 5a) is essentially equal to the rate constant of a thermal population measured with BIRD at 203 °C (Figure 5a). Thus, the Teff of the LE ions activated by SORI–CAD under these conditions is 203 °C. It should be emphasized that Teff does not imply that the ions activated by SORI–CAD have a Boltzmann internal (or kinetic) energy distribution.
TABLE 1.
Measured Arrhenius Activation Parameters for the Dissociation of Singly Protonated Leucine Enkephalina and Doubly Protonated Bradykininb
| peptide | activation energy (eV) | log(A) |
|---|---|---|
| bradykinin 2+ | 0.84 | 8.0 |
| leucine enkephalin 1+ (overall) | 1.09 | 10.5 |
| 0.99 | 8.7 | |
| 1.11 | 10.7 |
The maximum center-of-mass collision energy with SORI–CAD can be varied by changing either the frequency difference (ΔΩ) between the cyclotron and irradiation frequency or the amplitude of the excitation wave form. The dissociation kinetics are also significantly affected by the collision gas pressure inside the cell. The effect of these parameters on the effective temperatures of the excited ions is discussed in the following sections.
Effect of Excitation Amplitude.
Plots of ln([M+]/([M+] + ∑[F+])) versus time for SORI–CAD dissociation data of singly protonated LE with a frequency 1200 Hz off-resonance, a cell pressure of 2.6 × 10⁻⁶ Torr, and maximum kinetic energies ranging from 2.2 to 11.0 eV are shown in Figure 5b. These data were obtained with relatively long excitation times (up to 6000 ms) so that the beat frequency did not interfere with obtaining a rate constant, as discussed above. These data are linear at all times and have zero y-intercepts, indicating that the internal energy of these ions has reached a steady state. When is 2.2 eV, the only fragments observed are the b4 and (M + H − H2O)+ ions (Figure 6b). When is increased to 11 eV, additional fragment ions appear (Figure 6c). At higher collision energies, the b4 ion can be formed with sufficient internal and/or kinetic energy to undergo subsequent dissociation. Double resonance experiments confirmed that additional fragments seen in these spectra were formed from subsequent dissociation of the b4 ion.
The effective temperature of LE and doubly charged BK ions are obtained from eq 3 using the measured SORI–CAD dissociation rate constants (Figure 5b for LE) and the overall Arrhenius activation parameters measured using BIRD (Table 1). These effective temperatures are shown in Figure 8 as a function of the excitation amplitude. The effective ion temperature for both LE and BK ranges from ~203 to 318 °C when Vpp is changed from 2.6 to 6.0 V. The effective temperatures obtained for both singly charged leucine enkephalin and doubly charged bradykinin are similar even though for a given excitation amplitude and offset frequency differs slightly for these two ions due to their slightly different m/z.
Figure 8.
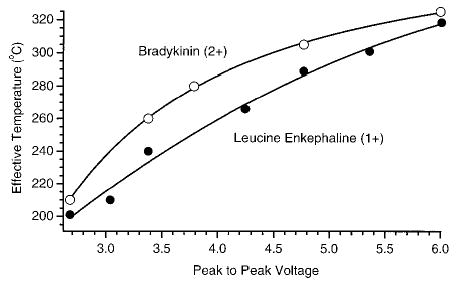
The effective temperature of singly protonated leucine enkephalin and doubly protonated bradykinin ions as a function of the excitation amplitude with ΔΩ = 1200 Hz and a cell pressure of 3 × 10⁻⁶ Torr.
Effect of Excitation Frequency.
With SORI–CAD, the excitation frequency can also be used to control the maximum kinetic energy of the irradiated ions. Figure 9 shows the effective temperature of LE and BK ions as a function of the excitation frequency with other experimental parameters held constant (Vpp = 3 V; cell pressure = 2.6 × 10⁻⁶ Torr). The effective temperature of both ions increases linearly with the excitation frequency over this range. It is interesting to note that the linear relationship between the effective temperature and the excitation frequency versus the more complicated relationship with the excitation amplitude is consistent with previous observations that changing excitation frequency provides better control of the collision energy than does changing the excitation voltage.45 Again, the effective temperature of both singly charged LE and doubly charged BK are similar.
Figure 9.
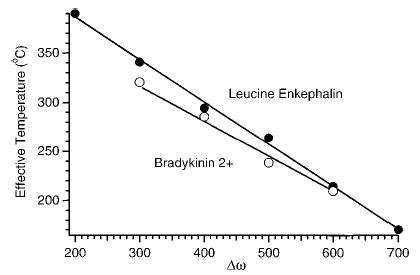
Effective temperature of singly protonated leucine enkephalin and doubly protonated bradykinin ions as a function of the excitation frequency with Vpp = 3 V and a cell pressure of 3 × 10⁻⁶ Torr.
Effect of Collision Gas Pressure.
The extent to which ions are excited is also influenced by the collision gas pressure in the FTMS cell. Figure 10 shows the effective temperature of LE as a function of the pressure of nitrogen gas pulsed into the FTMS cell ( eV; ΔΩ = 500 Hz). As the collision gas pressure is increased, Teff increases and then plateaus. Ions undergo more collisions with increasing pressure and are activated to a higher effective temperature. Under these experimental conditions, the collision frequency is ~100 and 700 s−1, at 1.2 × 10⁻⁶ and 8.3 × 10⁻⁶ Torr, respectively. This corresponds to an average time between collisions of 10 ms and 1.4 ms, respectively. One complete beat cycle occurs every 2 ms. When a collision occurs only once every several beat cycles, the damping of the average maximum kinetic energy is expected to be minor. After a collision, the individual ion “rephases” with the applied wave form and will again reach its original maximum kinetic energy (eq 2). As the collision frequency approaches the beat frequency, damping of the maximum kinetic energy of the ions will be more significant. The extent of energy deposited plateaus as the collisional dampening takes effect, leading to a plateau in Teff. (Figure 10). Over a pressure range of 1.2–8.3 × 10⁻⁶ Torr, Teff varies by ~100 °C. Thus, it is critical to precisely control the pressure in order to obtain accurate kinetics with SORI excitation. However, dissociation kinetics are more reproducible at higher pressures, since variations in the pressure have a smaller influence on the effective temperature of the ions.
Figure 10.
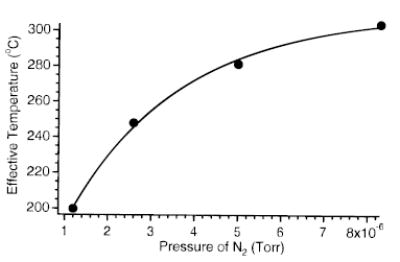
Effective temperature of protonated leucine enkephalin as a function of collision gas pressure during the SORI excite (ΔΩ = 1200 Hz, Vpp = 1.1 V).
Branching Ratios of LE Fragment Ions.
The effective temperatures in Figures 8–10 are obtained using average Arrhenius parameters for the dissociation of LE and BK measured by BIRD. For LE, however, the branching ratio between processes i:ii, determined from the ratio of (M + H − H2O)+ to the sum of all other fragments, has a small temperature dependence. From this temperature dependence, individual Arrhenius parameters for these two parallel processes can be obtained.41 This branching ratio can be expressed as
| (4) |
where kb4 and k−H2O are the rate constants for formation of b4 and (M + H − H2O)+, respectively, and Ab4, A−H2O, and are the Arrhenius parameters for the formation of each individual fragment ion measured previously by BIRD (Table 1). Obtaining Arrhenius parameters in this manner is analogous to the kinetic method in which thermochemical properties are extracted from rates of competitive dissociation of cluster ions.46
Figure 11 shows the branching ratio of process i:ii for each SORI–CAD kinetic data set in Figure 5 as a function of Teff. This ratio is averaged over all reaction times. The error bars in the figure are the standard deviations of the data used to determine the averages. In general, the branching ratio i:ii increases with Teff, as expected from the measured Arrhenius parameters for these two processes. The solid line in Figure 11 is the calculated branching ratio of processes i:ii from the individual Arrhenius parameters for each process (eq 4), over the temperature range 203 to 318 °C. The experimental branching ratio of the SORI–CAD data and the calculated branching ratio from the BIRD data are in reasonable agreement.
Figure 11.
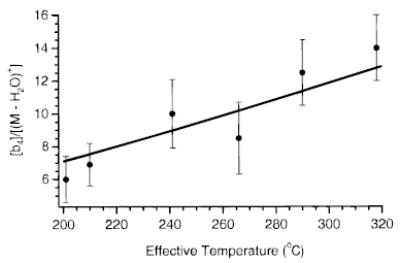
Branching ratio of process i:ii (see text) for each SORI–CAD kinetic data set in Figure 5 as a function of Teff. The solid line is the calculated branching ratio from the individual Arrhenius parameters for each process.
This agreement indicates that the effective temperature can be obtained directly from the branching ratio i:ii. This measure of Teff is independent of the method of extracting effective temperatures from the overall dissociation kinetics. However, because of the relatively large error in measuring this ratio (Figure 11), extracting Teff from the overall dissociation kinetics is preferable. This will be true in general when there is not a strong temperature dependence to the relative fragment abundances as is the case for LE. For ions in which the temperature dependence of a branching ratio is significant, using the branching ratio to obtain Teff may be preferable. This analysis was not performed for the doubly charged bradykinin ions since individual Arrhenius parameters for the two processes were not measured.
It has been proposed that the ratio of a4 to b4 fragment ions from leucine enkephalin can be used as a measure of the peptides’ internal energy.35,36 However, the a4 ion is a dissociation product of the b4 ion and is not formed directly from LE in significant abundance. The ratio of a4 to b4 can depend on factors other than the internal energy of the precursor ion. If fragment ions are activated once they are formed, then the abundance ratios will not necessarily be a reliable indicator of the precursor internal energy. For example, the LE ions in Figure 6a and b were activated to the same effective temperature with SORI–CAD and BIRD. However, the ratios of [b4]/[a4] in these spectra are 30 and 1, respectively. Similar results are expected from IRMPD or from CAD under conditions where the fragment ions are formed with sufficient kinetic energy that further collisions result in subsequent dissociation. The ratio of process i and ii or the overall dissociation kinetics provides a significantly better measure of the ions’ internal energy.
Effective Temperature Parameter Space.
As demonstrated, the SORI–CAD kinetics are strongly affected by the excitation wave form amplitude and frequency, as well as the cell pressure. Measuring the effective temperature as a function of all three parameters is not practical. However, it is useful to combine the results obtained from the investigation of the effects of excitation amplitude and frequency. Figures 8 and 9 represent two slices of the Teff parameter space as a function of these SORI–CAD parameters. By combining the results in these two figures, Teff as a function of peak-to-peak voltage and frequency can be calculated for any permutations of these parameters. Figure 12 shows a contour plot of the effective temperature of the ion population as a function of both excitation voltage and frequency at a pressure of 2.6 × 10⁻⁶ Torr. With conditions typically used in SORI–CAD experiments, the effective temperature of protonated leucine enkephalin can range from room temperature to approximately 400 °C. LE dissociates with a rate constant of 160 s−1 at an effective temperature of 380 °C and only about 6% of the precursor remains after ~15 ms. At shorter excitation times, the beat frequency obfuscates the measurement of the dissociation kinetics. Therefore, experimental conditions that heat this ion above ~400 °C were not investigated. Kinetics at effective temperatures greater than 400 °C could be measured for ions that have greater thermal stability. Many sodium attached peptides ions would be well suited to this application.14
Figure 12.
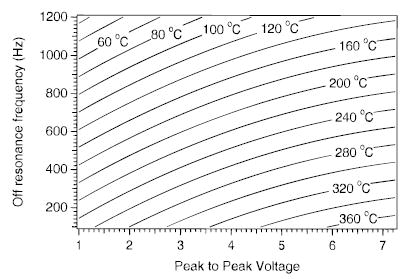
Calculated contour plot of the effective temperature of protonated leucine enkephalin as a function of excitation frequency and voltage at a collision gas pressure of 2.6 × 10⁻⁶ Torr. The data were obtained by combining and extrapolating the data shown in Figures 8 and 9.
Conclusions
A method to quantitatively determine the internal energy of activated biomolecule ions is presented. This method is demonstrated with two peptides in order to obtain the effective temperature of ions activated by SORI–CAD. SORI–CAD kinetics are measured as a function of excitation frequency, voltage, and ion cell pressure. Dissociation rate constants are obtained from these kinetic data taken immediately after the ion population dephases and reaches a steady-state internal energy distribution. The effective internal temperature of the ions is determined from the SORI–CAD rate constants and from the Arrhenius activation parameters measured by BIRD in the rapid energy exchange limit. With typical SORI–CAD experimental conditions, the effective temperature of the activated ions in this study can range from room temperature to about 400 °C. At higher effective temperature, dissociation of doubly protonated bradykinin and singly protonated leucine enkephalin occurs too quickly to measure rate constants accurately. Ions that are more thermally stable could be used as thermometer ions at these higher temperatures.
The effective temperatures of both protonated leucine enkephalin and doubly protonated bradykinin dissociated under the same SORI–CAD conditions are similar. Thus, it may be possible to develop an empirical formula for the effective temperature of SORI activated ions as a function of mass and all variable experimental parameters, such as the SORI frequency and voltage, and cell pressure.
Protonated leucine enkephalin dissociates by two competitive pathways that have slightly different Arrhenius parameters. The branching ratio of the fragment ions formed by these two pathways changes as a function of temperature and can also be used to obtain the effective temperature of the ions. Effective temperatures determined from this branching ratio are in good agreement with those obtained from the absolute kinetics. These two methods for determining effective temperatures make protonated leucine enkephalin an excellent “thermometer” ion in this range of temperatures. Although the ratio [b4]/[a4] has been used previously to estimate internal energy deposition,35 this ratio is not necessarily a reliable indicator of the precursor ion internal energy.
While demonstrated for SORI–CAD, this method should be equally useful for quantitatively characterizing the effective temperature of ions activated by other methods, such as IRMPD. This method could also be used to determine the internal energy deposited into ions from ionization methods, such as matrix assisted laser desorption/ionization, and could be used to quantitatively measure the effects of various parameters, such as different matrixes, on the ion internal energy. Measured effective temperatures should also be invaluable for calculations that model the internal energy deposited into ions via various activation or ionization methods.
Acknowledgments
The authors would like to acknowledge helpful discussions with Mr. Eric Strittmatter and Ms. Rebecca Jockusch. This research would not have been possible if not for the generous financial support provided by the National Science Foundation (Grant CHE-9726183), National Institutes of Health (Grant 1R29GM50336-01A2), and the Society of Analytical Chemists of Pittsburgh for sponsoring fellowship support though the American Chemical Society, Division of Analytical Chemistry (P.D.S.).
References
- 1.McLafferty FW. Acc Chem Res. 1994;27:379–386. [Google Scholar]
- 2.Valaskovic GA, Kelleher NL, McLafferty FW. Science. 1996;273:1199–1202. doi: 10.1126/science.273.5279.1199. [DOI] [PubMed] [Google Scholar]
- 3.Kelleher NL, Senko MW, Siegel MM, McLafferty FW. J Am Soc Mass Spectrom. 1997;8:380–383. [Google Scholar]
- 4.Williams ER. Anal Chem. 1998;70:179–185A. doi: 10.1021/ac981773x. [DOI] [PMC free article] [PubMed] [Google Scholar]
- 5.Speir JP, Senko MW, Little DP, Loo JA, McLafferty FW. J Mass Spectrom. 1995;30:39–42. [Google Scholar]
- 6.Cody RB, Jr, Amster IJ, McLafferty FW. Proc Natl Acad Sci USA. 1985;82:6367–6370. doi: 10.1073/pnas.82.19.6367. [DOI] [PMC free article] [PubMed] [Google Scholar]
- 7.Smith RD, Barinaga CJ, Udseth HR. J Phys Chem. 1989;93:5019–5022. [Google Scholar]
- 8.Senko MW, Speir JP, McLafferty FW. Anal Chem. 1994;66:2801–2808. doi: 10.1021/ac00090a003. [DOI] [PubMed] [Google Scholar]
- 9.Wu Q, Van Orden S, Cheng X, Bakhtiar R, Smith RD. Anal Chem. 1995;67:2498–2509. doi: 10.1021/ac00110a027. [DOI] [PubMed] [Google Scholar]
- 10.Williams ER, Henry KD, McLafferty FW, Shabanowitz J, Hunt DF. J Am Soc Mass Spectrom. 1990;1:413–416. doi: 10.1016/1044-0305(90)85022-E. [DOI] [PubMed] [Google Scholar]
- 11.Ijames CF, Wilkins CL. Anal Chem. 1990;62:1295–1299. doi: 10.1021/ac00212a017. [DOI] [PubMed] [Google Scholar]
- 12.Chorush RA, Little DP, Beu SC, Wood TD, McLafferty FW. Anal Chem. 1995;67:1042–4046. doi: 10.1021/ac00102a004. [DOI] [PubMed] [Google Scholar]
- 13.Little DP, Speir JP, Senko MW, O’Connor PB, McLafferty FW. Anal Chem. 1994;66:2809–2815. doi: 10.1021/ac00090a004. [DOI] [PubMed] [Google Scholar]
- 14.Price WD, Schnier PD, Williams ER. Anal Chem. 1996;68:859–866. doi: 10.1021/ac951038a. [DOI] [PubMed] [Google Scholar]
- 15.Jockusch RA, Schnier PD, Price WD, Strittmatter EF, Demirev PA, Williams ER. Anal Chem. 1997;69:1119–1126. doi: 10.1021/ac960804q. [DOI] [PMC free article] [PubMed] [Google Scholar]
- 16.Zubarev RA, Kelleher NL, McLafferty FW. J Am Chem Soc. 1998;120:3265–3266. [Google Scholar]
- 17.Carlin TJ, Freiser BS. Anal Chem. 1983;55:571–574. [Google Scholar]
- 18.Cody RB, Burnier RC, Freiser BS. Anal Chem. 1982;54:96–101. [Google Scholar]
- 19.Lee SA, Jiao CQ, Huang Y, Freiser BS. Rapid Commun Mass Spectrom. 1993;7:819–821. [Google Scholar]
- 20.Williams ER, McLafferty FW. J Am Soc Mass Spectrom. 1990;1:427–430. doi: 10.1016/1044-0305(90)85025-H. [DOI] [PubMed] [Google Scholar]
- 21.Boering KA, Rolfe J, Brauman JI. Rapid Commun Mass Spectrom. 1992;5:406–414. [Google Scholar]
- 22.Gauthier JW, Trautman TR, Jacobson DB. Anal Chim Acta. 1991;246:211–225. [Google Scholar]
- 23.Heck AJR, Derrick PJ. Anal Chem. 1997;69:3603–3607. doi: 10.1021/ac970254b. [DOI] [PubMed] [Google Scholar]
- 24.Shin SK, Han S. J Am Soc Mass Spectrom. 1997;8:86–89. [Google Scholar]
- 25.Tolic LP, Bruce JE, Lei QP, Anderson GA, Smith RD. Anal Chem. 1998;70:405–408. doi: 10.1021/ac970828c. [DOI] [PubMed] [Google Scholar]
- 26.Craig SL, Brauman JI. J Phys Chem A. 1997:4745–4752. [Google Scholar]
- 27.Marzluff EM, Campbell S, Rodgers MT, Beauchamp JL. J Am Chem Soc. 1994;116:7787–7796. [Google Scholar]
- 28.Marzluff EM, Campbell S, Rodgers MT, Beauchamp JL. J Am Chem Soc. 1994;116:6947–6948. [Google Scholar]
- 29.Wysocki VH, Kenttamaa HI, Cooks RG. Int J Mass Spectrom Ion Processes. 1987;75:181–208. [Google Scholar]
- 30.Kenttamaa HI, Cooks RG. Int J Mass Spectrom Ion Processes. 1985;64:79–83. [Google Scholar]
- 31.Castro JA, Rucker PV, Wilkins CL. J Am Soc Mass Spectrom. 1992;3:445–450. doi: 10.1016/1044-0305(92)87071-6. [DOI] [PubMed] [Google Scholar]
- 32.Laramee JA, Hemberger PH, Cooks RG. Int J Mass Spectrom Ion Phys. 1980;33:231–250. [Google Scholar]
- 33.Chen JM, Hayes JD, Dunbar RC. J Phys Chem. 1984;88:4759–4764. [Google Scholar]
- 34.Baer T, Dutuit O, Mestdagh H, Rolando C. J Phys Chem. 1988;92:5674–5679. [Google Scholar]
- 35.Thibault P, Alexander AJ, Boyd RK, Tomer KB. J Am Soc Mass Spectrom. 1993;4:845–854. doi: 10.1016/1044-0305(93)87002-T. [DOI] [PubMed] [Google Scholar]
- 36.Vachet RW, Glish GL. J Am Soc Mass Spectrom. 1996;7:1194–1202. doi: 10.1016/S1044-0305(96)00109-2. [DOI] [PubMed] [Google Scholar]
- 37.Asano, K. G.; Goeringer, D. E.; McLuckey, S. A. Proceeding of the 1998 American Society of Mass Spectrometry; Orlando, FL, 470.
- 38.Marshall AG, Wang TCL, Ricca TL. J Am Chem Soc. 1985;107:7893–7897. [Google Scholar]
- 39.McLuckey SA, Goeringer DE. J Mass Spectrom. 1997;32:461–474. [Google Scholar]
- 40.Vachet RW, Ray KL, Glish GL. J Am Soc Mass Spectrom. 1998;9:341–344. doi: 10.1016/S1044-0305(98)00008-7. [DOI] [PubMed] [Google Scholar]
- 41.Schnier PD, Price WD, Strittmatter EF, Williams ER. J Am Soc Mass Spectrom. 1997;8:771–780. doi: 10.1016/S1044-0305(97)84129-3. [DOI] [PMC free article] [PubMed] [Google Scholar]
- 42.Wyttenbach T, von Helden G, Bowers MT. J Am Chem Soc. 1996;118:8355–8364. [Google Scholar]
- 43.Schnier PD, Price WD, Jockusch RA, Williams ER. J Am Chem Soc. 1996;118:7178–7189. doi: 10.1021/ja9609157. [DOI] [PMC free article] [PubMed] [Google Scholar]
- 44.Vekey K. J Mass Spectrom. 1996;31:445–463. [Google Scholar]
- 45.Lee S, Kim HS, Beauchamp JL. J Am Chem Soc. 1998;120:3188–3195. [Google Scholar]
- 46.Cooks RG, Wong PSH. Acc Chem Res. 1998;31:379–386. [Google Scholar]


