

Abstract
Mice have proved to be a powerful model organism for understanding obesity in humans. Single gene mutants and genetically modified mice have been used to identify obesity genes, and the discovery of loci for polygenic forms of obesity in the mouse is an important next step. To pursue this goal, the inbred mouse strains 129P3/J (129) and C57BL/6ByJ (B6), which differ in body weight, body length, and adiposity, were used in an F2 cross to identify loci affecting these phenotypes. Linkages were determined in a two-phase process. In the first phase, 169 randomly selected F2 mice were genotyped for 134 markers that covered all autosomes and the X Chromosome (Chr). Significant linkages were found for body weight and body length on Chr 2. In addition, we detected several suggestive linkages on Chr 2 (adiposity), 9 (body weight, body length, and adiposity), and 16 (adiposity), as well as two suggestive sex-dependent linkages for body length on Chrs 4 and 9. In the second phase, 288 additional F2 mice were genotyped for markers near these regions of linkage. In the combined set of 457 F2 mice, six significant linkages were found: Chr 2 (Bwq5, body weight and Bdln3, body length), Chr 4 (Bdln6, body length, males only), Chr 9 (Bwq6, body weight and Adip5, adiposity), and Chr 16 (Adip9, adiposity), as well as several suggestive linkages (Adip2, adiposity on Chr 2; Bdln4 and Bdln5, body length on Chr 9). In addition, there was a suggestive linkage to body length in males on Chr 9 (Bdln4). For adiposity, there was evidence for epistatic interactions between loci on Chr 9 (Adip5) and 16 (Adip9). These results reinforce the concept that obesity is a complex trait. Genetic loci and their interactions, in conjunction with sex, age, and diet, determine body size and adiposity in mice.
Introduction
The mouse is a well-established model organism to study human obesity genetics, both because mice and humans develop spontaneous and diet-induced obesity, and because the sequencing of the mouse genome is nearly complete (Mouse Genome Sequencing Consortium 2002). Given the adequacy of the model and the available genetic resources, investigators have begun to identify genomic regions containing loci that influence mouse body size and adiposity (Brockmann et al. 1996, 1998, 2000; Cheverud et al. 1996; Collins et al. 1993; Corva et al. 2001; Dragani et al. 1995; Ishikawa et al. 2000; Keightley et al. 1996, 1998; Kirkpatrick et al. 1998; Klein et al. 1998; Kluge et al. 2000; Lembertas et al. 1997; Mehrabian et al. 1998; Moody et al. 1999; Morris et al. 1999; Rance et al. 1997a, 1997b; Reifsnyder et al. 2000; Taylor and Phillips 1996, 1997; Taylor et al. 2001; Warden et al. 1993, 1995; West et al. 1994a, 1994b, 1995; York et al. 1996, 1997). In our previous studies we found that males of the C57BL/6ByJ (B6) strain are heavier, longer, and fatter than those of the 129P3/J (129) strain (Bachmanov et al. 2001), but this pair of strains has not been previously used to search for obesity-related trait loci. The goal of the present experiment was to identify regions of the genome that harbor loci for body weight, body length, and adiposity in mice of the F2 generation of hybrids between the B6 and 129 parental strains. In Phase 1 of a genome scan, we genotyped 169 (B6 × 129) F2 mice, using polymorphic markers selected at less than 20-cM intervals along the mouse genome. In Phase 2, we genotyped 457 F2 mice for markers near linkages found in Phase 1.
Materials and methods
Mice
B6 and 129 inbred mice used for breeding and for phenotyping were obtained from The Jackson Laboratory (Bar Harbor, Me.). The B6 × 129 F1 and F2 hybrids were bred at the Monell Chemical Senses Center. The mice were housed in a temperature-controlled vivarium at 23°C on a 12:12-h light:dark cycle and had free access to water and pelleted Teklad Rodent Diet 8604 (4.4% fat). All protocols were reviewed and approved by the Institutional Animal Care and Use Committee of the Monell Chemical Senses Center.
F2 pups were weaned at 21–30 days of age and reared in same-sex groups (in most cases, 4–6 mice per cage, and never more than 6 mice in one cage). A total of 457 F2 mice (228 female and 229 male mice) were bred from three types of reciprocal crosses: (B6♀ × 129♂) F1♀ × (B6♀ × 129♂) F1♂, (129♀ × B6♂) F1♀ × (129♀ × B6♂) F1♂, and (B6♀ × 129♂) F1♀ × (129♀ × B6♂) F1♂. The number of pups born to each dam was recorded, and the litter size was used as a variable in some analyses.
Prior to the measurement of body length and adiposity, mice were tested to determine their preference for taste solutions. Results of these experiments are reported in a separate publication (Bachmanov et al. 2002). All mice (B6, 129, and F2) were treated identically during these tests.
Body weight, body length, and adiposity phenotypes
Body weight, body length, and adiposity measures were collected when the average age of the F2 mice was 8.9 ± 1.1 months (range 6.8–12.6 months). Variables measured were body weight (to the nearest 0.1 g), body length (base of the lower incisors to anus, distance to the nearest 0.1 cm), and right and left retroperitoneal and gonadal adipose depot weights (four depots total, weighed individually to the nearest 0.01 g). The weight of dissected adipose depots is highly correlated with measures of whole-body carcass composition (Bachmanov et al. 2001). These measures (body weight, body length, and adiposity) were the phenotypes used in the linkage analyses.
Mean group differences for the traits were compared by ANOVA, with sex and genotype (B6, 129, and F2) as factors. Between-genotype differences were then evaluated with LSD post-hoc tests.
Heritability in the broad sense (the degree of genetic determination) was estimated based on variances in the parental strains and F2 (Bachmanov et al. 2002). The environmental (nongenetic) variance was calculated as an average between the trait (total) variances for the two parental strains, . The genetic variance was calculated as a difference between the trait variance of the F2 generation and the environmental variance (VARG = VARF2−VARE). The heritability estimate was calculated as a proportion of the genetic variance from the trait variance of the F2, h2=VARG/VARF2 (Falconer 1989).
We conducted univariate and multiple regression analyses to evaluate the relationship between body weight, length, adiposity, sex, age, reciprocal cross type, and litter size of F2 mice. Some covariates that explained a significant amount of trait variance in univariate analyses were used in multivariate regression to remove covariate effects. The residuals obtained from the multiple regression analyses were standardized to a mean of zero and a standard deviation of 1 so that all trait values were comparable and are referred to as ’adjusted variables’ in the linkage analysis. When mice of only one sex were examined, i.e., in the X-linked and sex-dependent analyses, trait values were adjusted for covariates within each sex separately. Descriptive and linear regression analyses were computed using Statistica (StatSoft, Tulsa, OK).
DNA extraction and genotyping
Genomic DNA was purified from mouse tails either by phenol/chloroform extraction and precipitation with ethanol (Hogan et al. 1986) or by a sodium hydroxide method (Truett et al. 2000). We selected 134 markers polymorphic between the progenitor strains, spaced at less than 20-cM intervals throughout the mouse genome (Table 1). In addition to the semidominant PCR-based microsatellite markers, we used several dominant coat and eye color markers, including agouti (A) on Chr 2 and tyrosinase (Tyr, formerly albino) and pink-eyed dilution (P) on Chr 7. The B6 mice have black eyes and fur determined by genotypes a/a, Tyr/Tyr, P/P. The 129 mice have pink eyes and albino fur (genotype Aw/Aw, Tyrc/Tyrc, p/p) or cream fur (light chinchilla; genotype Aw/Aw, Tyrc-ch/Tyrc, p/p) (Festing et al. website; Roderick and Guidi 1989; Withham 1990). The F2 mice had several eye and coat color phenotypes. The F2 mice with pink eyes were albino (Tyrc/Tyrc), cream (Tyrc-ch/Tyrc), or light buff (Tyrc-ch/Tyrc-ch); agouti alleles could not be determined in these mice and were scored as unknown. The other variants were white-bellied agouti (Aw/−, Tyr/−, P/−), black (a/a, Tyr/−, P/−), yellow coat with pink eyes (Aw/−, Tyr/−, p/p), blue-gray coat with pink eyes (a/a, Tyr/−, p/p), chinchilla coat with black eyes (Aw/−, Tyrc-ch/Tyrc-ch, P/−, and Aw/−, Tyrc-ch/Tyrc, P/−), and chocolate coat with black eyes (a/a, Tyrc-ch/Tyrc-ch, P/−) (Silvers 1979). For each coat and eye color marker, two genotypes could be distinguished: a homozygous genotype for a recessive allele (agouti for the B6 strain, and albino and pink-eyed dilution for the 129 strain), and a heterozygous or homozygous genotype for a dominant allele.
Table 1.
List of genotyped DNA markers allelic between the 129 and B6 inbred strains
| Marker | Pos’n | Marker | Pos’n | Marker | Pos’n | Marker | Pos’n |
|---|---|---|---|---|---|---|---|
| D1Mit123 | 21.0 | D5Mit1 | 5.0 | D10Mit80 | 4.0 | D15Mit130 | 14.5 |
| D1Mit19 | 36.9 | D5Mit128 | 24.0 | D10Mit87 | 16.0 | D15Mit85 | 15.4 |
| D1Mit48 | 54.0 | D5Mit6 | 50.0 | D10Mit194 | 29.0 | D15Mit29 | 42.8 |
| D1Mit139 | 65.0 | D5Mit24 | 60.0 | D10Mit186 | 40.0 | D15Mit96 | 48.9 |
| D1Mit14 | 81.6 | D5Mit214 | 70.0 | D10Mit10 | 51.0 | D15Mit193 | 57.9 |
| D1Mit15 | 87.9 | D5Mit374 | 82.0 | D10Mit162 | 59.0 | D15Mit35 | 60.9 |
| D1Mit37 | 101.0 | D5Mit286 | 94.0 | D10Mit205 | 69.0 | ||
| D1Mit17 | 106.3 | D16Mit55* | 3.4 | ||||
| D6Mit86 | 0.5 | D11Mit77 | 2.0 | D16Mit3* | 21.0 | ||
| D2Mit1* | 1.0 | D6Mit77 | 15.8 | D11Mit21 | 20.0 | D16Mit4* | 27.3 |
| D2Mit151* | 15.0 | D6Mit188 | 32.5 | D11Mit23 | 28.1 | D16Mit47* | 43.0 |
| D2Mit7* | 28.0 | D6Mit177 | 38.5 | D11Mit4 | 37.0 | D16Mit6* | 60.0 |
| D2Mit61* | 34.0 | D6Mit36 | 46.0 | D11Mit41 | 49.0 | D16Mit71* | 69.2 |
| D2Mit9* | 37.0 | D6Mit55 | 50.0 | D11Mit199 | 62.0 | ||
| D2Mit12* | 50.3 | D6Mit201 | 74.0 | D11Mit184 | 78.0 | D17Mit46 | 3.3 |
| D2Mit224* | 74.0 | D17Mit51 | 22.9 | ||||
| D2Mit168* | 81.7 | D7Mit76 | 3.4 | D12Mit12 | 10.0 | D17Mit6 | 31.0 |
| Agouti (A)* | 89.0 | D7Mit69 | 20.8 | D12Mit46 | 17.0 | D17Mit93 | 44.5 |
| D2Mit197* | 92.0 | Pink-eyed (P) | 24.5 | D12Mit34 | 29.0 | D17Mit123 | 56.7 |
| D2Mit148* | 105.0 | Albino (Tyr) | 38.2 | D12Mit14 | 38.0 | ||
| D7Mit31 | 44.0 | D12Mit194 | 45.0 | D18Mit19 | 2.0 | ||
| D3Mit54 | 4.6 | D7Rp2 | 46.3 | D12Mit20 | 58.0 | D18Mit55 | 25.0 |
| D3Mit203 | 11.2 | D7Mit38 | 50.0 | D18Mit33 | 44.0 | ||
| D3Mit25 | 29.5 | D7Mit7 | 56.5 | D13Mit44 | 7.0 | D18Mit144 | 57.0 |
| D3Mit10 | 49.7 | D7Mit15 | 71.0 | D13Mit38 | 19.0 | ||
| D3Mit86 | 76.2 | D13Mit34 | 30.0 | D19Mit85 | 16.0 | ||
| D3Mit89 | 86.1 | D8Mit95 | 8.0 | D13Mit97 | 40.0 | D19Mit11 | 41.0 |
| D8Mit190 | 21.0 | D13Mit147 | 51.0 | D19Mit10 | 47.0 | ||
| D4Mit264* | 1.9 | D8Mit29 | 33.0 | D13Mit151 | 71.0 | D19Mit1 | 52.0 |
| D4Mit4* | 12.1 | D8Mit41 | 41.0 | D13Mit35 | 75.0 | D19Mit35 | 53.0 |
| D4Mit7* | 35.5 | D8Mit271 | 57.0 | ||||
| D4Mit58* | 48.5 | D8Mit56 | 73.0 | D14Mit11 | 3.0 | DXMit136 | 2.6 |
| D4Mit204* | 61.9 | D14Mit52 | 11.5 | DXMit50 | 14.1 | ||
| D4Mit33* | 79.0 | D9Mit218* | 4.0 | D14Mit55 | 12.0 | DXMit19 | 41.8 |
| D4Mit42* | 81.0 | D9Mit25* | 26.0 | D14Mit82 | 19.5 | DXMit69 | 58.0 |
| D4Mit256* | 82.7 | D9Mit32* | 35.0 | D14Mit37 | 27.5 | DXMit222 | 72.5 |
| D4Ertd296e* | 81.7 | D9Mit306* | 42.0 | D14Mit7 | 44.0 | ||
| D9Mit182* | 55.0 | D14Mit97 | 58.0 | ||||
| D9Mit37* | 61.0 |
Map distances are from the Mouse Genome Database (www.jax.org). When map locations were uncertain (e.g., D7Rp2), the distances computed from this F2 panel were used. Markers typed in Phase 2 (N = 457 mice) are denoted with an *.
Microsatellite markers were amplified by the PCR with primers purchased from Invitrogen (Carlsbad, Calif.) or Research Genetics (Huntsville, Ala.) with a protocol modified slightly from that of Dietrich and coworkers (Dietrich et al. 1992). The denatured PCR products were electrophoresed on a 6% polyacrylamide, 8.3 m urea sequencing gel, and the polymorphisms were visualized by autoradiography. Some genotyping was conducted by the Australian Genome Research Facility (Melbourne, Australia) with fluorescently labeled primers.
Linkage analysis
In Phase 1, we randomly selected a subset of 169 F2 mice (88 females and 81 males) for genotyping from a pool of 457 mice. Mice were selected randomly rather than for extremes of phenotype because we used multiple traits in the analyses and therefore had no single distribution from which to draw the extreme phenotypes.
Interval mapping based upon maximum likelihood estimation was conducted with MAPMAKER/QTL 1.1 software (Lander et al. 1987) that calculated chromosomal positions and the percentage of variance accounted for by quantitative trait loci. Thresholds for suggestive and significant linkage were estimated as described previously (Lander and Kruglyak 1995). For markers from the X Chr and to detect sex-dependent autosomal linkages (see below), F2 mice were grouped by sex, and the analysis was conducted separately for males and females.
Sex-dependent linkages for autosomal markers
The results of previous studies indicate that some autosomal obesity loci are sex dependent (Ishikawa et al. 2000; Taylor et al. 1999). For the current analysis, if the LOD score was suggestive or significant in one sex but at least 1 LOD score lower in the other sex, the locus was considered sex dependent.
Phase 2 linkage analysis
Chromosomes that showed suggestive or significant evidence of linkage in Phase 1 (i.e., Chr 2, 4, 9, and 16; LOD > 2.8 for one or more phenotypes) were genotyped by using 288 additional F2 mice. The analyses were conducted again using all 457 genotyped F2 mice. For each LOD score peak, the mode of inheritance was determined by comparing LOD scores obtained under unconstrained, additive, recessive, and dominant models. The percentage of trait variance explained by several loci was determined with MAPMAKER/QTL by fitting all linked loci simultaneously under the unconstrained model. With this value and heritability estimates (described above), the percentage of genetic variance explained by several loci was calculated as: “% of trait variance explained by loci”/“heritability” × 100.
A confidence interval for each locus was defined as LOD drops of 1.0 proximal and distal to the LOD maximum. Where there was an indication of multiple linkages, we declared separate peaks if the drops in LOD score on both sides were >2.0. When multiple peaks were detected, composite interval mapping (Zeng 1993), computed with QTLCartographer (Basten et al. 2001), was employed to better resolve the location of the trait loci. Possible epistatic interactions were evaluated by two-way ANOVA for the pairs of markers nearest to the loci identified in the Phase 2 scan.
Results
Analysis of phenotypes
Genotype, (parental strain or F2), sex (male or female), and their interaction were evaluated. Regardless of genotype, male mice were heavier, longer, and had more fat than female mice [effect of sex on body weight, F(1,483) = 35.7, p < 0.01; body length, F(1,483) = 20.1, p < 0.01; adiposity, F(1,472) = 14.0, p < 0.01] (Table 2). Regardless of sex, B6 and F2 mice were heavier (effect of genotype, F(2,483)=7.78, p < 0.001) and had more dissectible fat (effect of genotype, F(2,483) = 3.72, p =0.025) than the 129 mice, but there was no main effect of genotype on body length (p > 0.05) (Fig. 1). However, post hoc comparisons of body length revealed that male B6 and F2 mice were longer than male 129 mice. The three groups of female mice were similar in body length. Heritability estimates calculated by using the phenotype information from the parental strains and the F2 mice were 0.80 (body length), 0.74 (body weight), and 0.73 (adiposity).
Table 2.
Body weight, body adiposity, and body length in F2 mice used in the Phase 1 genome scan (N = 169)
|
Females (N = 88) |
Males (N = 81) |
|||
|---|---|---|---|---|
| Phenotype | Mean ± SD | Range | Mean ± SD | Range |
| Length (cm) | 8.6 ± 0.5a | 7.0–9.9 | 9.2 ± 0.6 | 7.4–10.7 |
| Body weight (g) | 29.2 ± 5.4a | 19.3–59.9 | 39.1 ± 6.2 | 25.3–59.6 |
| Adipose depot (g) | 1.0 ± 1.0a | 0.11–8.6 | 1.6 ± 0.6 | 0.3–3.8 |
p < 0.01, males versus females, t-test.
Fig. 1.
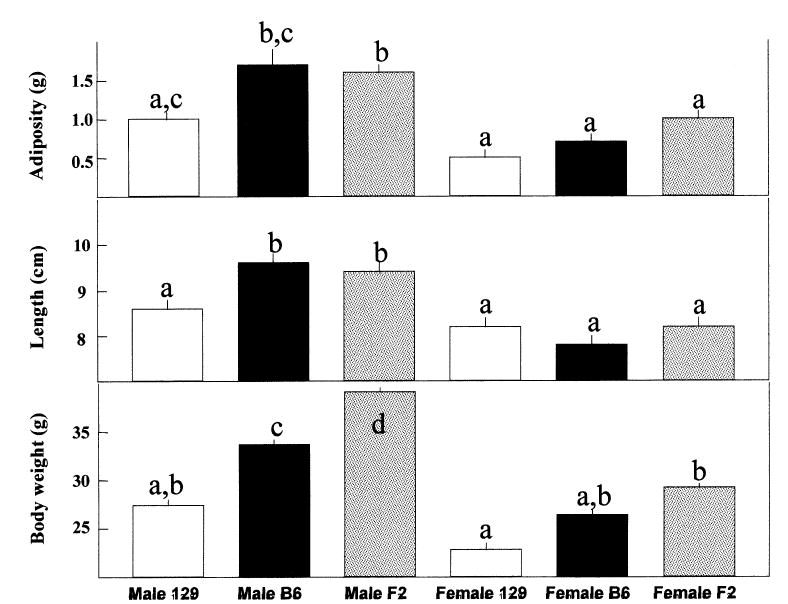
Average adiposity (top), body length (middle), and body weight (bottom) of B6 (females N = 10, males N = 10), 129 (females N = 10, males N = 10), and F2 (females N = 228, males N = 229) mice. Group means that share at least one letter in a superscript do not differ (p > 0.05, post-hoc test; LSD).
Body weight, body length, and adiposity were affected by sex, age, and litter size in the F2 population (Table 3). Older mice were longer and had more adipose tissue than younger mice. Mice from small litters were longer, heavier, and had more adipose tissue than mice from large litters. Mice from different reciprocal cross groups did not differ in body weight, length, or adiposity (p > 0.05).
Table 3.
Univariate regression analysis of body weight, length, and adiposity by sex, age, and litter size (N = 457)
| Predictor | Trait | % var (r2)a | β | p |
|---|---|---|---|---|
| Sex | Body weight | 43 | −0.65 | <0.01 |
| Body length | 24 | −0.49 | <0.01 | |
| Adiposity | 11 | −0.34 | <0.01 | |
| Age | Body weight | 0 | 0.07 | 0.12 |
| Body length | 3 | 0.17 | <0.01 | |
| Adiposity | 2 | 0.15 | <0.01 | |
| Litter size | Body weight | 2 | −0.15 | <0.01 |
| Body length | 2 | −0.14 | <0.01 | |
| Adiposity | 2 | −0.13 | <0.01 |
Percentage of trait variance accounted for by the predictor. Five mice had missing values for one or more variables and were excluded from the subsequent analysis.
Body weight, body length, and adiposity unadjusted for covariates were highly correlated (Table 4). Using multiple regression, body weight was adjusted for sex and litter size; body length was adjusted for sex, age, and litter size; adiposity was adjusted for sex, age, litter size, body length, and body weight. After adjustment, body weight unadjusted and body length variables were correlated with adiposity, whereas adjusted adiposity reflected the amount of adipose tissue independent of body weight and body length. The distributions of all adjusted phenotypes were skewed (body weight, 0.90; body length, −0.22; adiposity, 1.58) and kurtotic for body weight (2.16) and adiposity (9.29) and were not normally distributed (Shapiro-Wilk’s W test; all p < 0.01; Fig. 2).
Table 4.
Correlations among unadjusted and adjusteda phenotypes (N = 457)
| Phenotype | Body length | Adiposity | Adjusted body weight | Adjusted body length | Adjusted adiposity |
|---|---|---|---|---|---|
| Body weight | 0.67* | 0.76* | 0.75* | 0.39* | 0.00 |
| Body length | 0.44* | 0.45* | 0.85* | 0.00 | |
| Adiposity | 0.70* | 0.28* | 0.60* | ||
| Adjusted body weight | 0.52* | 0.00 | |||
| Adjusted body length | 0.00 |
p < 0.05.
Traits were adjusted by using multiple regression. See text for description.
Fig. 2.
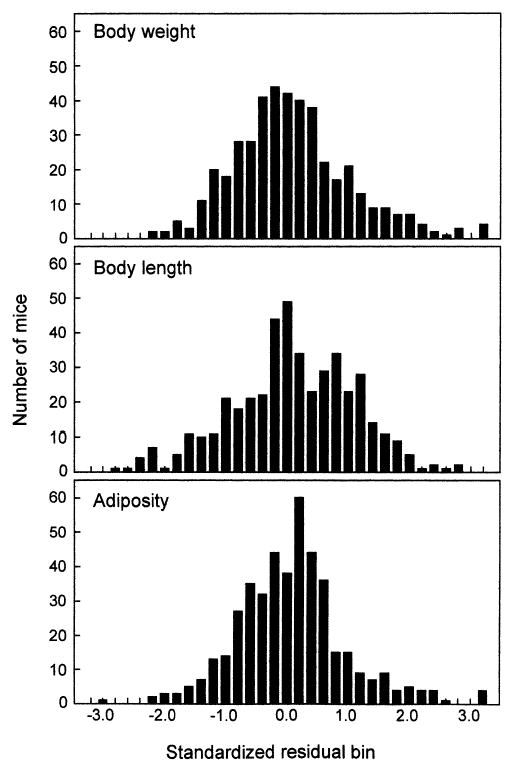
Distribution of adjusted traits in the F2 generation (N = 457).
Phase 1 linkage results
Data for both sexes analyzed together revealed several significant and suggestive linkages for body weight, body length, and adiposity (Figure 3; Table 5). There were two significant linkages on Chr 2 for body weight and body length. Other linkages were suggestive and were found on Chr 9 (body weight, body length, and adiposity) and on Chr 16 (adiposity). For all loci except for the one on Chr 16, the mode of inheritance was additive. Chromosomes with LOD scores >2.8 (unconstrained model) for one or more phenotypes were selected for additional genotyping in Phase 2.
Fig. 3.
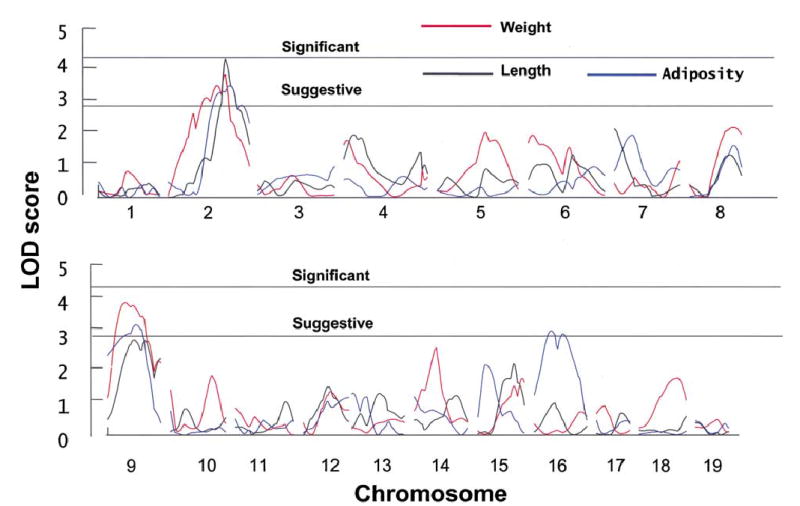
LOD scores (unconstrained model) from a genome scan with adjusted body weight, body length, and adiposity as phenotypes (N = 169). The lower line reflects the threshold for suggestive (LOD ≥ 2.8) linkage, and the upper line reflects the threshold for significant linkage (LOD ≥ 4.3) for an unconstrained model.
Table 5.
Suggestive and significant linkages detected in Phase 1 (N = 169)
| Phenotype | Marker | Peak LODa | Mode of inheritanceb | Allele increasing trait | % trait variance |
|---|---|---|---|---|---|
| Weight | D2Mit168 | 3.60** | Additive | B6 | 9.8 |
| Weight | D9Mit25 | 3.27** | Additive | B6 | 11.8 |
| Length | D2Mit168 | 4.01** | Additive | B6 | 11.0 |
| Length | D9Mit306 | 2.73* | Additive | B6 | 7.8 |
| Adiposity | D2Mit168 | 3.23* | Additive | 129 | 9.6 |
| Adiposity | D9Mit32 | 2.91* | Additive | 129 | 9.4 |
| Adiposity | D16Mit6 | 2.85* | Dominant | 129 | 9.9 |
LOD score for corresponding mode of inheritance.
Suggestive linkage (LOP threshold 1.9 for additive, 2.0 for dominant/recessive, and 2.8 for unconstrained models).
Significant linkage (LOD thresholds 3.3 for additive, 3.4 for dominant/recessive, and 4.3 for unconstrained model).
Estimate based on LOD scores calculated using MAPMAKER/QTL under unconstrained, additive, recessive, and dominant models.
Linkage analysis within each sex (81 male and 88 female F2 mice) resulted in the identification of two regions with suggestive LOD scores in one sex, but with low LOD scores in the other sex. A region of Chr 4 was associated with body length in male but not female mice; likewise, a region of Chr 9 was linked to body length in male but not female mice. These two chromosomes were selected for additional genotyping in Phase 2.
Phase 2 analyses
There were five significant linkages found in the expanded sample of F2 mice (Table 6), with the largest having a LOD score > 7.0 for body length near D2Mit168 (Fig. 4). The other significant linkages were found for body weight on Chr 2 (Fig. 4), for body weight and adiposity on Chr 9 (Fig. 5), and for adiposity on Chr 16 (Fig. 6). Three suggestive linkages were found: an adiposity locus on Chr 2, and two LOD score peaks on Chr 9 for body length. These two peaks on Chr 9 for body length met the criteria for separate peaks. (Note that, although there are apparently two peaks for body weight on Chr 9, the centromeric peak does not meet the criteria for suggestive linkage). For body length, composite interval mapping with a window size of 10 cM confirmed two peaks on Chr 9 (LOD peak 1 = 2.22 at 56 cM, LOD peak 2 = 2.37 at 70 cM), although at a lower LOD score compared with the interval LOD score results. Symbols were assigned to each locus following guidelines approved by the Mouse Genomic Nomenclature Committee.
Table 6.
Suggestive and significant linkages detected in Phase 2 (N = 457)
| Phenotype | Marker | Locus symbol | Peak LOD | Mode of inheritance | Allele increasing trait | % trait variance |
|---|---|---|---|---|---|---|
| Weight | D2Mit168 | Bwq5 | 4.44** | Additive | B6 | 4.8 |
| Weight | D9Mit37 | Bwq6 | 4.00** | Recessive | B6 | 4.3 |
| Length | D2Mit168 | Bdln3 | 7.65** | Additive | B6 | 8.7 |
| Length | D9Mit32 | Bdln4 | 2.84* | Additive | B6 | 3.2 |
| Length | D9Mit37 | Bdln5 | 2.33* | Additive | B6 | 2.5 |
| Adiposity | D2Mit197 | Adip2 | 3.13* | Additive | 129 | 3.5 |
| Adiposity | D9Mit25 | Adip5 | 3.95** | Additive | 129 | 4.7 |
| Adiposity | D16Mit6 | Adip9 | 3.32** | Additive | B6 | 4.4 |
Suggestive linkage;
Significant linkage.
See Table 5 for a description of LOD score thresholds and other comments.
Fig. 4.

Chr 2 LOD score curves (N = 457). For body weight, the confidence interval 1 extends from 24 to 84 cM; for body length, from 65 to 75 cM; for adiposity, from 48 cM to the telomere. LOD score traces are shown for unconstrained model to facilitate comparison across phenotypes.
Fig. 5.

Chr 9 LOD score curves (N = 457). For body weight, the confidence interval extends from 68 cM to the telomere; for body length, from 30 cm to the telomere; for adiposity, from 6 to 54 cM. LOD score traces are shown for the modes of inheritance listed in Table 6 for each phenotype. Note that a second peak for body weight near D9Mit306 does not meet the criteria for suggestive linkage.
Fig. 6.
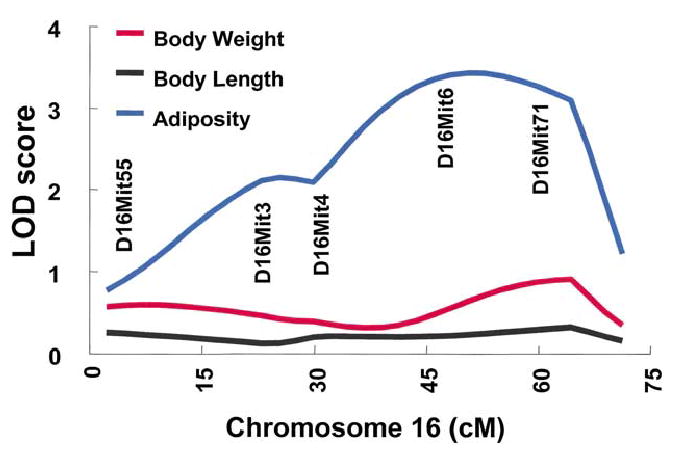
Chr 16 LOD score curves (N = 457). For adiposity, the confidence interval extends from 35 to 64 cM. LOD score traces are shown for the unconstrained model to facilitate comparison across phenotypes.
Individually, the loci identified here accounted for 3–9% of the total trait variance. When loci were considered simultaneously, they accounted for 10% of the total phenotypic variance in body weight, 12% of the variance in body length, and 11% of the adiposity variance. Using heritability estimates for these traits, we calculated that these loci account for 13, 15, and 15% of the total genetic variance for body weight, body length, and adiposity, respectively.
Sex-dependent autosomal linkages
When additional mice were genotyped by using markers for Chr 4, there was >1.0 LOD score difference between male and female mice, and for the male mice, there was evidence for significant linkage (Table 7). For Chr 9, the evidence for a male-dependent quantitative trait remained suggestive. The male-only LOD score for Chr 9 is nearly as high as the LOD score for both sexes analyzed together (see Fig. 5), which indicates that the suggestive LOD score is explained by a male-specific effect.
Table 7.
Results of sex-dependent analysis for body length in Phase 1 and 2
| Marker | Phase | Sex | Peak LODa | Mode of inheritance | % trait variance | Allele increasing trait |
|---|---|---|---|---|---|---|
| D4Mit4 | 1 | Males | 2.52* | Additive | 16.5 | 129 |
| D4Mit4 | 1 | Females | <1.0 | NA | NA | NA |
| D4Mit4 | 1 | Both sexes | 1.62 | Additive | 5.4 | 129 |
| D4Mit4b | 2 | Males | 3.54** | Additive | 8.1 | 129 |
| D4Mit33 | 2 | Females | 1.32 | Additive | 2.8 | 129 |
| D4Mit4 | 2 | Both sexes | 3.37** | Additive | 3.9 | 129 |
| D9Mit25 | 1 | Males | 2.74* | Additive | 16.3 | B6 |
| D9Mit25 | 1 | Females | <1.0 | NA | NA | NA |
| D9Mit25 | 1 | Both sexes | 2.54* | Additive | 8.1 | B6 |
| D9Mit32 | 2 | Males | 2.60* | Additive | 5.8 | B6 |
| D9Mit32 | 2 | Females | <1.0 | NA | NA | NA |
| D9Mit32 | 2 | Both sexes | 2.84* | Additive | 3.2 | B6 |
Suggestive linkage;
Significant linkage; NA = not applicable.
See Table 5 for a description of LOD score thresholds.
Assigned locus name Bdln6.
Epistatic interactions
For all loci that met the criteria for suggestive or significant linkage in Phase 2, the nearest markers were examined for evidence of epistasis. Two loci that contributed to adiposity, one on Chr 9 near D9Mit25 and one on Chr 16 near D16Mit6, interacted to increase adiposity (Fig. 7). Mice with two B6 alleles on Chr 16 and which are also homozygous for the 129 allele near D9Mit25 have significant increases in adiposity (F(4, 315) = 3.68, p = 0.006). This interaction is consistent with the main effects of these loci when assessed independently, i.e., the direction of the allelic effects is the same. For other pairs of suggestive or significant loci, there was no evidence of epistatic interaction (p > 0.01).
Fig. 7.
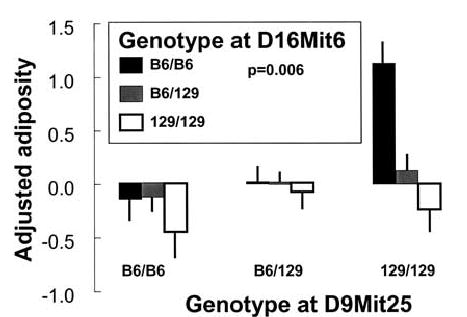
Epistatic effects on adiposity from loci on Chr 9 (Adip5) and Chr 16 (Adip9). F2 mice homozygous for the 129 allele at marker D9Mit25 have higher adiposity if they are also homozygous for the B6 genotype at marker D16Mit9 compared with mice with all other genotypes at these loci.
Discussion
We identified several regions of the genome that contain loci that influence body weight, body length, and adiposity in hybrids between the B6 and 129 strains. These linkages on Chr 2 (Bwq5, Bdln3, and Adip2), 9 (Bwq6, Bdln4, Bdln5, and Adip5), and 16 (Adip9) accounted for a significant proportion of the total trait variance. There was evidence for two loci on Chr 9 that contribute to body length, one of which affected body length of male but not female mice. The identification of quantitative trait loci in this strain pairing is important because it has not been studied for these phenotypes, and the use of novel strain pairings facilitates candidate gene identification (Wade et al. 2002). The B6 and 129 inbred strains are desirable choices because the genomes of both have been sequenced, and therefore allelic sites in candidate genome regions are more readily identified.
The use of mouse models for human obesity traits may be of immediate value. For instance, loci on Chr 2 affect obesity-related phenotypes in many pairs of inbred mouse strains (Brockmann et al. 1998; Cheverud et al. 1996; Corva et al. 2001; Drake et al. 2001; Horvat et al. 2000; Ishikawa et al. 2000; Lembertas et al. 1997; Mehrabian et al. 1998; Taylor and Phillips 1997; York et al. 1996), and loci in the homologous genomic region in humans affect similar phenotypes (Lee et al. 1999). These quantitative trait loci may be key molecules in the regulation of mammalian body size and adiposity.
The locus on Chr 2 for body length may be equivalent to a single gene mutation called diminutive (80.0 cM on Chr 2; www.jax.org). This phenotype is characterized by a small body size and an abnormal skeleton. In addition to body length, three other related traits have been mapped to the same region of Chr 2: heat loss (Moody et al. 1999), bone mineral density (Drake et al. 2001; Klein et al. 1998), and femur length (Corva et al. 2001). Therefore, this locus may exert a pleiotropic effect on skeletal size and body length in both humans and mice.
There were several linkages on Chr 9, for body weight, body length, and adiposity. Of the two loci on Chr 9 for body length, one was sex dependent. Linkages for body weight, body length, and adiposity have been previously described on Chr 9 (Brockmann and Bevova, 2002), and other investigators have described loci on Chr 9 that are sex dependent (Ishikawa et al. 2000; Taylor et al. 1999). Because body size in both humans and mice is strongly influenced by sex, the identification of these genes may give insight into the etiology of sexual dimorphism. Another interesting feature of the linkage to Chr 9 is that the allele from the heavier B6 strain reduced body weight (Bwq6) and adiposity (Adip5). The presence of “minus” trait reducing alleles in “plus” inbred strains (with higher trait values) is not uncommon for complex traits.
The development of obesity depends upon diet, sex, and age. We studied both male and female mice and found that male mice were heavier, longer, and fatter than female mice, and that the differences in body length among male mice may be partially attributed to a sex-dependent loci on Chrs 4 and 9. All mice in our study consumed a standard laboratory food source with a relatively low fat content, and therefore it remains to be seen whether these obesity loci will also affect the development of obesity in response to energy-dense diets. The B6 and 129 strains do differ in the rate of weight gain when fed high-fat diets (Bachmanov et al. 2001), and further work on the genetics of dietary obesity is warranted. Besides sex and diet, age is an important factor in the development of obesity. Early-onset obesity is more unusual, but is the most often detected in mouse genome scans because mice are usually phenotyped when young. Another form of obesity, with onset in late adulthood, is more common in both mice and humans. The mice used in this study were older than in most genome scans of adiposity and therefore may reveal loci important in maturity-onset obesity. The B6 and 129 inbred strain pair may be especially suitable to answer questions about the genetics of diet-induced obesity in older mice, since previous work in our laboratory has shown that B6 mice are more vulnerable to weight gain in response to high-fat feeding as they age (Bachmanov et al. 2001).
Haplotype maps of inbred mouse strains suggest that they are a mosaic of very few ancestral chromosomes (Wade et al. 2002), and, therefore, mapping techniques can exploit information about allelic differences among many strains. Loci that are allelic between the 129 and B6 inbred mouse strains, in conjunction with information from other strain pairings, will be informative for candidate gene analysis and identification.
Acknowledgments
This work was supported by National Institutes of Health grants R01DC00882 (Gary K Beauchamp); R03DC03509, R01DC04188, and R01DK55853 (D.R.Reed); R01AA11028 (M.G.Tordoff); and R03DC03853 (A.A.Bachmanov). We gratefully acknowledge the technical assistance of Maria Theodorides.
References
- 1.Bachmanov AA, Reed DR, Tordoff MG, Price RA, Beauchamp GK. Nutrient preference and diet-induced adiposity in C57BL/6ByJ and 129P3/J mice. Physiol Behav. 2001;72:603–613. doi: 10.1016/s0031-9384(01)00412-7. [DOI] [PMC free article] [PubMed] [Google Scholar]
- 2.Bachmanov AA, Reed DR, Li X, Li S, Beauchamp GK, et al. Voluntary ethanol consumption by mice: genome-wide analysis of quantitative trait loci and their interactions in a C57BL/6ByJ × 129P3/J F2 intercross. Genome Res. 2002;12:1257–1268. doi: 10.1101/gr.129702. [DOI] [PMC free article] [PubMed] [Google Scholar]
- 3.Basten C, Weir B, Zeng Z-B (2001) QTL Cartographer (1.15 ed). (North Carolina State University, Raleigh, Department of Statistics)
- 4.Brockmann GA, Bevova MR. Using mouse models to dissect the genetics of obesity. Trends Genet. 2002;18:367–376. doi: 10.1016/s0168-9525(02)02703-8. [DOI] [PubMed] [Google Scholar]
- 5.Brockmann G, Timtchenko D, Das P, Renne U, Freyer G, et al. Detection of QTL for body weight and body fat content in mice using genetic markers. J Anim Breed Genet. 1996;113:373–379. [Google Scholar]
- 6.Brockmann GA, Haley CS, Renne U, Knott SA, Schwerin M. Quantitative trait loci affecting body weight and fatness from a mouse line selected for extreme high growth. Genetics. 1998;150:369–381. doi: 10.1093/genetics/150.1.369. [DOI] [PMC free article] [PubMed] [Google Scholar]
- 7.Brockmann GA, Kratzsch J, Haley CS, Renne U, Schwerin M, et al. Single QTL effects, epistasis, and pleiotropy account for two-thirds of the phenotypic F(2) variance of growth and obesity in DU6i × DBA/2 mice. Genome Res. 2000;10:1941–1957. doi: 10.1101/gr.gr1499r. [DOI] [PMC free article] [PubMed] [Google Scholar]
- 8.Cheverud JM, Routman EJ, Duarte FAM, van Swinderen B, Cothran K, et al. Quantitative trait loci for murine growth. Genetics. 1996;142:1305–1319. doi: 10.1093/genetics/142.4.1305. [DOI] [PMC free article] [PubMed] [Google Scholar]
- 9.Collins AC, Martin ICA, Kirkpatrick BW. Growth quantitative trait loci (QTL) on mouse Chromosome 10 in a Quackenbush-Swiss X C57BL/6J backcross. Mamm Genome. 1993;4:454–458. doi: 10.1007/BF00296821. [DOI] [PubMed] [Google Scholar]
- 10.Corva PM, Horvat S, Medrano JF. Quantitative trait loci affecting growth in high growth (hg) mice. Mamm Genome. 2001;12:284–290. doi: 10.1007/s003350010275. [DOI] [PubMed] [Google Scholar]
- 11.Dietrich W, Katz H, Lincoln SE, Shin H-S, Friedman J, et al. A genetic map of the mouse suitable for typing intraspecific crosses. Genetics. 1992;131:423–447. doi: 10.1093/genetics/131.2.423. [DOI] [PMC free article] [PubMed] [Google Scholar]
- 12.Dragani TA, Zeng Z-B, Canzian F, Gariboldi M, Ghilarducci MT, et al. Mapping of body weight loci on mouse Chromosome X. Mamm Genome. 1995;6:778–781. doi: 10.1007/BF00539002. [DOI] [PubMed] [Google Scholar]
- 13.Drake TA, Schadt E, Hannani K, Kabo JM, Krass K, et al. Genetic loci determining bone density in mice with diet-induced atherosclerosis. Physiol Genomics. 2001;5:205–215. doi: 10.1152/physiolgenomics.2001.5.4.205. [DOI] [PubMed] [Google Scholar]
- 14.Falconer D (1989). Introduction to Quantitative Genetics. (3rd ed) (New York: J Wiley & Sons)
- 15.Festing MF, Simpson EM, Davisson MT, Mobraaten LE (Web site), Revised nomenclature for strain 129 mice. The Jackson Laboratory, http://www.informatics.jax.org/mgihome/nomen/strain129.shtml [DOI] [PubMed]
- 16.Hogan B, Costantini F, Lacy E (1986) Manipulating the Mouse Embryo: A Laboratory Manual. (Cold Spring Harbor, N.Y.: Cold Spring Harbor Laboratory Press)
- 17.Horvat S, Bunger L, Falconer VM, Mackay P, Law A, et al. Mapping of obesity QTLs in a cross between mouse lines divergently selected on fat content. Mamm Genome. 2000;11:2–7. doi: 10.1007/s003350010002. [DOI] [PubMed] [Google Scholar]
- 18.Ishikawa A, Matsuda Y, Namikawa T. Detection of quantitative trait loci for body weight at 10 weeks from Philippine wild mice. Mamm Genome. 2000;11:824–830. doi: 10.1007/s003350010145. [DOI] [PubMed] [Google Scholar]
- 19.Keightley PD, Hardge T, May L, Bulfield G. A genetic map of quantitative trait loci for body weight in the mouse. Genetics. 1996;142:227–235. doi: 10.1093/genetics/142.1.227. [DOI] [PMC free article] [PubMed] [Google Scholar]
- 20.Keightley PD, Morris KH, Ishikawa A, Falconer VM, Oliver F. Test of candidate gene-quantitative trait locus association applied to fatness in mice. Heredity. 1998;81:630–637. doi: 10.1046/j.1365-2540.1998.00450.x. [DOI] [PubMed] [Google Scholar]
- 21.Kirkpatrick BW, Mengelt A, Schulman N, Martin IC. Identification of quantitative trait loci for prolificacy and growth in mice. Mamm Genome. 1998;9:97–102. doi: 10.1007/s003359900696. [DOI] [PubMed] [Google Scholar]
- 22.Klein RF, Mitchell SR, Phillips TJ, Belknap JK, Orwoll ES. Quantitative trait loci affecting peak bone mineral density in mice. J Bone Miner Res. 1998;13:1648–1656. doi: 10.1359/jbmr.1998.13.11.1648. [DOI] [PubMed] [Google Scholar]
- 23.Kluge R, Giesen K, Bahrenberg G, Plum L, Ortlepp JR. Quantitative trait loci for obesity and insulin resistance (Nob1, Nob2) and their interaction with the leptin receptor allele (LeprA720T/T1044I) in New Zealand obese mice. Diabetologia. 2000;43:1565–1572. doi: 10.1007/s001250051570. [DOI] [PubMed] [Google Scholar]
- 24.Lander E, Kruglyak L. Genetic dissection of complex traits: guidelines for interpreting and reporting linkage results. Nat Genet. 1995;11:241–247. doi: 10.1038/ng1195-241. [DOI] [PubMed] [Google Scholar]
- 25.Lander E, Green P, Abrahamson J, Barlow A, Daley M, et al. MAPMAKER: An interactive complex package for constructing primary linkage maps of experimental and natural populations. Genomics. 1987;1:174–181. doi: 10.1016/0888-7543(87)90010-3. [DOI] [PubMed] [Google Scholar]
- 26.Lee JH, Reed DR, Li W-D, Xu W, Joo E-J, et al. Genome scan for human obesity and linkage to markers in 20q13. Am J Hum Genet. 1999;64:196–209. doi: 10.1086/302195. [DOI] [PMC free article] [PubMed] [Google Scholar]
- 27.Lembertas AV, Perusse L, Chagnon YC, Fisler JS, Warden CH, et al. Identification of an obesity quantitative trait locus on mouse chromosome 2 and evidence of linkage to body fat and insulin on the human homologous region 20q. J Clin Invest. 1997;100:1240–1247. doi: 10.1172/JCI119637. [DOI] [PMC free article] [PubMed] [Google Scholar]
- 28.Mehrabian M, Wen PZ, Fisler J, Davis RC, Lusis AJ. Genetic loci controlling body fat, lipoprotein metabolism, and insulin levels in a multifactorial mouse model. J Clin Invest. 1998;101:2485–2496. doi: 10.1172/JCI1748. [DOI] [PMC free article] [PubMed] [Google Scholar]
- 29.Moody DE, Pomp D, Nielsen MK, Van Vleck LD. Identification of quantitative trait loci influencing traits related to energy balance in selection and inbred lines of mice. Genetics. 1999;152:699–711. doi: 10.1093/genetics/152.2.699. [DOI] [PMC free article] [PubMed] [Google Scholar]
- 30.Morris KH, Ishikawa A, Keightley PD. Quantitative trait loci for growth traits in C57BL/6J × DBA/2J mice. Mamm Genome. 1999;10:225–228. doi: 10.1007/s003359900977. [DOI] [PubMed] [Google Scholar]
- 31.Mouse Genome Sequencing Consortium. Initial sequencing and comparative analysis of the mouse genome. Nature. 2002;420:520–562. doi: 10.1038/nature01262. [DOI] [PubMed] [Google Scholar]
- 32.Rance KA, Heath SC, Keightley PD. Mapping quantitative trait loci for body weight on the X chromosome in mice. II. Analysis of congenic backcrosses. Genet Res. 1997a;70:125–133. doi: 10.1017/s0016672397002929. [DOI] [PubMed] [Google Scholar]
- 33.Rance KA, Hill WG, Keightley PD. Mapping quantitative trait loci for body weight on the X chromosome in mice. I. Analysis of a reciprocal F2 population. Genet Res. 1997b;70:117–124. doi: 10.1017/s0016672397002917. [DOI] [PubMed] [Google Scholar]
- 34.Reifsnyder PC, Churchill G, Leiter EH. Maternal environment and genotype interact to establish diabesity in mice. Genome Res. 2000;10:1568–1578. doi: 10.1101/gr.147000. [DOI] [PMC free article] [PubMed] [Google Scholar]
- 35.Roderick TH, Guidi JN (1989) Strain distribution of polymorphic variants. In: Lyon MF, Searle AG (eds.), Genetic Variants and Strains of the Laboratory Mouse (2nd ed). (New York: Oxford University Press), pp 663–672
- 36.Silvers WK (1979) The Coat Colors of Mice, a Model for Mammalian Gene Action and Interaction. (New York: Springer-Verlag)
- 37.Taylor BA, Phillips SJ. Detection of obesity QTLs on mouse chromosomes 1 and 7 by selective DNA pooling. Genomics. 1996;34:389–398. doi: 10.1006/geno.1996.0302. [DOI] [PubMed] [Google Scholar]
- 38.Taylor BA, Phillips SJ. Obesity QTLs on mouse chromosomes 2 and 17. Genomics. 1997;43:249–257. doi: 10.1006/geno.1997.4835. [DOI] [PubMed] [Google Scholar]
- 39.Taylor BA, Tarantino LM, Phillips SJ. Gender-influenced obesity QTLs identified in a cross involving the KK type II diabetes-prone mouse strain. Mamm Genome. 1999;10:963–968. doi: 10.1007/s003359901141. [DOI] [PubMed] [Google Scholar]
- 40.Taylor BA, Wnek C, Schroeder D, Phillips SJ. Multiple obesity QTLs identified in an intercross between the NZO (New Zealand obese) and the SM (small) mouse strains. Mamm Genome. 2001;12:95–103. doi: 10.1007/s003350010254. [DOI] [PubMed] [Google Scholar]
- 41.Truett GE, Heeger P, Mynatt RL, Truett AA, Walker JA, et al. Preparation of PCR-quality mouse genomic DNA with hot sodium hydroxide and tris (Hot-SHOT) Biotechniques. 2000;29:52–54. doi: 10.2144/00291bm09. [DOI] [PubMed] [Google Scholar]
- 42.Wade CM, Kulbokas EJ, Kirby AW, Zody MC, Mullikin JC, et al. The mosaic structure of variation in the laboratory mouse genome. Nature. 2002;420:574–578. doi: 10.1038/nature01252. [DOI] [PubMed] [Google Scholar]
- 43.Warden CH, Fisler JS, Pace MJ, Svenson KL, Lusis AJ. Coincidence of genetic loci for plasma cholesterol levels and obesity in a multifactorial mouse model. J Clin Invest. 1993;92:773–779. doi: 10.1172/JCI116649. [DOI] [PMC free article] [PubMed] [Google Scholar]
- 44.Warden CH, Fisler JS, Shoemaker SM, Wen P-Z, Svenson KL. Identification of four chromosomal loci determining obesity in a multifactorial mouse model. J Clin Invest. 1995;95:1545–1552. doi: 10.1172/JCI117827. [DOI] [PMC free article] [PubMed] [Google Scholar]
- 45.West DB, Goudey-Lefevre J, York B, Truett GE. Dietary obesity linked to genetic loci on chromosome 9 and 15 in a polygenic mouse rnodel. J Clin Invest. 1994a;94:1410–1416. doi: 10.1172/JCI117477. [DOI] [PMC free article] [PubMed] [Google Scholar]
- 46.West DB, Waguespack J, York B, Goudey-Lefevre J, Price RA. Genetics of dietary obesity in AKR/J × SWR/J mice: segregation of the trait and identification of a linked locus on Chromosome 4. Mamm Genome. 1994b;5:546–552. doi: 10.1007/BF00354928. [DOI] [PubMed] [Google Scholar]
- 47.West DB, Truett GE, Goudey-Lefevre J, York B. Loci on chromosomes 4, 7, 9, 12 & 15 control a significant proportion of the dietary obesity phenotype in the mouse. FASEB. 1995;9:A722. [Google Scholar]
- 48.Withham B (1990) Coat colors of sublines of 129 mice. JAX notes, no. 441
- 49.York B, Lei K, West DB. Sensitivity to dietary obesity linked to a locus on Chromosome 15 in a CAST/Ei × C57BL/6J F2 intercross. Mamm Genome. 1996;7:677–681. doi: 10.1007/s003359900204. [DOI] [PubMed] [Google Scholar]
- 50.York B, Lei K, West DB. Inherited non-autosomal effects on body fat in F2 mice derived from an AKR/J × SWR/J cross. Mamm Genome. 1997;8:726–730. doi: 10.1007/s003359900554. [DOI] [PubMed] [Google Scholar]
- 51.Zeng Z-B. Theoretical basis for separation of multiple linked gene effects in mapping quantitative trait loci. Proc Natl Acad Sci USA. 1993;90:10972–10976. doi: 10.1073/pnas.90.23.10972. [DOI] [PMC free article] [PubMed] [Google Scholar]