

Summary
Listeria monocytogenes (Lm) evade microbicidal defences inside macrophages by secreting a poreforming cytolysin listeriolysin O (LLO), which allows Lm to escape vacuoles. LLO also inhibits Lm vacuole fusion with lysosomes, which indicates LLO alters vacuole chemistry prior to release of Lm into cytoplasm. Using fluorescent probes to measure membrane permeability, calcium and pH, we identified small membrane perforations in vacuoles containing wild-type but not LLO-deficient (hly-) Lm. The small membrane perforations released small fluorescent molecules and persisted for several minutes before expanding to allow exchange of larger fluorescent molecules. Macropinosomes and hly- Lm vacuoles acidified and increased their calcium content ([Ca2+]vac) within minutes of formation; however, the small perforations made by LLO-expressing bacteria increased vacuolar pH and decreased [Ca2+]vac shortly after infection. Experimental increases in vacuolar pH inhibited Lm vacuole fusion with lysosomes. The timing of perforation indicated that LLO-dependent delays of Lm vacuole maturation result from disruption of ion gradients across vacuolar membranes.
Introduction
Phagocytosis of microbes into a membrane-enclosed compartment is the first step of many in the macrophage’s response to infection (Underhill and Ozinsky, 2002). The fate of microbes depends on host cell functions that modify the phagosomal lumen, including acidification, fusion with endosomes and lysosomes, and delivery of microbicidal molecules (Desjardins et al., 1994; Meresse et al., 1999; Vieira et al., 2002; Luzio et al., 2003; Scott et al., 2003). An acidic pH is necessary for optimal activity of lysosomal enzymes (Mellman et al., 1986; Kornfeld and Mellman, 1989). Many pathogens survive the harsh environment of the phagosome by inhibiting maturation, halting acidification, or escaping into the cytosol (Duclos and Desjardins, 2000; Sansonetti, 2001; Scott et al., 2003).
Listeria monocytogenes (Lm) evade phagosomal degradation in macrophages by forming holes in the phagosomal membrane that allow the bacteria to enter the cytosol. Escape from the phagosome (Lm vacuole) depends on the secreted cholesterol-dependent cytolysin (CDC) listeriolysin O (LLO) (Portnoy et al., 1988; Cossart et al., 1989; Gedde et al., 2000). Mutants lacking LLO (hly- Lm) cannot escape from macrophage vacuoles, and Bacillus subtilis engineered to secrete LLO are capable of escaping vacuoles (Bielecki et al., 1990). Lm escape can be inhibited by alkalinization of the phagosome using bafilomycin A1, an inhibitor of vacuolar ATPases (Beauregard et al., 1997). This may be due to the acidic pH optimum for cytolytic activity by LLO (Portnoy et al., 1992), or to other pH-dependent processes that affect LLO function indirectly.
It is uncertain how LLO allows bacterial entry from vacuoles into cytoplasm. The mechanism may be similar to that proposed for membrane lysis by the CDC perfringolysin O (PFO) (Rossjohn et al., 1997; Heuck et al., 2003). PFO monomers bind to cholesterol-containing membranes, oligomerize (20–80 monomers), then insert into the membrane to form a 20–30 nm diameter pore. Subsequent cell lysis by PFO is presumed to occur as a consequence of colloid osmotic pressure. Analogous processes may occur inside Lm vacuoles.
Listeria monocytogenes escape is enhanced by two bacterial C-type phospholipases, termed PlcA and PlcB (Smith et al., 1995). Lm mutants deficient in a phosphati-dylinositol-specific phospholipase C (PlcA), escape from vacuoles less frequently than wild-type Lm (Smith et al., 1995). Mutants in PlcB, a broad-range phospholipase C, accumulate in double-membrane vesicles formed after the bacterium invades a neighbouring cell, indicating a role for PlcB in escape from secondary phagosomes during cell-to-cell spread (Vazquez-Boland et al., 1992). Mutants lacking both PlcA and PlcB have a reduced frequency of escape from the phagosomal compartment when compared with single mutants and wild-type Lm (Smith et al., 1995). It has been suggested that the PlcA functions in coordination with LLO to activate host cell pathways that facilitate escape (Wadsworth and Goldfine, 2002). Accordingly, delivery of PlcA via the pores formed by LLO could facilitate subsequent steps in the escape process.
The timing of LLO-mediated Lm escape from the vacuole has been estimated by several methods. Timed addition of bafilomycin A1 to Lm-infected macrophages showed that escape could be inhibited for up to 30 min after infection (Myers et al., 2003). When pH was measured in Lm vacuoles using a small, fluorescent dye (524 MW), the acidic vacuoles increased pH rapidly, 10–15 min after infection, and just before the probe was released into cytoplasm (Beauregard et al., 1997). A method that measured access of vacuolar Lm to fluorescent proteins expressed in macrophage cytoplasm indicated that, as early as 15 min after infection, LLO created openings large enough to exchange proteins (Henry et al., 2006). These studies indicate that LLO works soon after arrival of Lm into a vacuole, and that Lm escape proceeds by expansion of small perforations. However, it remains undetermined whether that expansion happens abruptly or in stages.
Recent studies indicate that LLO slows the maturation of vacuoles prior to escape of Lm into macrophage cytoplasm (Henry et al., 2006). A YFP-chimera of a phage cell wall-binding domain (CBD-YFP), expressed in the cytoplasm, detected bacteria which became exposed to the cytosolic space. Vacuoles containing wild-type Lm did not fuse with lysosome-associated membrane protein-1 (LAMP1)-positive compartments as quickly as did vacuoles containing hly- Lm. This LLO-dependent inhibition of Lm vacuole maturation was evident even before LLO had created openings in membranes large enough to admit CBD-YFP. This is consistent with recent studies showing that streptolysin O, a CDC from group A Streptococcus, inhibits phagosome–lysosome fusion in epithelial cells (Hakansson et al., 2005). The mechanism by which LLO inhibits lysosome fusion remains undetermined.
Increasing pH inhibits fusion of phagosomes and endosomes with lysosomes (Gordon et al., 1980; Mellman et al., 1986; Tapper and Sundler, 1995; van Weert et al., 1995; van Deurs et al., 1996). Although vacuolar calcium levels are unknown, calcium has been implicated in endosome fusion (Colombo et al., 1997; Luzio et al., 2003). Depletion of vacuolar calcium blocked endosome fusion and maturation of the vacuole (Peters and Mayer, 1998; Holroyd et al., 1999; Pryor et al., 2000). Accordingly, we hypothesize that the small perforations made by LLO early in infection increase pH and decrease Ca2+ levels within the vacuole, consequently inhibiting vesicle fusions necessary for vacuole maturation.
The level of calcium within phagosomes and endosomes has been difficult to measure due to the pH-dependence of fluorescent calcium indicators. In the cytoplasm, where the pH remains constant at 7, calcium is maintained at low resting levels (≈100 nM) (Berridge et al., 2000). In vacuolar compartments, where pH varies, measurement of Ca2+ requires correction of Ca2+-sensitive fluorophores by coincident measurement of pH (Christensen et al., 2002). Such measurements indicated that lysosomal calcium was 600 μM. Concentrations of calcium in macropinosomes have not been reported.
We show here that LLO-dependent perforation of the vacuolar membrane initially creates pores that allow release of a small probe [Lucifer Yellow (LY), molecular weight 522] into cytoplasm but retain larger probes for several minutes (fluorescent dextrans, average molecular weight 10 000). This size selectivity allowed vacuolar retention of dextrans labelled with fluorescent indicator dyes, and measurement of free calcium and pH in macropinosomes and Lm vacuoles. Measurements of individual organelles revealed early effects of LLO on pH and calcium levels within Lm vacuoles. Thus, for a brief period before the bacterium gains complete access to cytoplasm, LLO makes small perforations that allow exchange of small molecules, including protons and calcium ions, which inhibit vacuole fusion with lysosomes.
Results
Listeriolysin O perforates Lm vacuoles before lysing them
Previous experiments that used hydroxypyrene trisulphonic acid (HPTS; 524 MW) to measure pH detected perforation of the Lm vacuole as an increase in pH followed shortly by release of HPTS into cytoplasm (Beauregard et al., 1997). It was unclear from those studies whether release of HPTS occurred through small perforations or more complete disruptions of the vacuolar membrane. To characterize the transitions of membrane disruptions by LLO during Lm escape, we measured the timing of release from the Lm vacuole of two pH-insensitive fluorescent probes of different size: Texas Red dextran (TRDx; average molecular weight 10 000) and LY (molecular weight 522). Lm vacuoles retained TRDx for 25 min or longer after infection (Fig. 1). However, vacuoles containing wild-type Lm, but not those containing LLO-deficient Lm (hly-), lost LY before TRDx (Fig. 1). As LY escaped the vacuolar compartment, its fluorescence increased in the cytosol, indicating that LY was lost by perforation rather than by vacuole merger into larger endocytic compartments. It was more difficult to distinguish these possibilities for the loss of TRDx from vacuoles.
Fig. 1.
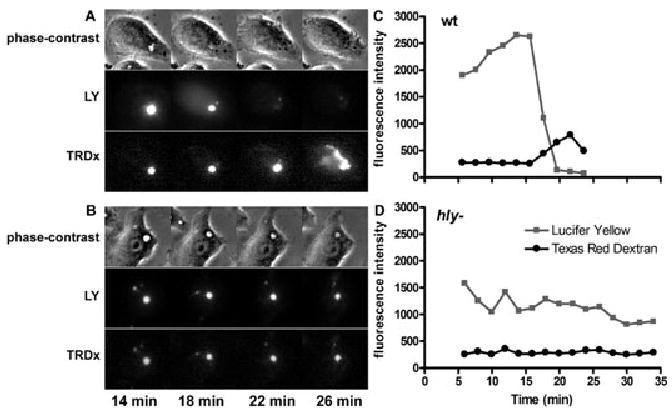
Retention of larger probes in perforated vacuoles. Macrophages were infected for 3 min with Lm in the presence of Texas Red dextran (TRDx; average molecular weight 10 000) and Lucifer Yellow (LY; molecular weight 522). Excess probes and Lm were washed away, Lm vacuoles were located by phase-contrast, and then fluorescence images of LY and TRDx were taken every 2 min.
A and B. Showing representative wild-type and hly- Lm vacuoles, respectively, at the indicated times after infection.
C and D. The fluorescence intensity of each fluorophore was measured in the vacuole over time. TRDx was retained within Lm vacuoles for = 25 min. The increase in TRDx fluorescence in C was due to a decrease in vacuole size without loss of TRDx. LLO-mediated perforation of vacuolar membranes was indicated by loss of LY prior to loss of TRDx.
Our goal was to characterize the role of LLO, PlcA and PlcB in early perforation and escape of Lm vacuole. It is not known how PlcA and PlcB contribute to Lm escape from vacuoles. Using a phalloidin-binding assay to detect cytosolic bacteria (Jones and Portnoy, 1994), we measured the abilities of wild-type Lm and various mutant strains (hly, plcA-, plcB-, plcA-plcB-, hly-plcA-plcB-) to reach the cytosol in J774 macrophages (Table 1). On average, wild-type Lm escaped the vacuole 86% of the time, whereas strains lacking LLO (hly- and hly-plcA-plcB-) never escaped. Mutants lacking PlcA or PlcB escaped less frequently than wild-type Lm (P < 0.05, T-test), but similarly to each other. Strains lacking both plcA and plcB showed a decrease in their ability to escape from vacuoles compared with wild-type Lm, which further indicated a contribution of the phospholipases to efficient Lm escape.
Table 1.
Vacuole escape and perforation by Lm.
| LY lost before TRDx
|
||||
|---|---|---|---|---|
| Vacuole | Escape frequencya | Frequencyb | Time of LY lossc | LY-TRDx intervald |
| Macropinosomes | NA | 0/19 | – | – |
| hly- Lm | 0* | 0/30 | – | – |
| hly-plcA-plcB- Lm | 0* | 0/9 | – | – |
| Wild-type Lm | 85 ± 5 | 27/54 | 15 ± 5 | 9 ± 4 |
| plcA- Lm | 70* ± 6 | 11/22 | 15 ± 5 | 5 ± 3 |
| plcB- Lm | 68* ± 7 | 12/19 | 14 ± 5 | 7 ± 3 |
| plcA-plcB- Lm | 57* ± 8 | 7/16 | 17 ± 5 | 9 ± 4 |
Significantly different from wild-type Lm (P < 0.05).
The fraction of Lm-infected macrophages that contained TR-phalloidin-positive bacteria (100 × mean ± SD from nine experiments).
The number of time-course experiments in which LY was lost from the vacuole before TRDx, divided by the number of time-course experiments recorded.
The average time in minutes after the addition of fluorophores when LY was lost selectively from the vacuole.
The interval of time between loss of LY and TRDx when the event occurred within 30 min.
NA, not applicable.
Measurement of the times after infection that LY or TRDx were lost from vacuoles indicated an early, size-selective perforation of the Lm vacuolar membranes by LLO. In approximately half of the vacuoles containing LLO (wild-type, plcA-, plcB-, plcA-plcB- Lm vacuoles) LY was lost before TRDx, whereas vacuoles lacking LLO (macropinosomes, hly- Lm vacuoles, hly-plcA-plcB- Lm vacuoles) failed to release LY prior to TRDx (Table 1 and Fig. 2). In those instances when LY was lost prior to TRDx, the LY loss occurred between 8 and 28 min after infection. The perforations remained small enough to exclude TRDx for variable lengths of time, often exceeding the 30 min observation period. Most macropinosomes and hly- or hly-plcA-plcB- Lm vacuoles lost TRDx after 30 min, whereas wild-type, plcA-, plcB-, plcA-plcB- Lm vacuoles usually lost TRDx before 30 min. The loss of TRDx from the Lm vacuole could represent larger perforations or fusion of the vacuoles with large endocytic compartments. PLC-deficient Lm vacuoles showed similar timing of loss for LY and TRDx in comparison to wild-type Lm vacuoles. Thus, during the first 20 min after infection, about the time Lm vacuoles begin to fuse with LAMP1-positive compartments (Henry et al., 2006), vacuolar LLO created membrane perforations small enough to release LY.
Fig. 2.

Perforation and lysis of Lm vacuoles. Lucifer Yellow (LY) was released before Texas Red dextran (TRDx) in an LLO-dependent manner. Macrophages were infected with Lm plus LY and TRDx for 3 min, and then external bacteria and probes were washed away. Average fluorescence intensities of LY and TRDx were measured in phagosomes over a 30 min period. Horizontal bars represent individual vacuoles for each Lm strain. Dark grey bars represent the presence of both LY and TRDx within the compartment, starting at the time of the experiment. The transition from a dark grey bar to white represents loss of both LY and TRDx at the time indicated (if the vacuoles retained both dyes after 30 min, the bar is shown up to 30 min). The transitions from dark to light grey bars represent the times when LY was lost from the compartment but TRDx was still present. The transition from light grey bar to white represents the loss of TRDx from a compartment that had already lost LY (if this event occurred after 30 min, the bar is shown up to 30 min).
Measurements of pH and calcium in macropinosomes and Lm vacuoles
The pH-dependent affinities of fluorescent calcium-sensitive probes preclude simple ratiometric fluorescence measurement of vacuolar calcium. However, in compartments of variable pH, it is possible to measure both pH and calcium and to use the pH data to correct the calcium-probe’s binding affinity (Christensen et al., 2002). Those methods were used to measure pH and calcium in individual macropinosomes and Lm vacuoles (Fig. 3).
Fig. 3.
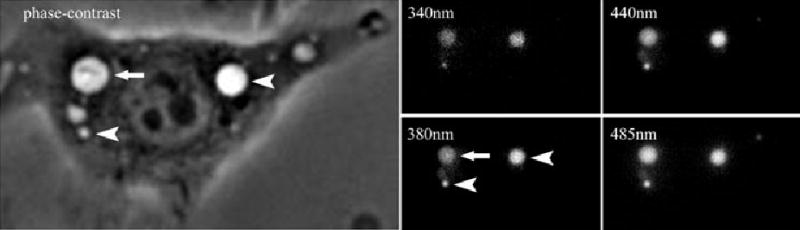
Images used to measure vacuolar pH and calcium. Macrophages were infected for 3 min with Lm plus mixtures of fura dextran, Oregon green dextran and fluorescein dextran, and then washed free of bacteria and probes. Five images were then collected in rapid succession: phase-contrast and 510 nm fluorescence, excited at 340 nm, 380 nm, 440 nm, 485 nm. The ratio of 510 nm fluorescence from excitation 340/380 and excitation 485/440 were converted into calcium and pH, respectively, based upon calibrations. Shown are representative images of an Lm vacuole (phase-bright vacuole with phase-dense rod inside, arrow) and two macropinosomes (phase-bright vacuoles, arrowheads).
Calcium concentrations are low in the cytosol (≈ 100 nM) and high in lysosomes (≈ 0.6 mM) (Christensen et al., 2002), but unknown for Lm vacuoles and macropinosomes. Thus, before the effects of LLO on vacuolar pH and calcium could be measured, it was first necessary to characterize changes in pH and calcium in endocytic compartments lacking LLO. Macropinosomes and non-perforated Lm vacuoles (containing hly- Lm) were measured during the first 30 min after their formation. Consistent with earlier studies (Tsang et al., 2000), macropinosomes acidified from pH 7.0–4.5, indicating a rapid accumulation of protons (pH = –log [H+]; Fig. 4A). Macropinosomes showed a corresponding accumulation of calcium from 10 to 100 μM (Fig. 4B), indicating that macropinosomes first lose calcium after internalizing extracellular medium (1 mM calcium), then accumulate it as the organelle matures. Vacuoles containing hly- Lm or hly-plcA-plcB- Lm showed similar patterns of acidification and increasing [Ca2+]vac (Fig. 4). These data indicated that, as in lysosomes (Christensen et al., 2002), calcium concentrations in macropinosomes and hly- Lm vacuoles are coordinated with the regulation of pH.
Fig. 4.

pH and calcium measurements in macropinosomes and Lm vacuoles. Macrophages were pulse-labelled with fluorescent probes for 2 min (macropinosomes) or 3 min plus Lm (Lm vacuoles). Cells were then washed free of probes and bacteria, then images were recorded at the indicated times (after the addition of the probes).
A and B. Showing pH and calcium concentrations, respectively, in macropinosomes; each point represents one macropinosome. C and D. Cumulative measurements of pH (C) and calcium (D) are shown for 3 min intervals (mean ± SEM) of macropinosomes (solid black line), hly- Lm (dotted black line) and hly-plcA-plcB- Lm (dotted grey line), measured as in A and B. pH decreased and calcium levels increased similarly in macropinosomes and all vacuoles containing LLO-deficient Lm.
pH and calcium levels are altered early in Lm vacuoles
We hypothesized that the first small holes made by LLO in Lm vacuoles allow equilibration of protons and calcium between vacuoles and cytoplasm, consequently disrupting ion gradients necessary for vacuole fusion with lysosomes. To determine whether LLO perforations alter vacuolar ion concentrations early enough to affect vacuole fusion with lysosomes, we measured pH and [Ca2+]vac in LLO-positive Lm vacuoles at various times after infection. Because the large fluorescent dextrans were retained in perforated vacuoles longer than small dyes, pH and [Ca2+]vac could be measured well into the escape process. Vacuoles containing each Lm strain were measured up to 25 min post infection, at which time it became difficult to locate vacuoles (Fig. 6C). The diminishing number of measurable compartments was probably due either to fusion of vacuoles with other endocytic compartments or to membrane perforation and release of dextrans by LLO. Because of the heterogeneity of vacuole perforation by LLO (Table 1 and Fig. 2), many vacuoles containing wild-type, plcA-, plcB-, or plcA-plcB- Lm reported pH and [Ca2+]vac similar to hly-plcA-plcB- Lm vacuoles, whose values are indicated in Fig. 5 by grey lines marking one standard deviation (SD) from the mean. This required that we look for LLO-dependent changes in pH and calcium among a subset of Lm vacuoles. Early after infection many vacuoles containing LLO-positive Lm showed higher pH and lower [Ca2+]vac than the control vacuoles (Fig. 5), indicating that early perforations were allowing the equilibration of pH and calcium with cytoplasm. To quantify the deviations of this subset of vacuoles from the normal patterns of vacuole acidification and calcification, we measured at different times after infection the fraction of Lm vacuoles whose values for pH were greater than one SD from the mean for hly-plcA-plcB- Lm vacuoles, as well as the fraction of Lm vacuoles whose [Ca2+]vac were lower than one SD from the mean for hly-plcA-plcB- Lm vacuoles. This method was not informative for times up to 10 min post infection, because during that interval the normal acidification of hly-plcA-plcB- Lm vacuoles created a wide range of values (Fig. 6A and B). However, between 10 and 15 min after infection, a larger fraction of the vacuoles containing LLO-positive Lm showed higher pH than did vacuoles lacking LLO (Fig. 6A and B). Of control vacuoles (hlyplcA-plcB- Lm), 12–14% had pH more than one SD above the mean. In contrast, 31% of wild-type Lm vacuoles fell into this category, increasing to 53% in the period between 15 and 20 min post infection (Fig. 6A). Measurements of [Ca2+]vac in wild-type Lm and hly-plcA-plcB- Lm showed similar patterns, consistent with the hypothesis that wild-type Lm were capable of lowering [Ca2+]vac within minutes of entering macrophages (Fig. 6B). Although strains lacking PlcA and/or PlcB showed patterns similar to wild-type Lm, they consistently had a smaller fraction of vacuoles causing the disruption in pH and [Ca2+]vac. This indicated that PlcA and PlcB may have a small contribution to the early perforation of the vacuole. Together these data demonstrate that, in a subpopulation of Lm vacuoles, membrane perforations by LLO changed pH and [Ca2+]vac at a time that preceded inhibition of lysosome fusion.
Fig. 6.
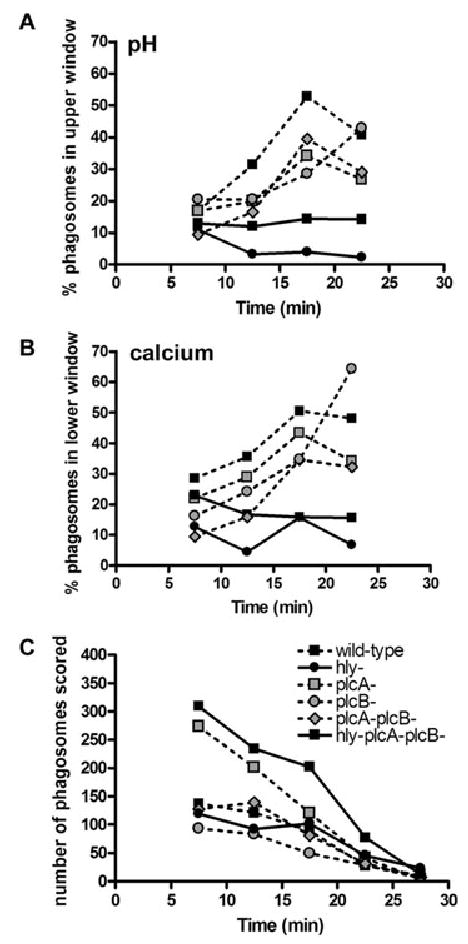
Listeria monocytogenes vacuole pH and calcium levels compared with hly-plcA-plcB- Lm vacuoles. Lm strains containing LLO created more vacuoles with a higher pH and lower [Ca2+]vac levels than did strains lacking LLO. pH and [Ca2+]vac data obtained from vacuoles of the indicated Lm strains are compared with the data from control hly-plcA-plcB- Lm vacuoles.
A. The percentage of vacuoles with pH greater than that defined by the +1 SD line obtained from hly-plcA-plcB- Lm (upper window), for 5–10, 11–15, 16–20 or 21–25 min after infection.
B. The percentage of vacuoles with [Ca2+]vac levels less than that defined by the −1 SD line obtained from hly-plcA-plcB- Lm (lower window), for 5–10, 11–15, 16–20 or 21–25 min after infection. C. The total number of vacuoles collected during each time interval.
Fig. 5.
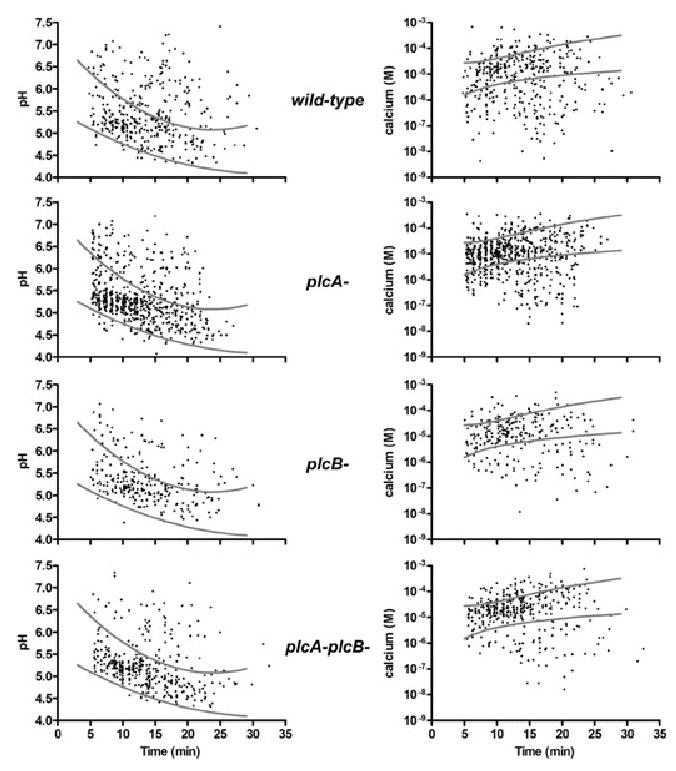
pH and calcium measurements in Lm vacuoles. The presence of LLO decreased the amount of protons and calcium ions within the vacuole (i.e. higher pH and lower [Ca2+]vac) when compared with hly-plcA-plcB- Lm vacuoles (Fig. 4). Macrophages were pulsed 3 min with Lm (wild-type, plcA-, plcB-, or plcA-plcB-) plus pH- and calcium-sensitive probes. Images were taken over 30 min and converted to pH and [Ca2+]vac; each point represents one organelle. Grey lines represent the ± 1 standard deviation (SD) from the mean for data obtained from hly-plcA-plcB- Lm vacuoles. These lines were used to determine the fraction of Lm vacuoles outside the SD of hly-plcA-plcB- Lm vacuoles.
Increasing Lm vacuolar pH inhibited lysosome fusion
We hypothesize that the small perforations made by LLO inhibited lysosome fusion by increasing pH and decreasing calcium. Accordingly, Lm vacuole fusion with lysosomes should be inhibited by treatments that increase pH of acidic compartments. Lysosomes were labelled by incubating macrophages with TRDx for 30 min, washing away excess dye, and then chasing overnight. TRDx-loaded macrophages were infected with hly- Lm for 3 min and fusion with lysosomes was detected over the next 30 min by scoring TRDx-positive Lm vacuoles (Fig. 7A). hly- Lm vacuoles began to fuse with lysosomes after 10–15 min (Fig. 7B). Increasing pH of acidic compartments using NH4Cl or Bafilomycin A1 inhibited lysosome fusion with hly- Lm vacuoles.
Fig. 7.

Increase in Lm vacuole pH inhibits lysosome fusion. Lysosomes were labelled by incubating macrophages with TRDx for 30 min, washing away excess dye, and then chasing overnight. TRDx-loaded macrophages (untreated, treated with NH4Cl, or treated with BAF) were infected with wild-type or hly- Lm (plus pH probes where indicated) for 3 min. The average fluorescence intensities of the phagosome (Ip) and of the cell (Ic) were measured over time in individual cells, and the ratio Ip/Ic was calculated.
A. Top panel shows representative phase-contrast and TRDx images of positive lysosome fusion with Lm vacuole and bottom panel shows negative lysosome fusion with Lm vacuole.
B. The Ip/Ic measurement of lysosome fusion of hly- Lm in untreated, treated with NH4Cl, or treated with Bafilomycin A1 macrophages indicated that lysosome fusion required acidification.
C. pH correlated inversely with lysosome fusion in wild-type Lm vacuoles measured 10–30 min after infection.
This also predicted an inverse correlation between Lm vacuole pH and fusion with lysosomes. pH was measured in coordination with lysosome fusion by infecting TRDx-loaded macrophages with wild-type Lm and pH-indicator probes. In Lm vacuoles measured 10–30 min after infection, those with higher pH showed decreased fusion with lysosomes (Fig. 7C). This is consistent with a mechanism in which the small perforations made by LLO inhibited fusion with lysosomes by disrupting gradients of pH and calcium across Lm vacuolar membranes.
Discussion
This work demonstrates that LLO causes small perforations in membranes of newly formed Lm vacuoles that persist for variable periods before expanding into larger membrane disruptions. Release of small molecules from vacuoles through these small perforations may afford Lm protection in an otherwise harsh environment, by preventing accumulation of ions or microbicidal compounds. Consistent with this mechanism, we show here that vacuolar LLO increases pH and decreases [Ca2+]vac early enough to inhibit Lm vacuole fusion with lysosomes.
Persistent small perforations in Lm vacuoles
Listeriolysin O-dependent early perforation of membranes was indicated by differential release of small (LY) and large (TRDx) probes from vacuoles containing LLO-expressing Lm. Early perforation was also indicated by an increase in pH and a decrease in calcium concentration in the Lm vacuole, consistent with the equilibration of protons and calcium ions across vacuolar membranes.
Our data suggest that poreformation by LLO differs from the mechanism proposed for PFO (Rossjohn et al., 1997; Heuck et al., 2003). If, like PFO, LLO made 20–30 nm diameter pores in the membrane, then both LY and TRDx should have been released concurrently or in rapid succession. The slow, sequential departure of LY and TRDx demonstrated that a small perforation persists for about 5 min before expanding into a larger pore. Bacterial phospholipases did not appear to influence the early perforation, as neither plcA-, plcB- nor plcA-plcB-Lm vacuoles differed from wild-type Lm vacuoles in the frequency or timing of selective LY release. The phospholipases may contribute to later stages in the escape process, such as the expansion of larger pores into membrane disruptions that allow bacteria to enter the cytosol.
Calcium and pH in macropinosomes and phagosomes
Calcium is a key second messenger in host cells and has been shown, along with pH, to be an important regulator of many cell processes (Berridge et al., 2000). We found that in both macropinosomes and LLO-deficient Lm vacuoles, pH decreased and [Ca2+]vac increased at similar rates (Fig. 4). Macropinosomes attained low [Ca2+]vac (2 μM) within 5 min of their formation, suggesting that much of the millimolar calcium captured from the extracellular medium is released into the cytosol just after macropinosomes form. The rapid rise in [Ca2+]vac that follows macropinosome formation, reaching 70 μM within 30 min and 600 μM by 2 h (Christensen et al., 2002), indicates that calcium is then pumped back into the vacuolar compartment.
We consider it unlikely that the fura dextran captured inside macropinosomes lowers [Ca2+]vac of nascent macropinosomes. Christensen et al. showed that at low pH the affinity of fura dextran for calcium is decreased. The number of calcium-binding sites on internalized fura molecules (160 μM at 1 mg ml−1 fura dextran; ~1.6 fura moieties per molecule of 10 kDa dextran) is much less than the number of calcium ions captured from extracellular medium (2 mM calcium). In addition, the optimal [Ca2+] measurement using fura dextran is within one log unit of the pH-sensitive KD. We were able to make the majority of calcium measurements within the optimal range and we discarded the minority that fell outside.
The high levels of calcium measured in endosomes are consistent with previous studies implicating calcium in endosome and lysosome fusion. Calcium depletion from endocytic compartments inhibits their maturation and fusion with lysosomes (Peters and Mayer, 1998; Holroyd et al., 1999; Pryor et al., 2000). Acidic pH is also necessary for vacuole maturation. Studies of lysosomal pH and calcium indicated that the proton gradient across endosomal membranes was necessary to sustain high concentrations of calcium in lysosomes (Christensen et al., 2002). This dependence of [Ca2+]vac on vacuolar pH may explain why conditions that elevate pH of acidic compartments inhibit phagosome–lysosome fusion (Gordon et al., 1980; Mellman et al., 1986; Tapper and Sundler, 1995; van Weert et al., 1995; van Deurs et al., 1996).
Disruption of ion gradients by vacuolar LLO
Localized release of calcium in the vicinity of the vacuolar membrane and during critical stages of the maturation sequence is thought to be responsible for fusion (Vieira et al., 2002). We hypothesize the delocalized release of calcium by LLO inhibits fusion events. Our results provide a possible mechanism by which LLO stalls Lm vacuole fusion with lysosomes. Some wild-type Lm vacuoles deviated from the patterns of acidification and calcification seen in LLO-deficient Lm vacuoles, indicating that LLO perforations of membranes allowed ions to equilibrate with the cytosol. The ion release occurred early enough to affect fusion of vacuoles with lysosomes. Consistent with earlier studies, we found that inhibiting acidification of the Lm vacuole inhibited lysosome fusion. Moreover, in the period when hly- Lm vacuoles fuse with lysosomes (10–30 min post infection), vacuolar pH correlated inversely with lysosome fusion. This indicates that efflux of H+ and Ca2+ into the cytoplasm disrupts proton and calcium concentration gradients necessary for vacuole fusion with the lysosomes (Fig. 8). By analogy, this could also explain how streptolysin O inhibits fusion of vacuoles containing Streptococcus pyogenes with lysosomes in epithelial cells (Hakansson et al., 2005).
Fig. 8.

Small perforations inhibit Lm vacuole maturation. In macrophage vacuoles, Lm secretes LLO, which creates small perforations in vacuolar membranes that allow exchange of calcium, protons and small dyes (LY and HPTS) into the cytosolic space. Subsequent expansion creates larger perforations that allow exchange of macromolecules (TRDx and CBD-YFP, cell-binding domain from Lm phage) and the eventual delivery of the bacterium into the macrophage cytosol. Transitions in Lm vacuole permeability are indicated by the vertical arrows; and the molecules that can exchange across membranes at each stage are indicated at corresponding positions on the left. Lysosome fusion with vacuoles can inhibit LLO function, but disruption of ion gradients by LLO inhibits fusion of Lm vacuoles with lysosomes. Moreover, LLO requires vacuole acidification to perforate membranes but increases vacuolar pH after small perforations have formed. These variable and counteracting activities may explain the heterogeneities in the timing and efficiency of Lm escape.
The small perforations made by LLO may also protect vacuolar Lm from reactive oxygen species (ROS). This protection could occur by direct leakage of ROS from Lm vacuoles, preventing them from reaching microbicidal concentrations. Alternatively, membrane perforations could inhibit other ion concentration changes that result from ROS generation by the NADPH oxidase (Reeves et al., 2002).
Heterogeneities of Lm vacuoles
The interactions between Lm and macrophages are highly variable. Only some of the bacteria entering macrophages escaped vacuoles into cytosol. Half of the vacuoles containing LLO-expressing Lm exhibited the selective depletion of LY and TRDx. This heterogeneity of Lm escape may occur because some bacteria arrive in vacuoles better prepared to deliver LLO. Alternatively, it may reflect variations in the vacuolar compartment dynamics, or in the macrophage’s ability to deliver ROS into the vacuolar lumen (Myers et al., 2003).
Experimental procedures
Reagents
The ionophores ionomycin, valinomycin and nigericin and the fluorophores Texas Red-phalloidin (TR-P), TRDx, LY, DAPI, fura dextran, Oregon green dextran, fluorescein dextran (dextran; MW = 10 kDa) were obtained from Molecular Probes (Eugene, OR). Bafilomycin A1 (BAF) was obtained from Calbiochem (La Jolla, CA).
Bacterial strains
The L. monocytogenes wild-type strain DP-L10403, hly- deletion strain DP-L2161, plcA- deletion strain DP-L1552, plcB- deletion strain DP-L1935, plcA-plcB- deletion strain DP-L1936, hly-plcA-plcB- deletion strain DP-L2319 used in this study were gifts from Daniel Portnoy (University California, Berkeley).
Bacterial preparation
Listeria monocytogenes were grown overnight at room temperature in brain heart infusion (BHI) broth. They were subcultured the next day and grown for ~1 h to an OD600 of 0.500 at 37° C. Sub-cultured bacteria (1 ml) were washed three times in Ringer’s buffer (RB; 155 mM NaCl, 5 mM KCl, 2 mM CaCl2, 1 mM MgCl2, 2 mM NaH2PO4, 10 mM Hepes and 10 mM glucose, pH 7.2).
Cell culture
J774A.1 macrophages were obtained from ATCC (Manassas, VA), and grown in Dulbecco’s modified Eagle medium (DMEM, Invitrogen, Carlsbad, CA), with 10% heat-inactivated FBS (Invitrogen) and 100 unit ml−1 of penicillin/streptomycin mixture (Sigma Chemical, St Louis, MO), at 37° C with 5% CO2. Cells were plated the day before the experiment onto 25 mm cover-slips, in six-well plates, at 2 × 10⁵ cells per well, unless otherwise stated.
Phagosome escape assay
Macrophages were plated onto 13 mm coverslips at a density of 5 × 10⁴ cells per coverslip in a 24-well plate and incubated overnight. Macrophages were washed twice with RB and incubated with DMEM and 10% FBS without antibiotics at 37° C for 30 min. Lm were added to macrophages (multiplicity of infection ~0.1) for 15 min at 37° C. Coverslips were washed four times with RB and incubated with DMEM, 10% FBS and 25 μg ml−1 gentamicin for 90 min. Coverslips were washed four times with RB and fixed for 15 min at room temperature with cytoskeletal fix (30 mM HEPES, 10 mM EGTA, 0.5 mM EDTA, 5 mM MgSO4, 33 mM potassium acetate, 5% polyethylene glycol 400 and 4% paraformaldehyde). Cells were then washed three times with phosphate-buffered saline (PBS) and 2% goat serum, permeabilized with 0.3% Triton X-100 in PBS for 5 min at room temperature, washed three times and incubated for 15 min in PBS and 2% goat serum plus TR-P (2 U ml−1 from a 200 U ml−1 stock in methanol) and 4′,6-diamidino-2-phenylindole (DAPI; 2 μg ml−1 from a 100 μg ml−1 stock in water). They were then mounted on glass slides with Prolong Antifade (Molecular Probes). For each coverslip, 50 infected macrophages (i.e. containing DAPI-positive bacteria) were scored for the presence of escaped bacteria, as indicated by labelling of DAPI and TR-P.
Ratiometric imaging
Experiments used an inverted fluorescence microscope (Nikon TE300, Japan) equipped with transmitted light and mercury arc lamp with epifluorescence illumination. The excitation filter wheel (Lambda 10–2, Sutter Instruments, Novato, CA) held filters to measure pH and calcium (340 HT15, 380 HT15, 440 AF21, 485 DF22; Omega Optical, Brattleboro, VT). A dichroic mirror set (XF2031: 505DRLPXR, Omega Optical), with a long pass emission filter in the cube (510 nm) was used for all pH and calcium experiments.
Different excitation filters (436 DF10, 575 DF25, omega optical) and dichroic mirror (XF2044: 490–575DBDR, omega optical) were used to measure perforation of the phagosomal compartment. In the perforation experiments, a green emission filter (535 RDF45, omega optical) was used for 436 nm excitation and a red emission filter (645 RDF75, omega optical) was used for 580 nm excitation. Lysosome fusion was measured using excitation filter (S580/20x, Chroma Technology, Rockingham, VT), dichroic mirror (86006bs, Chroma Technology) and emission filter (S630/60 m, Chroma Technology). A cooled CCD camera (Quantix Photometrics, Tucson, AZ) collected images and Metamorph software (Universal Imaging, West Chester, PA) controlled the equipment and image processing.
Measurement of vacuole perforation by Lm
Macrophages on a coverslip were washed three times with RB. The coverslip was placed in a Leiden chamber (Harvard Apparatus, Cambridge, MA) and kept in RB at 37° C throughout the experiment. RB-washed macrophages were infected with a 100 μl mixture of Lm, TRDx (0.5 mg ml−1) and LY (0.5–1 mg ml−1) for 3 min (macropinosomes were labelled similarly, but without inclusion of Lm). After infection, cells were washed thoroughly with RB (30 times). Lm-infected macrophages were located by phase-contrast optics and macropinosomes by their green fluorescence. Three images were taken every 2 min for 30 min [phase-contrast, excitation (exc.) 436 nm/emission (em.) 510 nm (LY) and exc. 575 nm/em. 640 nm (TRDx)]. The images were corrected for bias, background and shading (see below), then regions of a fixed size were drawn around vacuoles and the average fluorescence intensities were transferred to a Microsoft Excel spreadsheet. The loss of dye was scored as a decrease of fluorescence to background levels.
Fluorescent labelling of macropinosomes and Lm vacuoles for pH/Ca2+ measurements
On the microscope, macropinosomes were labelled by pulsing macrophages for 2 min with a 100 μl mixture of 1 mg ml−1 fura dextran (calcium-sensitive fluorophore), 0.3 mg ml−1 fluorescein-dextran (pH-sensitive fluorophore, pKa = 6.4) and 0.3 mg ml−1 of Oregon green-dextran (pH-sensitive fluorophore, pKa = 5.0). Lm vacuoles were labelled by pulsing macrophages for 3 min with a 100 μl mixture of Lm, 1 mg ml−1 fura dextran, 0.3 mg ml−1 fluorescein-dextran and 0.3 mg ml−1 Oregon green-dextran. The cells were promptly washed with RB to remove extracellular dye and Lm.
Measurement of pH and calcium using ratiometric fluorescence microscopy
Following labelling and infection, images of fluorescently labelled phagosomes and macropinosomes were collected in the microscope. Lm vacuoles were located by phase-contrast; macropinosomes were located by fluorescence (exc. 485 nm, em. 510 nm). A phase-contrast image and four fluorescence images (exc. 485 nm, 440 nm, 380 nm, 340 nm; em. 510 nm) were collected at various times within 30 min of the addition of the probes. The 340 nm and 380 nm images were used to measure calcium and the 440 nm and 485 nm images were used to measure pH. Exposure times were 2 s for the 340 nm and 380 nm, and 200 ms for the 440 nm and 485 nm images. Background signals in the primary images were corrected in three steps before converting the images to maps representing pH or Ca2+. First, a bias image was taken by collecting images without a sample in place. A small signal was measured on the camera in the 340 nm and 380 nm images, probably due to some excitation light breakthrough. At 440 nm and 485 nm, however, the bias image simply represented read bias of the CCD camera. These bias images were subtracted from all data images. Second, a fluorescent background, due to adsorption of dye to the coverslip, was determined by measuring the fluorescence in cell-free regions of the bias-corrected images, that value was subtracted from the bias-corrected data images. Third, a shading correction was made to correct for the lamp’s uneven illumination across the field. The shading correction image was obtained by collecting images of a solution of fluorescent probes sandwiched between two coverslips separated by broken coverslip fragments. Bias-background corrected data images were then corrected for the illumination pattern observed in the shading images to give a flat image [Corrected Image = (Max value of Shade Image) × (Acquired Image/Shade Image)] (Hoppe et al., 2002).
The conversion of fluorescence images to pH/Ca2+ values was applied uniformly using an in-house processing routine developed in Metamorph. The bias-background-shading corrected images of 340 nm, 380 nm, 440 nm, 485 nm were added together into an ‘Add’ image, and then regions-of-interest were identified. The ‘Add’ image was intensity thresholded to identify fluorescent compartments. The threshold was used to make binary masks for the original images. For each intracellular compartment, a circular region-of-interest was drawn and the average fluorescence intensity was measured inside the mask and exported to Excel. In Excel, the 485 nm intensity was divided by 440 nm intensity for each organelle, giving the 485/440 ratio that could be converted to pH using the pH calibration. The 340 nm and 380 nm images were corrected for fluorescence bleed-through by fluorescein and Oregon green, obtained from the bleed-through calibration (explained below). The corrected 340 nm intensity was divided by the corrected 380 nm intensity. The 340/380 ratio was then converted into calcium concentration using the equation and values obtained by the calcium calibration (explained below).
Calibrations for macropinosomes and Lm vacuole pH were obtained as described previously (Beauregard et al., 1997; Christensen et al., 2002) with minor changes. To clamp vacuolar pH, a mixture of 10 μM nigericin, 10 μM valinomycin and pH calibration buffer (130 mM KCl, 1 mM MgCl2, 15 mM Hepes, 15 mM MES), at pH 7.2, was added to dye-labelled macrophages for 10 min. The four component images were then collected from approximately 50 fluorescent macropinosomes. The buffer was then replaced with new nigericin, valinomycin and calibration buffer, at pH 6.5, and after 10 min 50 more macropinosomes were imaged. This process was repeated using calibration solutions at pH 6.0, 5.5, 5.0, 4.5 and 4.0. The average 485/440 ratio from approximately 50 macropinosomes (pulse-labelled with fluorescein, Oregon green and Fura dextran for 10 min) was plotted against pH; the best fit line was used to convert the experimental 485/440 ratios (macropinosomes and Lm vacuoles) to pH. For any given pH, the measurable range of free calcium was one log above and below the KD. Thus, furadextran could report tens of micromolar calcium in the acidic organelles. We excluded all organelles outside of the 2-log dynamic range of calcium concentrations allowed at each pH, and this eliminated only about 5% of the organelles. We found that repeated exposure of cells to excitation light for calcium imaging inhibited perforation and escape, which precluded quantitative time-lapse microscopic studies. Instead, image series’ were collected from different cells at various times post infection, and the timing of changes in pH and vacuolar calcium ([Ca2+]vac) were inferred from the population of measured organelles.
Fluorescence excitation spectra often overlap. As such, linear correction factors can be applied to separate out these components (Hoppe et al., 2002). The only intensity wanted in the 340 nm and 380 nm channel is that from fura dextran. However, Oregon green dextran and fluorescein dextran, when excited at 340 nm and 380 nm, have a small but significant emission at 510 nm. The bleed-through calibration was done in the same manner as the pH calibration, except that fluorescent macropinosomes were obtained by pulsing macrophages with only the pH-sensitive fluorophores (0.3 mg ml−1 Oregon green dextran and 0.3 mg ml−1 fluorescein dextran). After transfer of pinosome fluorescence from the bias-background-shading corrected images to an excel spreadsheet, two functions of pH were calculated to relate the amount of fluorescence observed at exc. 340 nm and exc. 380 nm to that observed at exc. 440 nm and exc. 485 nm [α(pH) = I340/I440; β (pH) = I380/I440]. In experimental compartments (where fura, Oregon green and fluorescein were present), the α and β constants were subtracted, in a pH-dependent manner, from the fluorescence observed at 340 nm (I340) and 380 nm (I380) wavelengths to give the accurate corrected fluorescence observed for fura dextran alone (IC340 = I340 – α × I440; IC380 = I380 –β× I440).
To calibrate vacuolar calcium, macropinosomes were fluorescently labelled as described previously, using fura dextran, Oregon green dextran and fluorescein dextran. To clamp the cells at pH 7.2, a mixture of 10 μM nigericin, 10 μM valinomycin and pH calibration buffer with a pH of 7.2, was added for 10 min. To clamp at low calcium, a mixture of 10 μM ionomycin, 10 mM EGTA, in calibration buffer at pH 7.2 was added to the cells for 5 min. The five images were then taken to measure the calcium within the macropinosomes at low calcium (Rmin). To clamp at high calcium, a mixture of 10 μM ionomycin, 10 mM Ca2+, in pH calibration buffer at pH 7.2 was added to cells for 5 min. Images were then taken to measure calcium within the macropinosomes at high calcium (Rmax). Values for Rmin, Rmax and Q (the ratio of the fluorescence of the unbound probe at low and high calcium at 380 nm excitation, respectively) were used to calculate calcium concentration according to the method described previously using the equation [Ca2+] = KD × Q × [(R − Rmin)/(Rmax − R)] (Grynkiewicz et al., 1985). The KD for fura dextran was obtained from previous measurements (Christensen et al., 2002) and was based upon the pH measured in each organelle.
To achieve a normal distribution, which is necessary to calculate the SD, the pCa2+ = –log [Ca2+] was calculated. The average and SD were then obtained from the pCa2+ values, the average ± 1 SD was calculated, and then converted back into [Ca2+] by taking the antilog (10^– pCa2+).
Measurement of Lm vacuolar lysosome fusion
Lysosomes were labelled by incubating macrophages with 50 μg ml−1 TRDx for 30 min, washing away excess dye, and then chasing overnight. On the microscope, TRDx-loaded macrophages were infected with hly- Lm for 3 min, and then excess bacteria were washed away. Lm vacuoles were found through phase-contrast and then subsequent phase-contrast and fluorescence images (580 exc. and 630 em.) were taken over a 30 min period. Macrophages were either untreated, treated with 10 mM NH4Cl (made fresh for each coverslip and added 5 min before and throughout experiment), or treated with 500 nM BAF (added to macrophages 1 h before experiment). The average intensities in the TxRed images of the Lm vacuole (Ip) and of the entire cell (Ic) were measured and the ratio of Ip/Ic was calculated for each vacuole. Ip/Ic > 1.0 indicated vacuole fusion with lysosomes.
When measuring pH and lysosome fusion, lysosomes were loaded with TxRed, then macrophages were infected with either wild-type or hly- Lm plus pH probes (0.3 mg ml−1 fluorescein dextran and 0.3 mg ml−1 Oregon green dextran) for 3 min and then washed away. Lm vacuoles were located by phase-contrast optics and then subsequent phase-contrast and fluorescent images (580 exc. and 630 em; 440 exc. and 510 em; 485 exc. and 510 em.) were taken over a 30 min period. Lysosome fusion and pH were measured as stated above.
Acknowledgments
Supported by NIH Grant AI-35950 to J.A.S. A.D.H. was funded in part by the UM Training Program in Rheumatology. The authors thank Drs Rebecca Henry and Kyung-Dall Lee for helpful suggestions.
References
- Beauregard KE, Lee KD, Collier RJ, Swanson JA. pH-dependent perforation of macrophage phagosomes by listeriolysin O from Listeria monocytogenes. J Exp Med. 1997;186:1159–1163. doi: 10.1084/jem.186.7.1159. [DOI] [PMC free article] [PubMed] [Google Scholar]
- Berridge MJ, Lipp P, Bootman MD. The versatility and universality of calcium signalling. Nat Rev Mol Cell Biol. 2000;1:11–21. doi: 10.1038/35036035. [DOI] [PubMed] [Google Scholar]
- Bielecki J, Youngman P, Connelly P, Portnoy DA. Bacillus subtilis expressing a haemolysin gene from Listeria monocytogenes can grow in mammalian cells. Nature. 1990;345:175–176. doi: 10.1038/345175a0. [DOI] [PubMed] [Google Scholar]
- Christensen KA, Myers JT, Swanson JA. pH-dependent regulation of lysosomal calcium in macrophages. J Cell Sci. 2002;115:599–607. doi: 10.1242/jcs.115.3.599. [DOI] [PubMed] [Google Scholar]
- Colombo MI, Beron W, Stahl PD. Calmodulin regulates endosome fusion. J Biol Chem. 1997;272:7707–7712. doi: 10.1074/jbc.272.12.7707. [DOI] [PubMed] [Google Scholar]
- Cossart P, Vicente MF, Mengaud J, Baquero F, Perez-Diaz JC, Berche P. Listeriolysin O is essential for virulence of Listeria monocytogenes: direct evidence obtained by gene complementation. Infect Immun. 1989;57:3629–3636. doi: 10.1128/iai.57.11.3629-3636.1989. [DOI] [PMC free article] [PubMed] [Google Scholar]
- Desjardins M, Huber LA, Parton RG, Griffiths G. Biogenesis of phagolysosomes proceeds through a sequential series of interactions with the endocytic apparatus. J Cell Biol. 1994;124:677–688. doi: 10.1083/jcb.124.5.677. [DOI] [PMC free article] [PubMed] [Google Scholar]
- van Deurs B, Holm PK, Sandvig K. Inhibition of the vacuolar H(+)-ATPase with bafilomycin reduces delivery of internalized molecules from mature multi-vesicular endosomes to lysosomes in HEp-2 cells. Eur J Cell Biol. 1996;69:343–350. [PubMed] [Google Scholar]
- Duclos S, Desjardins M. Subversion of a young phagosome: the survival strategies of intracellular pathogens. Cell Microbiol. 2000;2:365–377. doi: 10.1046/j.1462-5822.2000.00066.x. [DOI] [PubMed] [Google Scholar]
- Gedde MM, Higgins DE, Tilney LG, Portnoy DA. Role of listeriolysin O in cell-to-cell spread of Listeria monocytogenes. Infect Immun. 2000;68:999–1003. doi: 10.1128/iai.68.2.999-1003.2000. [DOI] [PMC free article] [PubMed] [Google Scholar]
- Gordon AH, Hart PD, Young MR. Ammonia inhibits phagosome–lysosome fusion in macrophages. Nature. 1980;286:79–80. doi: 10.1038/286079a0. [DOI] [PubMed] [Google Scholar]
- Grynkiewicz G, Poenie M, Tsien RY. A new generation of Ca2+ indicators with greatly improved fluorescence properties. J Biol Chem. 1985;260:3440–3450. [PubMed] [Google Scholar]
- Hakansson, A., Bentley, C.C., Shakhnovic, E.A., and Wessels, M.R. (2005) Cytolysin-dependent evasion of lysosomal killing. Proc of the Natl Acad Sci USA. [DOI] [PMC free article] [PubMed]
- Henry R, Shaughnessy L, Loessner MJ, Alberti-Segui C, Higgins DE, Swanson JA. Cytolysin-dependent delay of vacuole maturation in macrophages infected with Listeria monocytogenes. Cell Microbiol. 2006;8:107–119. doi: 10.1111/j.1462-5822.2005.00604.x. [DOI] [PMC free article] [PubMed] [Google Scholar]
- Heuck AP, Tweten RK, Johnson AE. Assembly and topography of the prepore complex in cholesterol-dependent cytolysins. J Biol Chem. 2003;278:31218–31225. doi: 10.1074/jbc.M303151200. [DOI] [PubMed] [Google Scholar]
- Holroyd C, Kistner U, Annaert W, Jahn R. Fusion of endosomes involved in synaptic vesicle recycling. Mol Biol Cell. 1999;10:3035–3044. doi: 10.1091/mbc.10.9.3035. [DOI] [PMC free article] [PubMed] [Google Scholar]
- Hoppe A, Christensen KA, Swanson JA. Fluorescence resonance energy transfer-based stoichiometry in living cells. Biophys J. 2002;83:3652–3664. doi: 10.1016/S0006-3495(02)75365-4. [DOI] [PMC free article] [PubMed] [Google Scholar]
- Jones S, Portnoy DA. Characterization of Listeria monocytogenes pathogenesis in a strain expressing perfringolysin O in place of listeriolysin O. Infect Immun. 1994;62:5608–5613. doi: 10.1128/iai.62.12.5608-5613.1994. [DOI] [PMC free article] [PubMed] [Google Scholar]
- Kornfeld S, Mellman I. The biogenesis of lysosomes. Annu Rev Cell Biol. 1989;5:483–525. doi: 10.1146/annurev.cb.05.110189.002411. [DOI] [PubMed] [Google Scholar]
- Luzio JP, Poupon V, Lindsay MR, Mullock BM, Piper RC, Pryor PR. Membrane dynamics and the biogenesis of lysosomes. Mol Membr Biol. 2003;20:141–154. doi: 10.1080/0968768031000089546. [DOI] [PubMed] [Google Scholar]
- Mellman I, Fuchs R, Helenius A. Acidification of the endocytic and exocytic pathways. Ann Rev Biochem. 1986;55:663–700. doi: 10.1146/annurev.bi.55.070186.003311. [DOI] [PubMed] [Google Scholar]
- Meresse S, Steele-Mortimer O, Moreno E, Desjardins M, Finlay B, Gorvel JP. Controlling the maturation of pathogen-containing vacuoles: a matter of life and death. Nature Cell Biol. 1999;1:E183–E188. doi: 10.1038/15620. [DOI] [PubMed] [Google Scholar]
- Myers JT, Tsang AW, Swanson JA. Localized reactive oxygen and nitrogen intermediates inhibit escape of Listeria monocytogenes from vacuoles in activated macrophages. J Immunol. 2003;171:5447–5453. doi: 10.4049/jimmunol.171.10.5447. [DOI] [PMC free article] [PubMed] [Google Scholar]
- Peters C, Mayer A. Ca2+/calmodulin signals the completion of docking and triggers a late step of vacuole fusion. Nature. 1998;396:575–580. doi: 10.1038/25133. [DOI] [PubMed] [Google Scholar]
- Portnoy DA, Jacks PS, Hinrichs DJ. Role of hemolysin for the intracellular growth of Listeria monocytogenes. J Exp Med. 1988;167:1459–1471. doi: 10.1084/jem.167.4.1459. [DOI] [PMC free article] [PubMed] [Google Scholar]
- Portnoy DA, Tweten RK, Kehoe M, Bielecki J. Capacity of Listeriolysin O, Streptolysin O, and Perfringolysin O to mediate growth of Bacillus subtilis within mammalian cells. Infect Immun. 1992;60:2710–2717. doi: 10.1128/iai.60.7.2710-2717.1992. [DOI] [PMC free article] [PubMed] [Google Scholar]
- Pryor PR, Mullock BM, Bright NA, Gray SR, Luzio JP. The role of intraorganellar Ca2+ in late endosome-lysosome heterotypic fusion and in the reformation of lysosomes from hybrid organelles. J Cell Biol. 2000;149:1053–1062. doi: 10.1083/jcb.149.5.1053. [DOI] [PMC free article] [PubMed] [Google Scholar]
- Reeves EP, Lu H, Jacobs HL, Messina CGM, Bolsover S, Gabella G, et al. Killing activity of neutrophils is mediated through activation of proteases by K+ flux. Nature. 2002;416:291–297. doi: 10.1038/416291a. [DOI] [PubMed] [Google Scholar]
- Rossjohn J, Feil SC, McKinstry WJ, Tweten RK, Parker MW. Structure of a cholesterol-binding, thiol-activated cytolysin and a model of its membrane form. Cell. 1997;89:685–692. doi: 10.1016/s0092-8674(00)80251-2. [DOI] [PubMed] [Google Scholar]
- Sansonetti P. Phagocytosis of bacterial pathogens: implications in the host response. Semin Immunol. 2001;13:381–390. doi: 10.1006/smim.2001.0335. [DOI] [PubMed] [Google Scholar]
- Scott CC, Botelho RJ, Grinstein S. Phagosome maturation: a few bugs in the system. J Membr Biol. 2003;193:137–152. doi: 10.1007/s00232-002-2008-2. [DOI] [PubMed] [Google Scholar]
- Smith GA, Marquis H, Jones S, Johnston NC, Portnoy DA, Goldfine H. The two distinct phospholipases C of Listeria monocytogenes have overlapping roles in escape from a vacuole and cell-to-cell spread. Infect Immun. 1995;63:4231–4237. doi: 10.1128/iai.63.11.4231-4237.1995. [DOI] [PMC free article] [PubMed] [Google Scholar]
- Tapper H, Sundler R. Bafilomycin A1 inhibits lysosomal, phagosomal, and plasma membrane H(+)-ATPase and induces lysosomal enzyme secretion in macrophages. J Cell Physiol. 1995;163:137–144. doi: 10.1002/jcp.1041630116. [DOI] [PubMed] [Google Scholar]
- Tsang AW, Oestergaard K, Myers JT, Swanson JA. Altered membrane trafficking in bone marrow-derived macrophages. J Leukoc Biol. 2000;68:487–494. [PubMed] [Google Scholar]
- Underhill DM, Ozinsky A. Phagocytosis of microbes: complexity in action. Annu Rev Immunol. 2002;20:825–852. doi: 10.1146/annurev.immunol.20.103001.114744. [DOI] [PubMed] [Google Scholar]
- Vazquez-Boland JA, Kocks C, Dramsi S, Ohayon H, Geoffroy C, Mengaud J, Cossart P. Nucleotide sequence of the lecithinase operon of Listeria mono-cytogenes and possible role of lecithinase in cell-to-cell spread. Infect Immun. 1992;60:219–230. doi: 10.1128/iai.60.1.219-230.1992. [DOI] [PMC free article] [PubMed] [Google Scholar]
- Vieira OV, Botelho RJ, Grinstein S. Phagosome maturation: aging gracefully. Biochem J. 2002;366:689–704. doi: 10.1042/BJ20020691. [DOI] [PMC free article] [PubMed] [Google Scholar]
- Wadsworth SJ, Goldfine H. Mobilization of protein kinase C in macrophages induced by Listeria monocytogenes affects its internalization and escape from the phagosome. Infect Immun. 2002;70:4650–4660. doi: 10.1128/IAI.70.8.4650-4660.2002. [DOI] [PMC free article] [PubMed] [Google Scholar]
- van Weert AWM, Dunn KW, Geuze HJ, Maxfield FR, Stoorvogel W. Transport from late endosomes to lysosomes, but not sorting of integral membrane proteins in endosomes, depends on the vacuolar proton pump. J Cell Biol. 1995;130:821–834. doi: 10.1083/jcb.130.4.821. [DOI] [PMC free article] [PubMed] [Google Scholar]