Abstract
New primer-enzyme combinations for terminal restriction fragment length polymorphism (T-RFLP) targeting of the 16S rRNA gene were constructed by using the T-RFLP analysis program (designated TAP T-RFLP) located at the Ribosomal Database Project website, and their performance was examined empirically. By using the fluorescently labeled 516f primer (Escherichia coli positions 516 to 532) and 1510r primer (positions 1510 to 1492), the 16S rRNA gene was amplified from human fecal DNA. The resulting amplified product was digested with RsaI plus BfaI or with BslI. When the T-RFLP was carried out with fecal DNAs from eight individuals, eight predominant operational taxonomic units (OTUs) were detected with RsaI and BfaI digestion and 14 predominant OTUs were detected with BslI digestion. The distribution of the OTUs was consistent with the results of the computer simulations with TAP T-RFLP. The T-RFLP analyses of the fecal DNAs from individuals gave characteristic profiles, while the variability of the T-RFLP profiles between duplicate DNA preparations from the same samples were minimal. This new T-RFLP method made it easy to predict what kind of intestinal bacterial group corresponded to each OTU on the basis of the terminal restriction fragment length compared with the conventional T-RFLP and, moreover, made it possible to identify the bacterial species that an OTU represents by cloning and sequencing.
A large number of bacteria exist in the human intestinal tract, which form a complex community referred to as the intestinal microflora. The microflora is affected by various factors, such as food and medicine, and the microflora itself can affects human health. Therefore, to assess the effects of the microflora, a method that is able to easily and rapidly monitor the changes of the flora is required. Conventional methods for flora analysis that rely on the cultivation of bacteria under anaerobic conditions are time-consuming and laborious and miss the large population of bacteria that are difficult to culture or are unculturable (6). Consequently, culture-independent molecular tools, based on the detection of 16S rRNAs or the corresponding genes, have been used recently for the analysis of bacterial communities; these include fluorescent in situ hybridization (FISH) (4, 7, 9), temperature gradient gel electrophoresis (TGGE) (21) and denaturing gradient gel electrophoresis (DGGE) (13, 18, 21), the random cloning approach (19), and terminal restriction fragment polymorphism (T-RFLP) (1, 5, 10, 11). These methods have various advantages and disadvantages and therefore complement each other.
T-RFLP, and particularly T-RFLP using a capillary electrophoresis sequencer, seems to have the advantages of higher throughput and reproducibility in monitoring the bacterial community (16). Therefore, we intended to apply T-RFLP to monitoring the state of human intestinal microflora during a particular diet or a medical treatment and for assessing the effect of health foods or medicines on the microflora. However, to date, the primer-enzyme combination typically used in T-RFLP analysis, namely, the combination of the 8f PCR primer (Escherichia coli positions 8 to 27) and HhaI, MspI, or others (10, 11, 14), has had a number of problems. First, the primer is not suitable for amplification of 16S rRNA genes from some species of Bifidobacterium (11, 19), which are some of the predominant bacteria in the human intestinal tract and are considered to play an important role in the maintenance of the intestinal environment under healthy conditions. Second, since many sequences in the Ribosomal Database Project (RDP) lack the 8f primer sequence and the primer-enzyme combination yields a relatively complex T-RFLP profile, it is difficult to fully and easily assign bacterial species to the terminal restriction fragments (T-RFs) (10).
To overcome these problems, we searched for new primer-enzyme combinations for T-RFLP analysis that have the capacity to distinguish a bacterial community in human feces at the genus level by using the T-RFLP analysis program (TAP T-RFLP) located at the RDP website (12) and empirically examined the performance of the adopted combinations. The size distribution of the T-RFs generated by the new primer-enzyme combination was consistent with that of the T-RFs derived from an in silico digestion of the sequences of the intestinal bacteria in the RDP. This T-RFLP method reduced the complexity of the profile so that data analyses could readily be made. In addition, this method made it possible to recover the T-RFs by agarose gel electrophoresis, so that they could then be cloned and sequenced.
MATERIALS AND METHODS
TAP T-RFLP analysis.
TAP T-RFLP was performed for every combination of five different 16S rRNA gene universal primers, where two base mismatches were allowed within the sequence providing that they did not occur within 3 bases from the 3′ end of the primer, and all restriction enzymes with a 4-bp recognition site that are entered into the program. The five primers used were 341f (5′-CTACGGGAGGCAGCAGTGGG-3′; E. coli positions 341 to 360), 516f (5′-TGCCAGCAGCCGCGGTA-3′; E. coli positions 516 to 532), 926r (5′-CCGTCAATTCCTTTGAGTTT-3′; E. coli positions 926 to 907), 1406r (5′-ACGGGCGGTGTGTAC-3′); E. coli positions 1406 to 1392), and 1510r (5′-GGTTACCTTGTTACGACTT-3′; E. coli positions 1510 to 1492). The lengths of T-RFs produced by in silico digestion of the 16S rRNA gene sequences from bifidobacteria (53 sequences), Bacteroides (46 sequences), Prevotella (48 sequences), clostridia-ruminococci (275 sequences), eubacteria (70 sequences), enterococci (53 sequences), streptococci (195 sequences), lactobacilli (106 sequences), and E. coli (39 sequences) were summed.
DNA isolation from fecal samples.
Two hundred to 500 milligrams of fresh fecal samples from eight healthy individuals (A to H), differing in age (2 weeks to 49 years old) and sex (five males and three females), were collected and stored at 4°C until use (not more than several hours). The fecal samples were suspended in 9 volumes of sterile distilled water by vigorous shaking. After the samples were allowed to stand for 10 min, aliquots of 0.1 ml were transferred into a 1.5-ml tube containing 0.9 ml of distilled water and the tube was centrifuged at 18,000 × g for 5 min. The pellet was washed twice by suspension in 1 ml of distilled water followed by centrifugation and was finally suspended in 250 μl of a solution containing 100 mM Tris-HCl (pH 9.0) and 40 mM EDTA. The suspension was transferred into a 0.5-ml tube containing about 0.6 g of glass beads (diameter, 0.1 mm), treated at 5,000 rpm for 3 min in a mini-bead beater (BioSpec Products, Bartlesville, Okla.) (21, 22), and recovered according to the manufacturer's instructions. DNA was extracted from the bead-treated suspension by using benzyl chloride as described by Zhu et al. (20). Briefly, 150 μl of benzyl chloride and 50 μl of 10% sodium dodecyl sulfate were added to the suspension, and the mixture was vigorously shaken at 50°C for 30 min. Thereafter, 150 μl of 3 M sodium acetate was added, and the mixture was set on ice for 15 min and then centrifuged at 18,000 × g for 10 min. The upper layer was recovered, and DNA was precipitated by addition of an equal volume of isopropanol. After the pellet was washed with 70% ethanol, the DNA pellet was dried and then dissolved in 100 μl of TE (10 mM Tris-HCl [pH 8.0], 0.1 mM EDTA) containing 50 μg of RNase ml−1 and incubated at 37°C for 30 min. Next, the DNA preparation was purified by using the GFX PCR DNA and Gel Band Purification Kit (Amersham Biosciences, Piscataway, N.J.) and quantified and analyzed by measurement at 260, 280, and 320 nm with a DU 7000 spectrophotometer (Beckman, Fullerton, Calif.). The concentration of DNA was calculated by the following equation: micrograms milliliter−1 = [−36.0 × (A280 − A320)] + [62.9 × (A260 − A320)] (see the manual for the Beckman spectrophotometer). Finally, the DNA preparation was adjusted to a final concentration of 10 μg ml−1 in TE and checked by 1.5% agarose gel electrophoresis.
Enzyme (lysozyme and achromopeptidase) treatment of the washed fecal sample was performed as described by Liu et al. (11).
PCR conditions.
PCR was performed with a model 2400 thermal cycler (Applied Biosystems, Foster City, Calif.) in a reaction mixture (20 μl) containing 1× PCR buffer, each deoxynucleoside triphosphate at a concentration of 200 μM, 1.5 mM MgCl2, each primer at a concentration of 0.1μM, 10 ng of fecal DNA, and 0.5 U of HotStarTaq DNA polymerase (Qiagen, Tokyo, Japan). The primers used were 5′ HEX-labeled 516f and 1510r. The amplification program used was as follows: preheating at 95°C for 15 min; 30 cycles of denaturation at 95°C for 30 s, annealing at 50°C for 30 s, and extension at 72°C for 1 min; and finally a terminal extension at 72°C for 10 min. An internal control DNA for restriction enzyme digestion was amplified from the DNA (purified as described above, 10 ng) of Lactobacillus sp. or Staphylococcus sp. by using 5′ 6-carboxyfluorescein-labeled 516f and 1510r. Amplified DNA was verified by 1.5% agarose gel electrophoresis.
Purification of PCR product and restriction enzyme digestion.
Fluorescently labeled PCR products (20 μl) were purified by using the MultiScreen FB filter plate (Millipore, Bedford, Mass.) as follows. An equal volume of a solution containing 7 M guanidine-HCl and 200 mM MES (morpholinoethanesulfonic acid) (pH 5.6) was added to the PCR mixtures, and the DNA solutions were transferred to each well of the FB plate, followed by centrifugation at 1,000 × g for 5 min. Each well was washed twice by adding 80% ethanol and centrifugation and dried briefly under vacuum. Fifty-five microliters of TE was added to the wells, and the FB plate was centrifuged. Approximately 50 μl of PCR products was obtained.
In the case of digestion with RsaI (recognition site, 5′-GT|AC-3′) plus BfaI (5′-C|TAG-3′), a reaction mixture (10 μl) containing 2.5 U each of RsaI (Nippon Gene, Toyama, Japan) and BfaI (New England BioLabs, Beverly, Mass.), 1× NEB buffer 4 (New England BioLabs), 2 μl of the PCR product from the fecal DNA, and 0.5 μl of each of two kinds of the internal control DNAs was incubated at 37°C for 1 h. In the case of digestion with BslI (5′-CCNNNNN|NNGG-3′) or BseLI, which is an isoschizomer of BslI, a reaction mixture (10 μl) containing 2 U of BslI (New England BioLabs) or BseLI (MBI Fermentas, Amherst, N.Y.), 1× NEB buffer 3 (New England BioLabs), 2 μl of the PCR product from the fecal DNA, and 0.5 μl of either of two kinds of the internal control DNAs was incubated at 55°C for 1 h. The digestion of the internal control DNA derived from Lactobacillus sp. with RsaI, BfaI, or BslI gave a T-RF of 383, 311, or 657 bp, respectively. The digestion of the internal control DNA derived from Staphylococcus sp. with RsaI, BfaI, or BslI gave a T-RF of 136, 498, or 518 bp, respectively.
In the case of the digestion with BslI or BseLI, the addition of a larger amount of fluorescently labeled DNA to the reaction mixture appeared to induce star activity (an enzymatic activity with lowered specificity for the sequence recognition) for each of these enzymes. Moreover, even in the digestion with BseLI, NEB buffer 3 was better than the buffer added together with BseLI (buffer Y+/TANGO; MBI Fermentas) in terms of its induction of star activity.
T-RFLP analysis.
The fluorescently labeled T-RFs were analyzed by electrophoresis on an ABI PRISM 310 Genetic Analyzer automated sequence analyzer (Applied Biosystems) in GeneScan mode. Two microliters of the restriction enzyme digestion mixture was mixed with 0.5 μl of fourfold-diluted GeneScan-2500 size standard (Applied Biosystems) and 12 μl of deionized formamide, followed by denaturation at 96°C for 2 min and immediate chilling on ice. The injection time was 20 s for analysis of T-RFs from the digestion with RsaI plus BfaI and 40 s for that of T-RFs from the digestion with BslI or BseLI. The run time was 40 min.
Construction and analysis of clone library.
Using the fecal DNA preparations from individuals C and G, 16S rRNA genes were amplified by the above-described PCR condition except that nonlabeled 516f primer was used. The resulting PCR products were purified through S-400HR MicroSpin columns (Amersham) and cloned into E. coli TOP10 by using the TOPO TA Cloning Kit for Sequencing (Invitrogen, Carlsbad, Calif.). Insert DNAs (about 1,000 bp long) were recovered by the colony direct PCR method with T3 and T7 primers. The DNA products were purified by using the MultiScreen FB filter plate (Millipore) and were sequenced by using the BigDye Terminator Cycle Sequencing Kit (Applied Biosystems). Chimeric sequences were detected with the RDP CHECK CHIMERA program. Homology searches of the obtained sequences were performed with the BLAST and FASTA programs at the web site of the DNA Data Bank of Japan (DDBJ).
Cloning and sequencing of T-RFs.
PCR was performed as described above except that 0.4 μM concentrations of biotin-labeled NotI-516f primer (5′-TAGACGCGGCCGCTGCCAGCAGCCGCGGTA-3′) and 1510r were used. The PCR products (50 μl) were purified by using S-400HR MicroSpin columns (Amersham), mixed with 0.5 mg of Dynabeads M-280 (Dynal Biotech, Oslo, Norway) suspended in 50 μl of 2× B-W buffer (10 mM Tris-HCl [pH 7.5], 1 mM EDTA, 2.0 M NaCl), and then incubated at room temperature for 15 min. After being washed twice with 100 μl of TE, the DNA-bead conjugate (50 μl) was treated for 3 h with 30 U of BslI at 55°C or with 30 U each of RsaI and BfaI at 37°C. The DNA in the conjugate (20 μl) was blunt ended by using T4 DNA polymerase (TOYOBO, Tokyo, Japan) (17) and digested with 20 U of NotI (TAKARA, Otsu, Japan) at 37°C for 3 h. Washing of the conjugates with TE was carried out between each procedure. The T-RFs were recovered from the supernatant by ethanol precipitation and were subjected to electrophoresis through a 3% agarose SFR gel (Amresco, Solon, Ohio) followed by ethidium bromide staining. DNA fragments were cut out from the gel, purified by using the GFX PCR DNA and Gel Band Purification Kit, and then inserted into the NotI-EcoRV site of pBluescript (Stratagene, La Jolla, Calif.). The resulting plasmids were cloned into E. coli DH5α, and their insert DNAs were sequenced.
T-RFLP data analysis.
The lengths and peak areas of T-RFs were determined with the GeneScan software. A standard curve was drawn by using DNA fragments with lengths of 94, 109, 116, 172, 186, 222, 233, 238, 269, 286, 361, 470, 490, 536, 827, and 1,115 bp by the local Southern method, in which the fragment of 1,115 bp was treated as 1,100 bp in order to match the real size (995 bp) of the uncut PCR product from Lactobacillus sp. with that observed.
To compare the T-RFLP patterns among samples, the dissimilarity (D) index was used. This is given by D(i,j) = 1/2Σ|xki − xkj|, where xki, xkj ≧ 0.1, Σxki = Σxkj = 100, and xki and xkj indicate the percentages of the peak area of the fragment (operational taxonomic unit [OTU]) k in samples i and j, respectively (8). The D value ranges from 0 to 100. In this paper, the T-RFs or T-RF clusters with lengths of 109 ± 2, 123 ± 1, 130 ± 2, 138 ± 1, 159 ± 2, 251, 288 ± 1, 308 ± 3, and 377 ± 3 bp in the case of RsaI-plus-BfaI digestion and those with lengths of 110 ± 2, 124 ± 2, 160 ± 2, 317 ± 2, 332 ± 2, 370 ± 2, 469 ± 2, 494 ± 2, 520 ± 2, 657 ± 5, 749 ± 4, 853 ± 2, 919 ± 4, 940 ± 5, 955 ± 5, and 990 ± 5 bp in the case of BslI or BseLI digestion were treated as OTUs.
Nucleotide sequence accession numbers.
The representative sequences of 111- and 124-bp T-RF clones derived from individual G and those of 376-and 377-bp T-RF clones derived from individual H have been deposited in the DDBJ database under accession numbers AB086439, AB086440, AB086441, and AB086442, respectively. The DDBJ accession numbers of representative sequences from the clone library from individuals C and G, with the most closely related species to the sequences and the OTUs accompanied by individual names and restriction enzyme names as subscripts in parentheses, are as follows: AB094149 (Bifidobacterium adolescentis, 123-bp OTUR-B,C/124-bp OTUBsl,C), AB094150 (Bifidobacterium longum, 123-bp OTUR-B,C/124-bp OTUBsl,C), AB094151 (Bifidobacterium psudocatenulatum, 123-bp OTUR-B,C/124-bp OTUBsl,C), AB094152 (Clostridium indolis, 130-bp OTUR-B,C/939-bp OTUBsl,C), AB094153 (Clostridium nexile, 130-bp OTUR-B,C/494-bp OTUBsl,C), AB094344 (Clostridium populeti, 130-bp OTUR-B,C/657-bp OTUBsl,C), AB094154 (Eubacterium eligens, 130-bp OTUR-B,C/919-bp OTUBsl,C), AB094155 (Roseburia intestinalis, 114-bp OTUR-B,C/749-bp OTUBsl,C), AB094156 (Ruminococcus gnavus, 130-bp OTUR-B,C/940-bp OTUBsl,C), AB094157 (Ruminococcus obeum, 130-bp OTUR-B,C/749-bp OTUBsl,C), AB094158 (Ruminococcus torques, 130-bp OTUR-B,C/939-bp OTUBsl,C), AB094159 (Ruminococcus torques, 138-bp OTUR-B,C/939-bp OTUBsl,C), AB094161 (Clostridium indolis, 158-bp OTUR-B,C/939-bp OTUBsl,C), AB094162 (Clostridium saccharolyticum, 158-bp OTUR-B,C/494-bp OTUBsl,C), AB094163 (Eubacterium eligens, 158-bp OTUR-B,C/494-bp OTUBsl,C), AB094164 (Ruminococcus gnavus, 158-bp OTUR-B,C/939-bp OTUBsl,C), AB094165 (Ruminococcus obeum, 158-bp OTUR-B,C/939-bp OTUBsl,C), AB095023 (Ruminococcus obeum, 158-bp OTUR-B,C/956-bp OTUBsl,C), AB094166 (Ruminococcus obeum, 158-bp OTUR-B,C/494-bp OTUBsl,C), AB094167 (Ruminococcus lactaris, 158-bp OTUR-B,C/939-bp OTUBsl,C), AB094168 (Ruminococcus schinkii, 158-bp OTUR-B,C/956-bp OTUBsl,C), AB094169 (Bacteroides distasonis, 308-bp OTUR-B,C/469-bp OTUBsl,C), AB094170 (Clostridium orbiscindens, 308-bp OTUR-B,C/370-bp OTUBsl,C), AB094171(Fusobacterium prausnitzii, 308-bp OTUR-B,C/749-bp OTUBsl,C), AB094172 (Ruminococcus bromii, 308-bp OTUR-B,C), AB094173 (Ruminococcus schinkii, 308-bp OTUR-B,C/494-bp OTUBsl,C), AB094174 (Bacteroides acidofaciens, 377-bp OTUR-B,C/370-bp OTUBsl,C), AB094175 (Bacteroides eggerthii, 377-bp OTUR-B,C/370-bp OTUBsl,C), AB094176 (Bacteroides thetaiotaomicron, 377-bp OTUR-B,C/370-bp OTUBsl,C), AB094177 (Bacteroides vulgatus, 377-bp OTUR-B,C/469-bp OTUBsl,C), AB094178 (Ruminococcus obeum, 377-bp OTUR-B,C/494-bp OTUBsl,C), AB094179 (Bifidobacterium breve, 123-bp OTUR-B,G/124-bp OTUBsl,G), AB094180 (Bifidobacterium infantis, 123-bp OTU OTUR-B,G/124-bp OTUBsl,G), AB094181 (Bifidobacterium longum, 123-bp OTUR-B,G/124-bp OTUBsl,G), AB094182 (Ruminococcus gnavus, 136-bp OTUR-B,G/754-bp OTUBsl,G), AB094183 (Bacteroides thetaiotaomicron, 142-bp OTUR-B,G/467-bp OTUBsl,G), AB094184 (Bacteroides thetaiotaomicron, 142-bp OTUR-B,G/847-bp OTUBsl,G), AB094185 (Veillonella ratti, 159-bp OTUR-B,G/110-bp OTUBsl,G), AB094186 (Streptococcus pasteuri, 308-bp OTUR-B,G/332-bp OTUBsl,G), AB094187 (E. coli, 377-bp OTUR-B,G/940-bp OTUBsl,G), and AB094188 (Enterococcus malodoratus, 377-bp OTUR-B,G/520-bp OTUBsl,G).
RESULTS AND DISCUSSION
New primer-enzyme combinations for T-RFLP analysis.
Based on computer simulations, Liu et al. (11) concluded that amplification with the primer pair 8f-926r followed by digestion with HhaI or MspI was the simplest way to classify the largest number of 16S rRNA gene sequences into the largest number of unique 5′ T-RFs. Since then, the combination of the labeled 8f primer and these enzymes has been used in almost all cases of T-RFLP analysis. However, the T-RFLP pattern produced by this method is so complex that data analysis followed by comparison of the patterns among samples cannot readily be done. To resolve this problem and to apply T-RFLP to monitoring changes of bacterial populations in the human gut, we have examined new primer-enzyme combinations and have identified those that provided the best resolution for major genera known to be present in the gut, including the Bifidobacterium, Bacteroides, Prevotella, Clostridium, Ruminococcus, Eubacterium, Enterococcus, Streptococcus, and Lactobacillus, and for E. coli by using TAP T-RFLP.
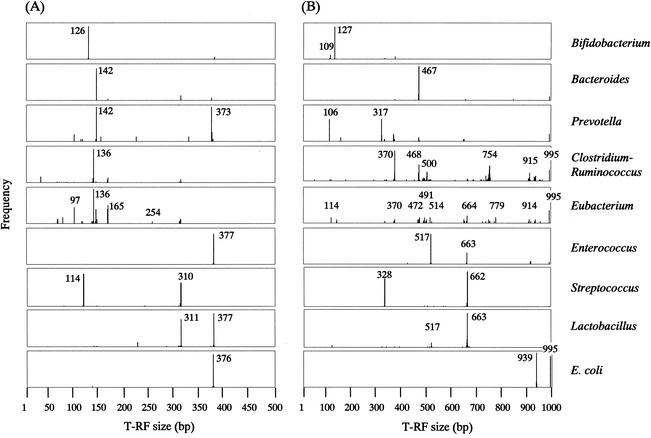
TAP T-RFLP was run as described in Materials and Methods with every combination of five different universal primers (341f, 516f, 926r, 1406r, and 1510r) and 4-bp cutters of restriction enzymes. As a result, two combinations of 516f-RsaI plus BfaI and 516f-BslI were selected. Frequency distribution profiles of terminal fragments derived from TAP T-RFLP with each of these combinations are shown in Fig. 1. The profiles indicate that either of the two combinations distinguishes 16S rRNA gene sequences derived from the fecal bacterial community at the genus level or higher comparatively well, although the latter combination had a higher resolution than the former one. T-RFLP profiling of the same sample with these two combinations seemed to provide more information about the constituents of a bacterial community in feces. Many of the T-RFs shown in Fig. 1 were detected in T-RFLP analysis with fecal samples, as described in detail below.
FIG. 1.
Frequency distribution profiles of the 5′ T-RFs derived from in silico digestion of 16S rRNA gene sequences from strains belonging to the major large intestinal bacterial genera. TAP T-RFLPs were run with the primer-enzyme combinations of 516f-RsaI plus BfaI (A) or 516f-BslI (B), and histograms of the predicted T-RF lengths were drawn. The T-RFs of 995 bp in panel B are uncut fragments.
Conditions for T-RFLP analysis with new primer-enzyme combinations.
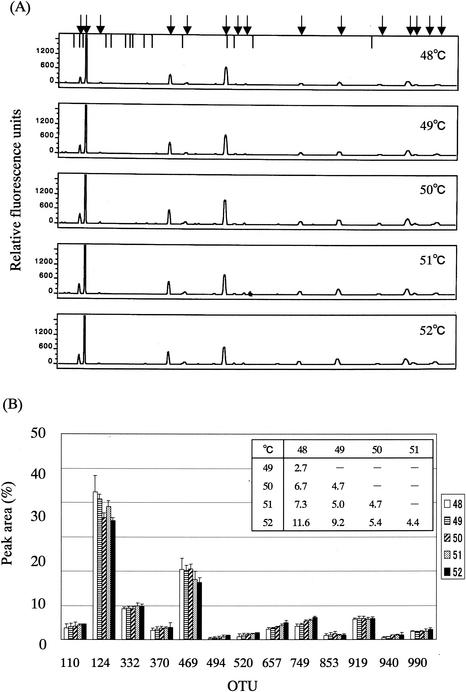
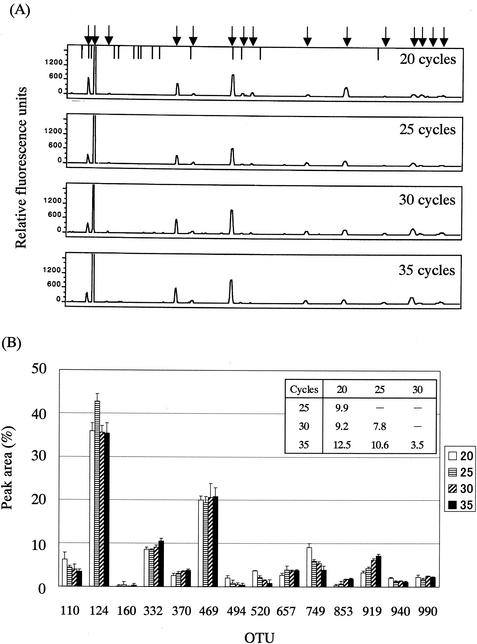
It was predicted that T-RFs of over 900 bp would be produced in the case of BslI digestion, as shown in Fig. 1. Therefore, the 1510r universal primer was selected as a reverse primer. Since the melting temperatures of 516f and 1510r are 72.8 and 53.1°C, respectively, PCR was performed at a different annealing temperature of approximately 50°C (48, 49, 50, 51, and 52°C over 30 amplification cycles) with the fecal DNA and then the PCR products were subjected to T-RFLP analysis. It was found that there are only minor differences among the T-RFLP profiles derived from different annealing temperatures (Fig. 2). The larger the difference in the annealing temperature was, the larger was the D value between the T-RFLP profiles (Fig. 2B); the D values among the T-RFLP profiles derived from different annealing temperatures ranged from 2.7 to 11.6, while those between the T-RFLP profiles derived from the experiments at 50°C and at the other temperatures were less than 7. A similar result was observed in the T-RFLP analysis of 16S rRNA gene amplicons obtained after 20, 25, 30, or 35 cycles of amplification at an annealing temperature of 50°C (Fig. 3); the D values among the T-RFLP profiles derived from different amplification cycles ranged from 3.5 to 12.5, while those between the T-RFLP profiles derived from the experiments with 30 cycles of amplification and those with the other amplification cycles were less than 10 (Fig. 3B). Finally, we adopted 50°C as an annealing temperature and 30 amplification cycles.
FIG. 2.
Effect of annealing temperature in PCR on T-RFLP profile. (A) Electropherograms of the T-RFs produced by BslI digestion of 16S rRNA gene amplicons from PCR at the indicated annealing temperatures. Fecal DNA from individual G was used as the PCR template. Arrows indicate the positions of OTUs: 110, 124, 160, 332, 370, 469, 494, 520, 657, 749, 853, 919, 940, 995, and 990 bp from the left side. Vertical bars indicate the positions of size markers: 94, 109, 116, 172, 186, 222, 233, 238, 269, 286, 361, 470, 490, 516, and 827 bp from the left side. (B) Comparison of relative abundances of OTUs among the electropherograms. Data are expressed as means + standard deviations from three independent experiments with the same DNA preparation. The numbers in the key indicate the annealing temperature (°C). D values are presented in the inset table.
FIG. 3.
Effect of cycle number in PCR on T-RFLP profile. (A) Electropherograms of the T-RFs produced by BslI digestion of 16S rRNA gene amplicons from PCR with the indicated cycle number. Fecal DNA from individual G was used as the PCR template. Arrows and bars are as described for Fig. 2. (B) Comparison of relative abundances of OTUs among the electropherograms. Data are expressed as means + standard deviations from three independent experiments with the same DNA preparation. The numbers in the key indicate the cycle number of the PCR. D values are presented in the inset table.
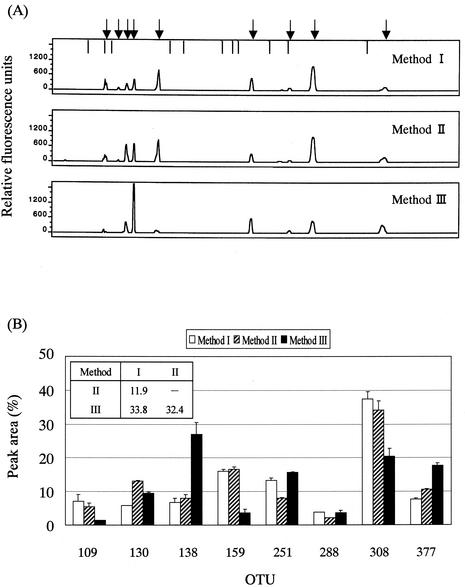
One of the most critical factors for bacterial community analysis using molecular tools is the ability to efficiently extract DNA from every variety of bacteria, especially gram-positive bacteria. Therefore, we tried three methods for DNA extraction: method I, treatments with bacteriolytic enzymes, bead beating, and benzyl chloride (in that order); method II, treatments with bead beating and benzyl chloride (in that order); and method III, treatment with benzyl chloride. There was little difference between methods I and II in terms of the amount and integrity of the extracted DNA (data not shown) and the appearance of the T-RFLP profiles (Fig. 4). Compared with methods I and II, the treatment with only benzyl chloride (method III) resulted in the smallest amount of extracted DNA (half as much as in methods I and II), an extreme decrease in the relative quantity of the 159-bp OTU that seems to mainly represent gram-positive bacteria, and a large increase in the relative quantity of the 138-bp OTU that seems to mainly represent gram-negative bacteria (see Table 1). The D value between T-RFLP profiles derived from methods I and II was 11.9, and that between profiles derived from methods II and III was 32.4 (Fig. 4B). Moreover, when Staphylococcus aureus cells were added to a fecal sample and the DNA was extracted by method I, II, or III, followed by PCR with S. aureus-specific primers (2, 15), S. aureus DNA amplicons were detected at a fold-higher dilution in the cases of DNA extracts from methods I and II compared to that from method III (data not shown). Therefore, we decided to extract the DNA by using bead beating and benzyl chloride as described in Materials and Methods. The amounts of DNA extracted from fecal samples (about 10 mg [wet weight]) from eight individuals by using method II ranged from 1.1 to 6.3 μg.
FIG. 4.
Assessment of DNA extraction methods. (A) Electropherograms of the T-RFs produced by RsaI-plus-BfaI digestion of 16S rRNA gene amplicons from PCR with fecal DNA extracted by method I, II, or III. Fecal DNA from individual A was used as the PCR template. Arrows indicate the positions of OTUs: 109, 123, 130, 138, 159, 251, 288, 308, and 377 bp from the left side. Vertical bars indicate the positions of size markers: 94, 109, 116, 172, 186, 222, 233, 238, 269, 286, and 361 bp from the left side. (B) Comparison of relative abundances of OTUs among the electropherograms. Data are expressed as means + standard deviations from three independent experiments with the same DNA preparation. D values are presented in the inset table.
TABLE 1.
Correspondence of OTUs to bacteria
| Restriction enzyme(s) and OTU | Bacteria from which sequences in RDP were derived (predicted T-RF length [bp]:no. of sequences) | Most closely related species (predicted T-RF length [bp]:no. of clones:similarity [%]) predicted from sequences obtained from a clone library from:
|
|
|---|---|---|---|
| Individual C | Individual G | ||
| RsaI-BfaI | |||
| 109 | Eubacteria (112:1, 114:1), Prevotella (111:1, 114:1), streptococci (113:1, 114:102) | Roseburia intestinalis (114:1:97) | None |
| 123 | Bifidobacteria (125:1, 126:45), clostridia (125:1, 129:1) | Bifidobacterium adolescentis (126:2:99), Bifidobacterium longum (126:3:99-100), Bifidobacterium pseudocatenulatum (126:1:99) | Bifidobacterium breve (126:16b:99), Bifidobacterium infantis (126:2:99), Bifidobacterium longum (126:28:99-100) |
| 130 | Clostridia (132:1, 134:2, 135:15, 136:125), eubacteria (132:1, 134:1, 135:1, 136:17), E. coli (133:1), lactobacilli (136:1), ruminococci (136:6), Veillonella (135:4) | Clostridium indolis (136:1:93), Clostridium nexile (136:1:94), Clostridium populeti (136:2:92), Eubacterium eligens (136:1:93), Ruminococcus gnavus (136:1:95), Ruminococcus obeum (136:1:92), Ruminococcus torques (136:1:95) | R. gnavus (136:4:99) |
| 138 | Bacteroides (142:26), clostridia (141:3), eubacteria (140:1, 141:7, 143:2), lactobacilli (142:1), Prevotella (141:1, 142:15), streptococci (141:1) | R. torques (142:1:95) | Bacteroides thetaiotaomicron (142:7:99) |
| 159 | Bacteroides (165:1), clostridia (163:2, 164:10, 165:30), eubacteria (164:7, 165:9), fusobacteria (164:2), ruminococci (164:1, 165:12), Veillonella (164:1) | C. indolis (165:2:95), Clostridium saccharolyticum (165:3:93-94), Eubacterium eligens (165:1:98), R. gnavus (165:1:94), R. obeum (165:3:95-97), Ruminococcus lactaris (165:1:98), Ruminococcus schinkii (165:1:96) | Veillonella ratti (164:5:99-100) |
| 251 | Eubacteria (254:1) | None | None |
| 288 | None | None | None |
| 308 | Bacteroides (311:4), clostridia (308:2, 310:2, 311:12), eubacteria (308:1, 309:1, 310:2, 311:2), lactobacilli (307:1, 309:1, 310:1, 311:43, 312:1), ruminococci (311:15, 312:2), streptococci (305:1, 309:9, 310:78) | Bacteroides distasonis (311:1:98), Clostridium orbiscindens (311:1:94), Fusobacterium prausnitzii (311:3:93-98), Ruminococcus bromii (311:2a:99), R. schinkii (311:1:95) | Streptococcus pasteuri (310:6:98-100) |
| 377 | Bacteroides (373:2), bifidobacteria (378:1, 379:3), enterococci (376:2, 377:50, 378:1), E. coli (375:1, 376:36, 377:1), lactobacilli (376:2, 377:45, 378:1), Prevotella (373:15, 374:4, 375:1, 376:1) | Bacteroides acidofaciens (373:1:93), Bacteroides eggerthii (373:16:91-92), Bacteroides thetaiotaomicron (373:3:91), Bacteroides vulgatus (373:1:98), R. obeum (376:1:95) | E. coli (376:2:99), Enterococcus malodoratus (377:2:99) |
| BslI | |||
| 110 | Clostridia (114:3), eubacteria (114:3), lactobacilli (114:3), Veillonella (114:5) | None | V. ratti (114:5:99-100) |
| 124 | Bifidobacteria (127:40, 126:1) | Bifidobacterium adolescentis (127:2:98-99), Bifidobacterium longum (127:3:99-100), Bifidobacterium pseudocatenulatum (127:1:99) | Bifidobacterium breve (127:16:99), Bifidobacterium infantis (127:2:99), Bifidobacterium longum (127:28:99-100) |
| 160 | None | None | None |
| 317 | Lactobacilli (317:1), Prevotella (317:12, 318:3) | None | None |
| 332 | Bifidobacteria (329:1), clostridia (330:1, 336:1, 337:1), eubacteria (330:1), lactobacilli (335:1), Prevotella (328:1, 329:1), streptococci (327:8, 328:71) | None | S. pasteuri (328:6:98-100) |
| 370 | Bacteroides (370:1), bifidobacteria (371:2, 372:3), clostridia (366:1, 367:3, 369:7, 370:31, 371:2), eubacteria (377:1, 379:1, 370:2), lactobacilli (367:1), Prevotella (365:4, 366:3, 369:1) | Bacteroides acidofaciens(366:1:93), Bacteroides eggerthii (366:16:91-92), Bacteroides thetaiotaomicron (366:3:91), C. orbiscindens (369:1:94) | None |
| 469 | Bacteroides (466:6, 467:37), clostridia (465:1, 466:7, 468:17, 469:1, 472:1), eubacteria (466:1, 468:1, 469:2, 472:3), Prevotella (467:2, 468:1) | Bacteroides distasonis (467:1:98), Bacteroides vulgatus (467:1:98) | Bacteroides thetaiotaomicron (467:6:99) |
| 494 | Clostridia (488:3, 489:2, 490:1, 491:2, 492:1, 497:1, 498:1, 499:4, 500:10, 501:6, 502:3), eubacteria (490:2, 496:1, 491:3, 499:2), ruminccocci (490:1, 501:1), streptococci (489:1, 501:2) | C. saccharolyticum (490:3:93-94), obeum (490:2:95,96), R. schinkii (490:1:95); Eubacterium eligens (491:1:98), C. nexile (502:1:94) | None |
| 520 | Enterococci (516:1, 517:29, 518:1), eubacteria (514:3, 520:1), clostridia (517:1), lactobacilli (516:1, 517:7, 518:1) | None | Enterococcus malodoratus (517:2:99) |
| 657 | Bacteroides (656:1), clostridia (662:1), enterococci (660:1, 661:1, 662:2, 663:11), eubacteria (660:1, 662:1, 663:1, 664:3), lactobacilli (658:2, 661:7, 662:13, 663:54, 664:3), ruminococci (662:1, 663:1, 664:2), streptococci (660:4, 661:9, 662:89) | C. populeti (663:2:92) | None |
| 749 | Clostridia (749:3, 750:6, 751:6, 752:11, 753:17, 754:12, 755:6, 756:3), eubacteria (750:2, 754:1, 755:1), fusobacteria (750:1, 752:7, 753:1, 754:2), ruminococci (754:2) | F. prausnitzii (748:3:93-98), Roseburia intestinalis(754:1:97), R. obeum (754:1:92) | R. gnavus (754:4:99) |
| 853 | Bacteroides (849:1) | None | Bacteroides thetaiotaomicron (847:1:99) |
| 919 | Enterococci (918:2, 920:3), eubacteria (912:1, 914:2), ruminococci (913:3, 914:1, 915:8, 916:1) | Eubacterium eligens (919:1:93) | None |
| 940 | Clostridia (937:3, 938:4, 939:1, 940:3), eubacteria (936:1, 937:1, 939:2), E. coli (938:3, 939:19, 940:2), fusobacteria (939:2), ruminococci (933:2, 934:4, 935:1) | C. indolis (939:3:93-95), R. gnavus (939:1:94), R. gnavus (940:1:95), R. lactaris (939:1:98), R. obeum (939:1:97), R. torques (939:2:95) | E. coli (939:2:99) |
| 955 | Clostridia (956:1, 959:1), eubacteria (959:1), ruminococci (956:1) | R. obeum (956:1:95), R. schinkii (956:1:96) | None |
| 990 | Bacteroides (NAc:4), clostridia (NA:10), eubacteria (NA:7), E. coli (NA:17), Prevotella (NA:4), fusobacteria (NA:7), ruminococci (NA:6) | None | None |
A 172-bp T-RF is produced from each sequence of these clones by in silico digestion with BslI.
A 69-bp T-RF is produced from the sequence of one of these clones by in silico digestion with BslI.
NA, not applicable.
T-RFLP analysis of fecal samples from different individuals.
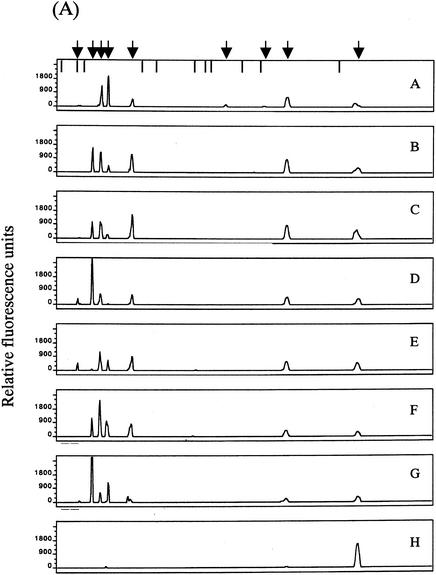
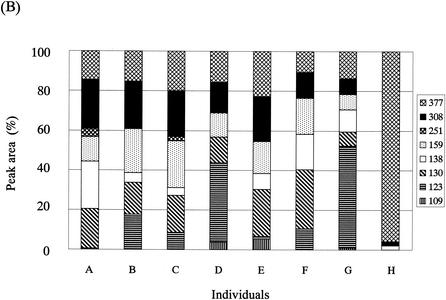
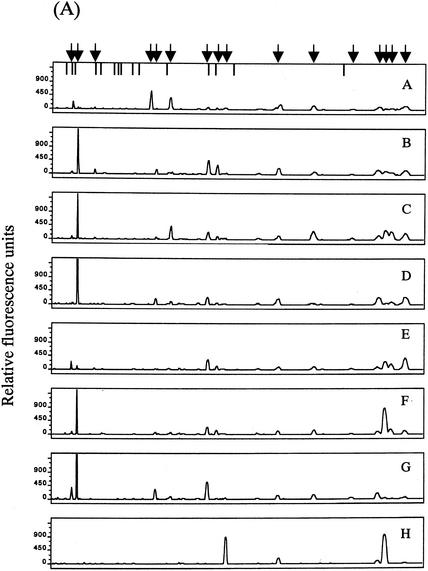
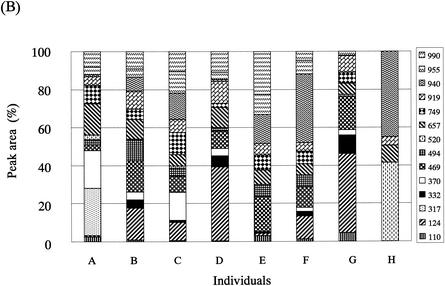
The T-RFLP analysis was performed with fecal DNAs from eight individuals. Overall, eight dominant OTUs with lengths of 109 ± 2, 123 ± 1, 130 ± 2, 138 ± 1, 159 ± 2, 251, 308 ± 3, and 377 ± 3 bp in the case of digestion with RsaI plus BfaI (designated OTUR-B) (Fig. 5A) and 14 dominant OTUs with lengths of 110 ± 2, 124 ± 2, 317 ± 2, 332 ± 2, 370 ± 2, 469 ± 2, 494 ± 2, 520 ± 2, 657 ± 5, 749 ± 4, 919 ± 4, 940 ± 5, 955 ± 5, and 990 ± 5 bp in the case of digestion with BslI (designated OTUBsl) (Fig. 6A) were detected. The size distribution of these OTUs in the T-RFLP profile derived from each enzyme digestion showed good agreement with that of the T-RFs produced by in silico digestion of 16S rRNA gene sequences from the intestinal bacteria with the same enzyme, although there is a minor difference in size due to the accuracy limitations of electrophoresis. The T-RFLP profiles from the individuals were highly distinctive from one another. The D values between the profiles from different individuals ranged from 8.8 to 76.0 for RsaI-plus-BfaI digestion (Fig. 5B) and from 23.8 to 88.0 for BslI digestion (Fig. 6B), while the D values between the profiles from T-RFLP analyses with two different DNA preparations extracted from the same fecal sample ranged from 1.7 to 10.2 (average of 5.5) for RsaI-plus-BfaI digestion and from 1.5 to 11.0 (average of 4.5) for BslI digestion. This indicates that our T-RFLP method has the capacity to distinguish between the variation in the fecal bacterial communities observed among individuals.
FIG. 5.
T-RFLP profiling of fecal samples from different individuals with RsaI-plus-BfaI digestion. (A) Electropherograms of the T-RFs produced by RsaI-plus-BfaI digestion of 16S rRNA gene amplicons from fecal DNAs of eight individuals (individual A, 48-year-old male; individual B, 49-year-οld female; individual C, 38-year-old male; individual D, 38-year-old male; individual E, 2-year-old female; individual F, 37-year-old male; individual G, 2-month-old female; individual H, 2-week-old female). Arrows and bars are as described for Fig. 4. (B) Relative abundances of OTUs in each electropherogram. Peak area is expressed as an average from experiments with two different DNA preparations from the same fecal sample. The numbers in the key indicate OTUs.
FIG. 6.
T-RFLP profiling of fecal samples from different individuals with BslI digestion. (A) Electropherograms of the T-RFs produced by BslI digestion of 16S rRNA gene amplicons from the fecal DNAs of eight individuals (A to H). Arrows indicate the positions of OTUs: 110, 124, 160, 317, 332, 370, 469, 494, 520, 657, 749, 853, 919, 940, 995, and 990 bp from the left side. Vertical bars are as described for Fig. 2. (B) Relative abundances of OTUs in each electropherogram. Peak area is expressed as an average from experiments with two different DNA preparations from the same fecal sample. The numbers in the key indicate OTUs.
Assignment of bacterial groups to OTUs.
By comparing the results of the computer simulation shown in Fig. 1, we attempted to assign bacterial groups to some OTUs in Fig. 5 and Fig. 6 (Table 1). Since the in silico digestion of 16S rRNA gene sequences from many strains belonging to the genus Bifidobacterium with BslI gave a unique 127-bp T-RF, the 124-bp OTUBsl in the T-RFLP profiles of fecal 16S rRNA genes from some individuals was predicted to represent the genus Bifidobacterium. Accordingly, the 123-bp OTUR-B was also predicted to represent the genus Bifidobacterium, although there is a small possibility that it represents a few strains belonging to the genus Clostridium. The preferential correspondences of the 251-bp OTUR-B to the genus Eubacterium, the 317-bp OTUBsl to the genus Prevotella, the 853-bp OTUBsl to Bacteroides, and the 130- and 159-bp OTUR-B and the 494-, 749-, 919-, and 955-bp OTUBsl to the Clostridium-Eubacterium group were predicted. It was difficult to relate each of the other OTUs to a specific bacterial group, since these OTUs were predicted to be produced by the enzyme digestions of 16S rRNA gene amplicons from phylogenetically different bacterial groups. However, considering the reports that the Bacteroides group, the Clostridium coccides group, and the Clostridium leptum group constitute over half of adult human fecal flora (4), the unassigned OTUs may be considered to represent the Bacteroides group and/or the Clostridium-Eubacterium group. Moreover, since streptococci and enterococci are considered to be predominant in infant feces (3), these bacteria may be represented by, in this case, the 109- and 308-bp OTUs and the 377-bp OTU, respectively, in the T-RFLP analysis with BfaI-plus-RsaI digestion and by the 332- and 657-bp OTUs and the 520- and 657-bp OTUs, respectively, in the T-RFLP analysis with BslI digestion.
To validate the above prediction, we analyzed the clone libraries constructed from fecal 16S rRNA gene amplicons of individual C (38 years old) and G (2 months old) The results are summarized in Table 1. These results supported a rather large part of the prediction and, moreover, they allowed us to predict the preferential correspondences of the 110-bp OTUBsl to Veillonella, the 332-bp OTUBsl to streptococci, the 370-bp OTUBsl to Bacteroides, the 469-bp OTUBsl to Bacteroides, and the 520-bp OTUBsl to enterococci.
The 377-bp OTUR-B is roughly divided into the 373-bp T-RF and the T-RFs of other lengths. These T-RFs were detected as different peaks in T-RFLP profiles derived from some individuals; in this case, the 373-bp T-RF may represent the Bacteroides group (Table 1).
Identification of OTU-representing bacterial species by cloning of T-RFs.
In the DGGE-TGGE analysis, characteristic bands are cloned and sequenced after their purification by repetition of PCR followed by further DGGE-TGGE to identify bacterial species from which the bands are derived. However, in T-RFLP analysis, cloning and sequencing of the T-RFs has not been tried so far, which is probably due to the high complexity of T-RF patterns. Our T-RFLP method provides moderately complex profiles with comparatively evenly distributed OTUs. Therefore, this method enables relatively accessible cloning of the OTUs followed by sequencing without further purification of T-RFs.
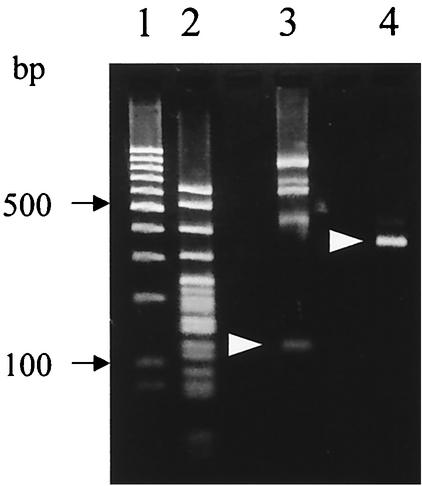
As examples, we separated T-RFs that composed the 124-bp OTUBsl from individual G (2 months old) and the 377-bp OTUR-B from individual H (2 weeks old) (Fig. 7) and cloned them into E. coli DH5α as described in Materials and Methods. In the first case, of the insert DNA sequences from 12 transformants, 11 sequences (124 bp long, including the 516f sequence) were determined, within which there were four sequence variants with one to three base substitutions. The sequences showed over 99% similarity to the corresponding sequences of some kinds of bifidobacteria (for example, B. catenulatum [accession no. AF432082] and B. breve [AF491836]). This result together with the above-mentioned results indicates that the 124-bp OTUBsl was derived from bifidobacteria and that our T-RFLP method makes it possible to readily detect and monitor bifidobacteria in the fecal community. The remaining sequence (111 bp long), which is presumably derived from the 110-bp OTUBsl in individual G, showed 100% similarity to the corresponding sequence of Allisonella histaminiformans (AF548373). In the second case, of the insert DNA sequences from 12 transformants, nine sequences (376 bp long) were determined, within which there were three sequence variants with one or two base substitutions. The sequences showed over 99% similarity to the corresponding sequence of E. coli (AE005607) or related bacterial species (for example, Shigella sonnei [X96964]). The remaining three sequences (377 bp long), which contained two sequence variants with one substitution, showed over 99% similarity to the corresponding sequences of some kinds of enterococci (for example, E. casseliflavus [AF367978] and E. gallinarum [AJ420805]). This result for individual H shows good agreement with the report of Favier et al. (3), who detected DGGE bands derived from E. coli and Enterococcus spp. in the feces during the first few days of life.
FIG. 7.
Fractionation of T-RFs by agarose gel electrophoresis. T-RFs produced by BslI digestion of 16S rRNA gene amplicons from a fecal sample of individual G (lane 3) or by RsaI-plus-BfaI digestion of those from a fecal sample of individual H (lane 4) were electrophoresed on a 3% agarose gel as described in Materials and Methods. Arrowheads in lanes 3 and 4 represent the positions of 124-bp OTUBsl and 377-bp OTUR-B, respectively. Lane 1, 100-bp ladder marker (MBI Fermentas); lane 2, pBR322×MspI marker (Nippon Gene).
In conclusion, we have developed a new T-RFLP analysis method in which new primer-enzyme combinations were used. This method had high reproducibility and throughput and low cost of performance. Therefore, this system is considered to be useful for monitoring or mass screening of fecal samples prior to detailed analysis using FISH or cultivation of bacteria. In addition, the procedure allows the cloning and sequencing of the T-RFs characteristic of either a healthy condition or some types of diseases and allows identification of the bacterial species from which the T-RFs were derived. Since the nucleotide sequence data from the 16S rRNA gene clone library can be directly related to the OTUs detected by T-RFLP analysis, collection of such types of data from some individuals will increase the utility of our T-RFLP method. We have been acquiring more sequencing data from the clone library. It is expected that the accumulation of the T-RFLP profile data derived from different individuals will provide us with new insights into the relationships between a host and its microflora.
Acknowledgments
We thank all of the individuals who supplied the fecal samples and Akira Hiraishi (Toyohashi University of Technology, Toyohashi, Japan) for providing Bioclust software to calculate D values. We also thank Emiko Kobayashi and Kimiko Minamida for their excellent assistance.
REFERENCES
- 1.Braker, G., H. L. Ayala-del-Río, A. H. Devol, A. Fesefeldt, and J. M. Tiedje. 2001. Community structure of denitrifiers, bacteria, and archaea along redox gradients in pacific northwest marine sediments by terminal restriction fragment length polymorphism analysis of amplified nitrite reductase (nirS) and 16S rRNA genes. Appl. Environ. Microbiol. 67:1893-1901. [DOI] [PMC free article] [PubMed] [Google Scholar]
- 2.Brakstad, O. G., K. Asbakk, and J. A. Maeland. 1992. Detection of Staphylococcus aureus by polymerase chain reaction amplification of the nuc gene. J. Clin. Microbiol. 30:1654-1660. [DOI] [PMC free article] [PubMed] [Google Scholar]
- 3.Favier, C. F., E. E. Vaughan, W. M. de Vos, A. D. Akkermans. 2002. Molecular monitoring of succession of bacterial communities in human neonates. Appl. Environ. Microbiol. 68:219-226. [DOI] [PMC free article] [PubMed] [Google Scholar]
- 4.Franks, A. H., H. J. M. Harmsen, G. C. Raangs, G. J. Jansen, F. Schut, and G. W. Welling. 1998. Variation of bacterial populations in human feces measured by fluorescent in situ hybridization with group-specific 16S rRNA-targeted oligonucleotide probes. Appl. Environ. Microbiol. 64:3336-3345. [DOI] [PMC free article] [PubMed] [Google Scholar]
- 5.Gong, J., R. J. Forster, H. Yu, J. R. Chambers, P. M. Sabour, R. Wheatcroft, and S. Chen. 2002. Diversity and phylogenetic analysis of bacteria in mucosa of chicken ceca and comparison with bacteria in the cecal lumen. FEMS Microbiol. Lett. 208:1-7. [DOI] [PubMed] [Google Scholar]
- 6.Harmsen, H. J., G. R. Gibson, P. Elfferich, G. C. Raangs, A. C. Wildeboer-Veloo, A. Argaiz, M. B. Roberfroid, and G. W. Welling. 2000. Comparison of viable cell counts and fluorescence in situ hybridization using specific rRNA-based probes for the quantification of human fecal bacteria. FEMS Microbiol. Lett. 183:125-129. [DOI] [PubMed] [Google Scholar]
- 7.Harmsen, H. J., A. C. Wildeboer-Veloo, G. C. Raangs, A. A. Wagendorp, N. Klijn, J. G. Bindels, and G. W. Welling. 2000. Analysis of intestinal flora development in breast-fed and formula-fed infants by using molecular identification and detection methods. J. Pediatr. Gastroenterol. Nutr. 30:61-67. [DOI] [PubMed] [Google Scholar]
- 8.Hiraishi, A., M. Iwasaki, and H. Shinjo. 2000. Terminal restriction pattern analysis of 16S rRNA genes for the characterization of bacterial communities of activated sludge. J. Biosci. Bioeng. 90:148-156. [DOI] [PubMed] [Google Scholar]
- 9.Langendijik, P. S., F. Schut, G. J. Jansen, G. C. Raangs, G. R. Kamphuis, M. H. F. Wilkinson, and G. W. Welling. 1995. Quantitative fluorescence in situ hybridization of Bifidobacterium spp. with genus-specific 16S rRNA-targeted probes and its application in fecal samples. Appl. Environ. Microbiol. 61:3069-3075. [DOI] [PMC free article] [PubMed] [Google Scholar]
- 10.Leser, T. D., R. H. Lindecrona, T. K. Jensen, B. B. Jensen, and K. Møller. 2000. Changes in bacterial community structure in the colon of pig fed different experimental diets and after infection with Brachyspira hyodysenteriae. Appl. Environ. Microbiol. 66:3290-3296. [DOI] [PMC free article] [PubMed] [Google Scholar]
- 11.Liu, W., T. L. Marsh, H. Cheng, and L. J. Forney. 1997. Characterization of microbial diversity by determining terminal restriction fragment length polymorphism of genes encoding 16S rRNA. Appl. Environ. Microbiol. 63:4516-4522. [DOI] [PMC free article] [PubMed] [Google Scholar]
- 12.Marsh, T. L., P. Saxman, J. Cole, and J. Tiedje. 2000. Terminal-restriction fragment length polymorphism analysis program, a web-based research tool for microbial community analysis. Appl. Environ. Microbiol. 66:3616-3620. [DOI] [PMC free article] [PubMed] [Google Scholar]
- 13.McCracken, V. J., J. M. Simpson, R. I. Mackie, and H. R. Gaskins. 2001. Molecular ecological analysis of dietary and antibiotic-induced alterations of the mouse intestinal microbiota. J. Nutr. 131:1862-1870. [DOI] [PubMed] [Google Scholar]
- 14.Moeseneder, M. M., J. M. Arrieta, G. Muyzer, C. Winter, and G. J. Herndl. 1999. Optimization of terminal-restriction fragment length polymorphism analysis for complex marine bacterioplancton communities and comparison with denaturing gradient gel electrophoresis. Appl. Environ. Microbiol. 65:3518-3525. [DOI] [PMC free article] [PubMed] [Google Scholar]
- 15.Nagashima, K., T. Shimizu, K. Takeshi, M. Kawakami, D. Yasokawa, R. Nakagawa, and Y. Okumura. 2000. A simple and sensitive polymerase chain reaction method for the detection of food-related bacteria. Food Sci. Technol. Res. 6:115-118. [Google Scholar]
- 16.Osborn, A. M., E. R. Moore, and K. N. Timmis. 2000. An evaluation of terminal-restriction fragment length polymorphism (T-RFLP) analysis for the study of microbial community structure and dynamics. Environ. Microbiol. 2:39-50. [DOI] [PubMed] [Google Scholar]
- 17.Sambrook, J., E. F. Fritsch, and T. Maniatis. 1989. Molecular cloning: a laboratory manual, 2nd ed. Cold Spring Harbor Laboratory, Cold Spring Harbor, N.Y.
- 18.Simpson, J. M., V. J. McCracken, B. A. White, H. R. Gaskins, and R. I. Mackie. 1999. Application of denaturant gradient gel electrophoresis for the analysis of the porcine gastrointestinal microbiota. J. Microbiol. Methods 36:167-179. [DOI] [PubMed] [Google Scholar]
- 19.Suau, A., R. Bonnet, M. Sutren, J. Godon, G. R. Gibson, M. D. Collins, and J. Doré. 1999. Direct analysis of genes encoding 16S rRNA from complex communities reveals many novel molecular species within the human gut. Appl. Environ. Microbiol. 65:4799-4807. [DOI] [PMC free article] [PubMed] [Google Scholar]
- 20.Zhu, H., F. Qu, and L. Zhu. 1993. Isolation of genomic DNAs from plants and bacteria using benzyl chloride. Nucleic Acids Res. 21:5279-5280. [DOI] [PMC free article] [PubMed] [Google Scholar]
- 21.Zoetendal, E. G., Antoon D. L. Akkermans, and W. M. de Vos. 1998. Temperature gradient gel electrophoresis analysis of 16S rRNA from human fecal samples reveals stable and host-specific communities of active bacteria. Appl. Environ. Microbiol. 64:3854-3859. [DOI] [PMC free article] [PubMed] [Google Scholar]
- 22.Zoetendal, E. G., K. Ben-Amor, A. D. Akkermans, T. Abee, and W. M. de Vos. 2001. DNA isolation protocols affect the detection limit of PCR approaches of bacteria in samples from the human gastrointestinal tract. Syst. Appl. Microbiol. 24:405-410. [DOI] [PubMed] [Google Scholar]


