Abstract
During growth of high-cell-density cultures of Escherichia coli, overproduction of recombinant proteins often results in increased stress response, cell filamentation, and growth cessation. Filamentation of cells consequently lowers final achievable cell concentration and productivity of the target protein. Reported here is a methodology that should prove useful for the enhancement of cell growth and protein productivity by the suppression of cell filamentation. By the coexpression of the E. coli ftsA and ftsZ genes, which encode key proteins in cell division, growth of recombinant strains as well as production of human leptin and human insulin-like growth factor I was improved. Observation of cell morphology revealed that the coexpression of the ftsA and ftsZ genes successfully suppressed filamentation caused by the accumulation of recombinant proteins.
Escherichia coli has been the workhorse for the production of recombinant proteins because of fast growth, well-known genetic characteristics, and the availability of various tools for gene expression (9). In general, experiments for the overproduction of recombinant proteins begin by the cloning of a gene for the desired protein into a multicopy plasmid under the control of a strong inducible promoter. This approach has been successful in producing large amounts of some proteins but has often resulted in slow growth, increased stress response, and eventually cessation of growth (5, 13). One of the frequent observations during the recombinant protein production in E. coli is that of the filamentation of cells. Cell filamentation causes a reduction in growth rate or no further cell division, which results in low cell concentration and low productivity of the target proteins.
Cell division in E. coli is a complex process that requires temporal and spatial coordination of the activities of multiple gene products. At least nine proteins, FtsZ, FtsA, FtsI (PBP3), FtsK, FtsL, FtsN, FtsQ, FtsW, and ZipA, have been shown to be essential components during division process (4). Among these, FtsZ plays a key role, as it initiates cell division by forming a ring-like structure and invaginating the cell wall circumferentially at the prospective division site (11). The E. coli mutant lacking the ftsZ gene was shown to undergo severe filamentation, which can be suppressed by the overexpression of the ftsZ gene (1, 2). However, it should be noted that overexpression of the ftsZ gene can also cause severe cell filamentation or the formation of minicells (14). We also obtained similar results showing that cells underwent filamentation when the ftsZ gene only was coexpressed in recombinant E. coli producing human leptin (data not shown). Some evidence exists that for proper cell division, the fts gene products must be present at appropriate levels (2, 3). In particular, the proper ratio of FtsA to FtsZ (1:100) is required for active cell division. Increase or decrease of this ratio can lead to inhibition of the division process (2). We constructed a plasmid, pACfAZ2, that constitutively coexpresses both the E. coli ftsA and ftsZ genes. Recombinant E. coli strains overproducing human leptin and insulin-like growth factor I (IGF-I) were transformed with pACfAZ2 and were subsequently examined for their growth and protein production during high-cell-density cultivation (HCDC).
Bacterial strains and plasmids.
Bacterial strains and plasmids used in this study are listed in Table 1. E. coli XL1-Blue was used as a host strain for the cloning and maintenance of plasmids. E. coli TG1 and W3110 were used for the production of human leptin and human IGF-I fusion protein, respectively.
TABLE 1.
Bacterial strains and plasmids used in this study
| Strain or plasmid | Relevant characteristics | Reference or source |
|---|---|---|
| E. coli strains | ||
| XL1-Blue | supE44 hsdR17 recA1 endA1 gyrA96 thi relA1 lac F′ [proAB+lac1qlacZΔM15 Tn10(Tet)] | Stratagenea |
| W3110 | Derived from K-12, λ−, F−, prototrophic | Lab stock |
| TG1 | F′ traD36 lacIq Δ(lacZ)M15 proA+B+/supEΔ (hsdM-mcrB) 5 (rk− mk− mcrB−) thi Δ(lac-proAB) | Lab stock |
| Plasmids | ||
| pUC18 | 2.7 kb, Apr | New England Biolabsb |
| pRL22 | 6.4 kb, Apr, trp promoter, cheY and cheZ genes | 12 |
| pACYC177 | 3.9 kb, Apr, Kmr | New England Biolabs |
| pTrc99A | 4.2 kb, Apr, trc promoter | Pharmaciac |
| pYKM-I1 | 6.9 kb, Apr, tac promoter, β-galactosidase-IGF-I fused gene | 7 |
| pEDOb5 | 5.9 kb, Apr, obese gene, T7 promoter | 6 |
| p18Ob5 | 3.2 kb, Apr, obese gene | This study |
| pRLOb5 | 5.0 kb, Apr, trp promoter, obese gene | This study |
| pTrpAObT | 4.8 kb, Apr, trp promoter, obese gene | This study |
| pACfAZ2 | 6.3 kb, Kmr, ftsA and ftsZ in pACYC177 | This study |
Stratagene Cloning Systems, La Jolla, Calif.
New England Biolabs, Inc., Beverly, Mass.
Pharmacia Biotech, Uppsala, Sweden.
Gene manipulation.
For the construction of a plasmid coexpressing the E. coli ftsA and ftsZ genes, both genes were amplified from E. coli W3110 chromosomal DNA by PCR as follows: the forward primer 5′-GGCGGGGATCCTTTTCCTGCTG-3′ and the reverse primer 5′-GGGACTGCAGATATTCGATATCACGC-3′ were designed to contain BamHI and PstI sites, respectively (underlined). The PCR product digested with BamHI and PstI was cloned into pACYC177 to yield pACfAZ2, in which the ftsA and ftsZ genes are expressed from their own constitutive promoters. For the production of human leptin, plasmid pTrpAObT was constructed as follows: pEDOb5 was digested with XbaI and EcoRI, and the fragment containing the human obese gene, which encodes the human leptin, was cloned into pUC18. The resulting plasmid, p18Ob5, was digested with BamHI and HindIII and was cloned into the downstream region of the trp promoter in pRL22 to yield pRLOb5. The SspI-BamHI fragment of pRLOb5 containing the trp promoter and the obese gene was cloned into pTrc99A digested with PvuII and BamHI to yield pTrpAObT. For the inducible expression of human IGF-I fusion protein, plasmid pYKM-I1 was used. In this plasmid, the IGF-I gene fused to the end of a truncated β-galactosidase (163 amino acids) gene is expressed from the inducible tac promoter.
Fed-batch culture conditions.
Growth of fed-batch cultures was carried out in a 6.6-liter-jar fermentor (Bioflo 3000; New Brunswick Scientific Co., Edison, N.J.) at 37°C. Seed culture was prepared in a 1-liter flask containing 200 ml of Luria-Bertani medium (tryptone [10 g/liter], yeast extract [5 g/liter], NaCl [5 g/liter]) at 37°C and 250 rpm in a rotary shaker. For the production of leptin in E. coli TG1 the seed culture was transferred into the fermentor, which contained 1.8 liters of R/2 medium (6) plus 20 g of glucose/liter and 2 g of yeast extract/liter. Culture pH was maintained at 6.8, except for the periods of pH rise following glucose depletion, by the addition of 16.5 M NH4OH. The dissolved oxygen concentration was controlled at 40% of air saturation by automatically increasing the agitation speed up to 1,000 rpm and by the change of pure-oxygen percentage. Nutrient feeding solution containing 700 g of glucose/liter and 20 g of MgSO47H2O/liter was added according to the pH-stat (with high limit) feeding strategy (9). When the pH rose to a value greater by 0.08 than that of its set point (6.8) due to the depletion of glucose, the appropriate volume of the feeding solution was automatically added to increase the glucose concentration in the culture broth to 0.7 g/liter. Expression of the obese gene was automatically induced by the depletion of tryptophan in the initial medium without the addition of any inducer, such as 3-β-indoleacrylic acid. For the production of IGF-I fusion protein in E. coli W3110, growth of the pH-stat fed-batch cultures was carried out as described above with the following changes. Seed culture was transferred into the fermentor, which contained 1.8 liters of R/2 medium plus 20 g of glycerol/liter and 2 g of yeast extract/liter. Nutrient feeding solution containing 500 g of glycerol/liter, 50 g of yeast extract/liter, and 20 g of MgSO47H2O/liter was added according to the pH-stat feeding strategy described above. Expression of the β-galactosidase-IGF-I fusion gene was induced at an optical density at 600 nm (OD600) of 30 by the addition of isopropyl-β-d-thiogalactopyranoside (IPTG; Sigma Chemical Co., St. Louis, Mo.) to a concentration of 1 mM. Ampicillin and kanamycin were added at concentrations of 50 and 25 mg/liter, respectively, depending on the plasmids employed.
Analytical methods.
Cell growth was monitored by measuring absorbance at OD600. Dry cell weight (DCW) (in grams per liter) was determined as described previously (10). Protein samples were analyzed by electrophoresis on a sodium dodecyl sulfate-12% (wt/vol) polyacrylamide electrophoresis gel (8). The protein bands were visualized with Coomassie brilliant blue stain. The contents of leptin and IGF-I in total protein were quantified with a GS710 calibrated imaging densitometer (Bio-Rad, Hercules, Calif.), and the total protein concentration was determined with a Bio-Rad protein assay kit with bovine serum albumin as a standard. The concentrations of leptin and IGF-I produced during growth of the fed-batch cultures were calculated from the total protein concentration, and the content was determined by densitometric scanning. The morphologies of cells were observed by phase-contrast microscopy (OPTIPHOT-2; Nikon Co., Tokyo, Japan).
Effect of ftsA and ftsZ coexpression on leptin production.
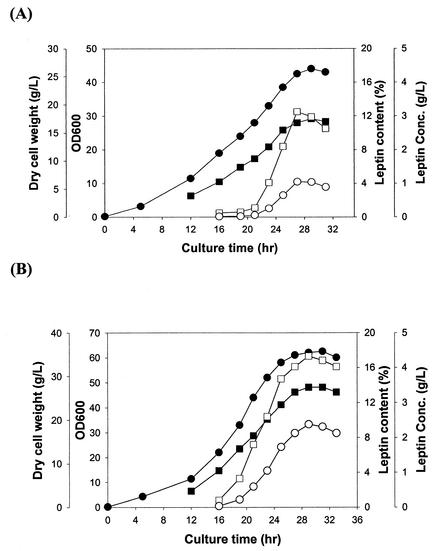
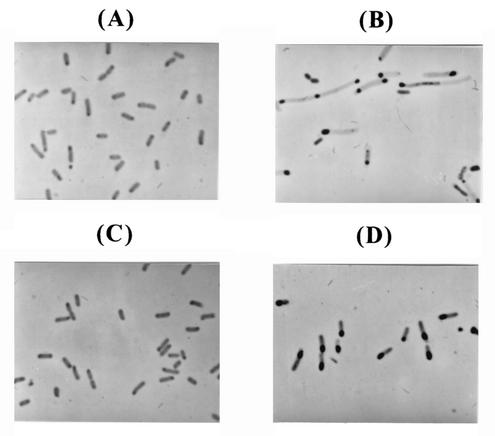
First, the effect of coexpression of the ftsA and ftsZ genes on human leptin production was examined. The pH-stat fed-batch cultures of E. coli TG1 harboring pTrpAObT and E. coli TG1 harboring pTrpAObT and pACfAZ2 were carried out. In the fed-batch culture of E. coli TG1 harboring pTrpAObT (Fig. 1A), the specific growth rate was 0.10 h−1. The maximum cell concentration of 17.5 g of DCW/liter was obtained in 29 h. Leptin was actively produced from 21 h, and the leptin content reached 12.5% of total protein (1.05 g of leptin/liter) at 27 h and then decreased. The volumetric productivity of leptin was 0.04 g/liter/h. Cells were normal at the beginning of the culture (Fig. 2A) but underwent filamentation after the accumulation of recombinant leptin (Fig. 2B). In the fed-batch culture of E. coli TG1 harboring pTrpAObT and pACfAZ2 (Fig. 1B), the specific growth rate was 0.13 h−1. The maximum cell concentration of 27.5 g of DCW/liter was obtained in 29 h. Active production of human leptin started at 16 h, which was earlier than that observed without the coexpression of the fts genes. Leptin concentration and content reached 2.38 g of leptin/liter and 17.3% of total protein, respectively, at 29 h. The volumetric productivity of leptin was 0.08 g/liter/h. Cells maintained normal shape and length even though larger leptin inclusion bodies were accumulated (Fig. 2C and D). Therefore, it can be concluded that the coexpression of the ftsA and ftsZ genes increased both the specific growth rate of recombinant E. coli (1.3-fold) and the volumetric productivity of leptin (2-fold).
FIG. 1.
Time profiles of cell density (OD600 [•]), DCW (grams per liter [▪]), leptin concentration (grams per liter [○]), and leptin content in total protein (percent [□]) during the growth of fed-batch cultures of E. coli TG1 harboring pTrpAObT (A) and E. coli TG1 harboring pTrpAObT and pACfAZ2 (B).
FIG. 2.
Morphologies of recombinant E. coli cells as observed by phase-contrast microscopy. (A and B) E. coli TG1 harboring pTrpAObT; (C and D) E. coli TG1 harboring pTrpAObT and pACfAZ2. Panels A and C depict cells observed at 5 h, while panels B and D depict those observed at 29 h. Black inclusions inside the cells are leptin inclusion bodies.
Effect of ftsA and ftsZ coexpression on IGF-I fusion protein production.
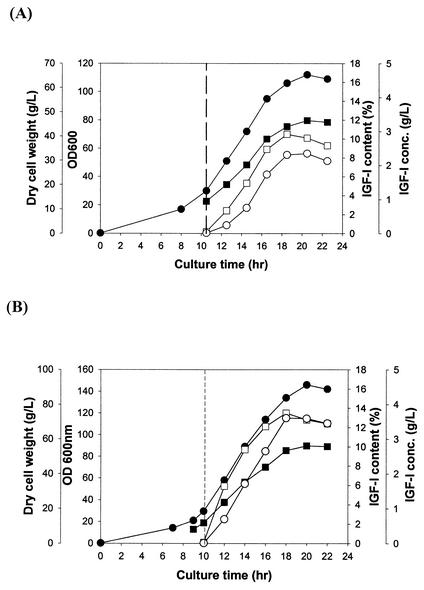
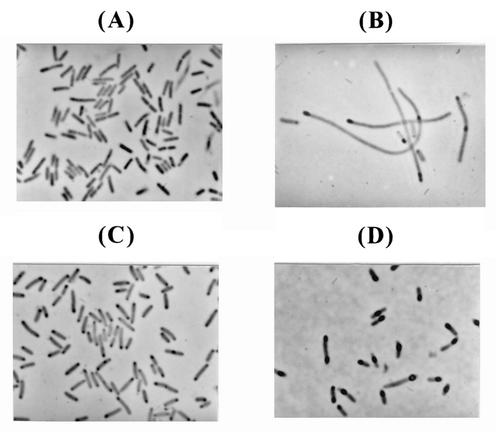
To examine whether this strategy can also be applied to other expression and fermentation systems, growth of fed-batch cultures of another recombinant E. coli strain was carried out for the production of IGF-I fusion protein under the control of the tac promoter with glycerol as a carbon source. Again, the control strain E. coli W3110 harboring pYKM-I1 was compared with E. coli W3110 harboring pYKM-I1 and pACfAZ2. In both cultures, cells were induced with 1 mM IPTG at an OD600 of 30, which resulted in the accumulation of IGF-I fusion protein as inclusion bodies. In the fed-batch culture of E. coli W3110 harboring pYKM-I1 (Fig. 3A), the specific growth rate was 0.18 h−1 and the maximum cell concentration was 46.5 g of DCW/liter at 20 h. The IGF-I fusion protein content reached 10.5% of total protein at 8 h after induction, and the maximum IGF-I fusion protein concentration of 2.31 g of IGF-I fusion protein/liter was obtained after 2 more hours. The volumetric productivity of IGF-I fusion protein was 0.23 g/liter/h. In the fed-batch culture of E. coli W3110 harboring pYKM-I1 and pACfAZ2 (Fig. 3B), the specific growth rate was 0.23 h−1 and the maximum cell concentration was 56.3 g of DCW/liter at 20 h. The content and maximum concentration of IGF-I fusion protein reached 13.5% of the total proteins and 3.6 g/liter, respectively, at 8 h after induction. The volumetric productivity of IGF-I fusion protein was 0.45 g/liter/h. As in the case of the leptin production described earlier, the coexpression of the ftsA and ftsZ genes increased both the specific growth rate (1.3-fold) and volumetric productivity (1.9-fold) of IGF-I fusion protein. In 2 h after induction, the morphologies of the cells were similar in both cultures (Fig. 4A and C). After the accumulation of IGF-I fusion protein (8 h after induction), cells without the fts coexpression system underwent severe filamentation (Fig. 4B), which was suppressed by the coexpression of the ftsA and ftsZ genes (Fig. 4D). From these results obtained in two separate expression and fermentation systems, it can be concluded that the coexpression of the ftsA and ftsZ genes can suppress cell filamentation during protein overproduction and consequently enhance cell growth and protein productivity.
FIG. 3.
Time profiles of cell density (OD600 [•]), DCW (grams per liter [▪]), IGF-I fusion protein (grams per liter [○]), and IGF-I fusion protein content in total protein (percent [□]) during the growth of fed-batch cultures of E. coli W3110 harboring pYKM-I1 (A) and E. coli W3110 harboring pYKM-I1 and pACfAZ2 (B). Vertical dashed lines indicate the time of induction with 1 mM IPTG.
FIG. 4.
Morphologies of recombinant E. coli cells as observed by phase-contrast microscopy. (A and B) E. coli W3110 harboring pYKM-I1; (C and D) E. coli W3110 harboring pYKM-I1 and pACfAZ2. Panels A and C depict cells observed at 1 h after induction, while panels B and D depict those observed at 8 h after induction. Black inclusions inside the cells are inclusion bodies of IGF-I fusion protein.
In conclusion, we report a novel methodology for suppressing cell filamentation that should prove useful for the enhancement of cell growth and productivity of recombinant proteins. The primary goal of HCDC is the cost-effective production of desired product by achieving higher volumetric productivity. Reduced growth rate and lower protein productivity have been the typical problems observed during HCDC. Since most industrial processes for the production of recombinant proteins involve HCDC, the strategy of suppressing cell filamentation by the coexpression of the essential cell division proteins (FtsA and FtsZ) as demonstrated in this paper should prove useful for the enhanced production of recombinant proteins by HCDC.
Acknowledgments
This work was supported by the Korean Ministry of Commerce, Industry, and Energy and by the National Research Laboratory program of the Korean Ministry of Science and Technology. Further support from LG Chem Investment Ltd., Samchully Pharmaceutical Co., and BioLeaders Co. is also appreciated. K.J.J. is a postdoctoral fellow supported by the Brain Korea 21 project.
REFERENCES
- 1.Addinall, S. G., and J. Lutkenhaus. 1996. FtsZ-spirals and -arcs determine the shape of the invaginating septa in some mutants of Escherichia coli. Mol. Microbiol. 22:231-237. [DOI] [PubMed] [Google Scholar]
- 2.Dai, K., and J. Lutkenhaus. 1992. The proper ratio of FtsZ to FtsA is required for cell division to occur in Escherichia coli. J. Bacteriol. 174:6145-6151. [DOI] [PMC free article] [PubMed] [Google Scholar]
- 3.Dewar, S. J., K. J. Begg, and W. D. Donachie. 1992. Inhibition of cell division initiation by an imbalance in the ratio of FtsA to FtsZ. J. Bacteriol. 174:6314-6316. [DOI] [PMC free article] [PubMed] [Google Scholar]
- 4.Donachie, W. D. 2001. Co-ordinate regulation of the Escherichia coli cell cycle or the cloud of unknowing. Mol. Microbiol. 40:779-785. [DOI] [PubMed] [Google Scholar]
- 5.Dong, H., and C. G. Kurland. 1996. Bacterial growth inhibition by overproduction of proteins. Mol. Microbiol. 21:1-4. [DOI] [PubMed] [Google Scholar]
- 6.Jeong, K., J., and S. Y. Lee. 1999. High-level production of human leptin by fed-batch cultivation of recombinant Escherichia coli and its purification. Appl. Environ. Microbiol. 65:3027-3032. [DOI] [PMC free article] [PubMed] [Google Scholar]
- 7.Kim, S. O., and Y. I. Lee. 1996. High-level expression and simple purification of recombinant human insulin-like growth factor-I. J. Biotechnol. 48:97-105. [DOI] [PubMed] [Google Scholar]
- 8.Laemmli, U. K. 1970. Cleavage of structural proteins during the assembly of the head of bacteriophage T4. Nature 227:680-685. [DOI] [PubMed] [Google Scholar]
- 9.Lee, S. Y. 1996. High cell-density culture of Escherichia coli. Trends. Biotechnol. 14:98-105. [DOI] [PubMed] [Google Scholar]
- 10.Lee, S. Y., and H. N. Chang. 1994. Effect of complex nitrogen source on the synthesis and accumulation of poly(3-hydroxybutyric acid) by recombinant Escherichia coli in flask and fed-batch cultures. J. Environ. Polym. Degrad. 2:169-176. [Google Scholar]
- 11.Lutkenhaus, J. 1993. FtsZ ring in bacterial cytokinesis. Mol. Microbiol. 9:403-409. [DOI] [PubMed] [Google Scholar]
- 12.Matsumura, P., J. J. Rydel, R. Linzmeier, and D. Vacante. 1984. Overexpression and sequence of the Escherichia coli cheY gene and biochemical activities of the CheY protein. J. Bacteriol. 160:36-41. [DOI] [PMC free article] [PubMed] [Google Scholar]
- 13.Rinas, U., T. C. Boone, and J. E. Bailey. 1993. Characterization of inclusion bodies in recombinant Escherichia coli producing high levels of porcine somatotropin. J. Biotechnol. 28:313-320. [DOI] [PubMed] [Google Scholar]
- 14.Ward, J. E., and J. Lutkenhaus. 1985. Overproduction of FtsZ induces minicell formation in E. coli. Cell 42:941-949. [DOI] [PubMed] [Google Scholar]


