Abstract
Human B19 erythrovirus is a ubiquitous viral pathogen, commonly infecting individuals before adulthood. As with all autonomous parvoviruses, its small single-stranded DNA genome is replicated with host cell machinery. While the mechanism of parvovirus genome replication has been studied in detail, the rate at which B19 virus evolves is unknown. By inferring the phylogenetic history and evolutionary dynamics of temporally sampled B19 sequences, we observed a surprisingly high rate of evolutionary change, at approximately 10−4 nucleotide substitutions per site per year. This rate is more typical of RNA viruses and suggests that high mutation rates are characteristic of the Parvoviridae.
Human B19 erythrovirus was first discovered in the serum of healthy blood donors (3) and has since been detected worldwide. Infection usually occurs in childhood, through respiratory droplets, and by age 15 approximately 50% of children have antibodies to the virus. Most childhood infections are asymptomatic, with erythema infectiosum, probably caused by the formation of immune complexes, the most frequent complication. In adults, however, infection often results in arthropathy and in some cases causes transient aplastic crisis. In immunocompromised individuals a persistent infection usually occurs, resulting in red cell aplasia, while transplacental transmission can lead to miscarriage or hydrops fetalis (22).
Human erythroviruses belong to the family Parvoviridae, whose single-stranded (ss) DNA genomes are among the smallest of all DNA viruses. B19 virus is ∼5.5 kb in length with two major open reading frames flanked by inverted terminal repeats, part of which form hairpin stems for priming replication through a double-stranded (ds) intermediate (2). The first open reading frame encodes the nonstructural (NS1) protein, while the second encodes the capsid proteins VP1 and VP2, which are in frame and colinear with the exception of an additional 227 amino acids at the N terminus of VP1. Amino acid variability is high in the VP1 unique region (19), which is surface exposed and the target site of neutralizing antibodies (8, 13).
Unlike large dsDNA viruses, all autonomous parvoviruses replicate with host cell machinery (10). A common assumption in studies of viral evolution is that DNA viruses have low rates of evolutionary change, near those of their hosts, as observed in the large dsDNA herpesviruses (7, 14) and the small dsDNA human papillomaviruses (1). However, it was recently observed that one group of small ssDNA viruses, the carnivore parvoviruses, have a rate of nucleotide substitution many orders of magnitude higher, at approximately 1 × 10⁻⁴ substitutions/site/year, that is within the range seen in RNA viruses (17). It is currently unclear whether this unexpectedly high rate is characteristic of the carnivore parvoviruses alone or whether it typifies the entire Parvoviridae family. To address this issue we estimated the rate of nucleotide substitution in the human virus B19, a distant relative of the carnivore parvoviruses.
B19 sequences (human erythrovirus genotype 1) were compiled and aligned, and isolate sampling dates were obtained through direct communication with the author or from published material. Only one sequence was taken in the case of a patient with multiple sampling times (I1) and from an outbreak with identical sequences (USA8). Two data sets were compiled: (i) 43 VP1 gene sequences (with nucleotides 1429 to 1461 and 2281 to 2346 removed because of incomplete sequencing), and (ii) 27 coding regions, beginning at position 39 of NS1 and running through the VP1 sequence described above (data not shown). Phylogenetic trees of these data were then inferred using the maximum likelihood (ML) method in PAUP* (18), employing the GTR+I+Γ4 model of nucleotide substitution, and rooted with the oldest sequence. Bootstrap support values were estimated using 1,000 replicate neighbor-joining trees under the same substitution model.
Before estimating substitution rates, we first tested for recombination using Sawyer's run test (GENECONV program [16]), which detects gene conversion events between pairs of sequences. Two possible gene conversion events were found among three Japanese isolates found in 1997 and 1998: AN40, AN41, and AN66. Specifically, genome positions 1107 to 3863 of AN40 and AN66 were significantly similar (P = 0.00070), as were positions 3805 to 4902 of AN40 and AN41 (P = 0.04972), suggesting AN40 is a recombinant of AN41 and AN66 with a breakpoint between 3805 and 3863. This was confirmed by phylogenetic analyses of positions 654 to 3804 and 3864 to 4902, which showed AN40 changing topological position (data not shown). We also inferred trees for the VP1 and NS1 components of the coding region data set. These topologies were similar with the exception of AN66 (data not shown). Thus, both recombinants, AN40 and AN66, were removed from subsequent analyses.
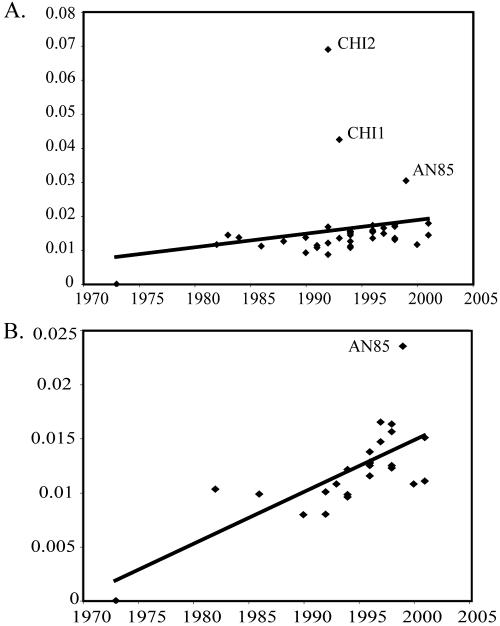
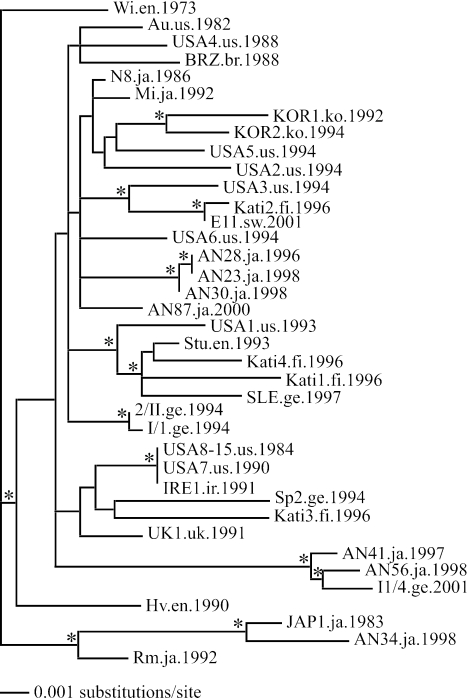
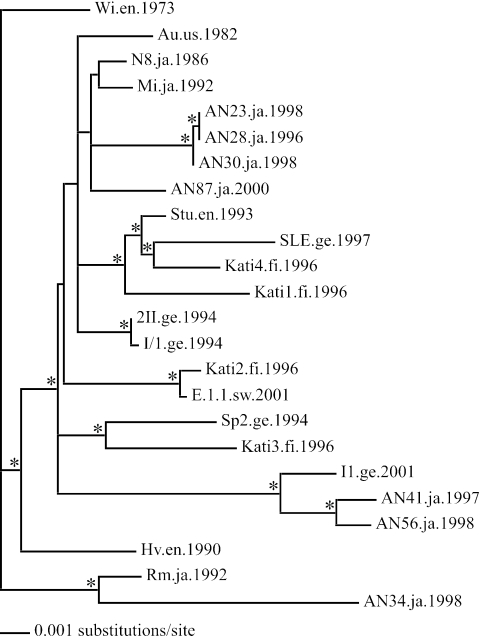
To determine if the B19 virus phylogenies exhibited adequate temporal structure for an analysis of substitution rates, we plotted the year of isolation of each sequence against its distance from the root of the tree. Figure 1 shows three possible outliers in the large VP1 data set: CHI1, CHI2, and AN85, the latter of which is also an outlier in the coding region data set. These three sequences, which formed a distinct clade with long branches, were therefore removed from the analysis. Final ML trees were constructed (Fig. 2 and 3), and the isolation year was again plotted against root-to-tip distances, with a highly significant correlation observed in both data sets (P = 5.94 × 10⁻⁶ and 5.21 × 10⁻⁶, respectively).
FIG. 1.
Linear regression plots depicting the relationship between the isolation date (year) of each B19 sequence and its distance from the root of the phylogeny (given as number of substitutions per site) for 41 VP1 sequences (A) and 25 coding region sequences (B). Outliers are labeled.
FIG. 2.
Phylogeny of the 38 B19 VP1 sequences used in the analyses of substitution rates. The tree is rooted with the oldest sampled isolate, and branch lengths are drawn to scale, with nodes showing >70% bootstrap support marked with an asterisk. Names of sequences are given along with the location and date of isolation. Abbreviations: en, England; us, United States; br, Brazil; ir, Ireland; ge, Germany; fi, Finland; uk, United Kingdom; ja, Japan; ko, Korea; sw, Sweden; ch, China.
FIG. 3.
Phylogeny of 24 B19 virus coding regions used in the substitution rate analyses. The tree is rooted with the oldest isolate. Branch lengths are drawn to scale, and nodes with >70% bootstrap support are marked with an asterisk. Names of sequences are given along with the location and date of isolation. Abbreviations are as described in the legend for Fig. 2.
To estimate viral substitution rates precisely, we used a Bayesian Markov chain Monte Carlo approach (the BEAST package [http://evolve.zoo.ox.ac.uk]). This method, which assumes a molecular clock, considers differences in branch lengths among viruses sampled at different times and explores different models whose parameters include tree topology, substitution rate, and substitution model. A Bayesian skyline plot, with 10 population size groups, was used to depict demographic structure from which substitution rates could be deduced (5). Input phylogenies were inferred using the HKY85+Γ substitution model with parameters optimized during multiple runs and with Markov chain lengths of 10 million or 100 million in analyses of 24 and 38 sequences, respectively. Mean values are reported as well as 95% high probability density (HPD) intervals. As uncertainty in the data is reflected in the HPD interval, it is imperative that all values within this interval are considered.
Analyses of both the large VP1 and coding region data sets gave high and comparable mean rates of evolutionary change at 1.14 × 10⁻⁴ and 1.83 ×10⁻⁴ nucleotide substitutions/site/year (Table 1). That the rates and growth curves of each data set were similar also indicated that the demographic model was robust. However, VP1 showed a slightly higher substitution rate than NS1 when analyzed separately. To determine if this difference is significant when the genes are constrained to share the same phylogenetic history, as must be the case for linked loci, we conducted a second analysis on the coding region, this time estimating separate substitution rates for the NS1 and VP1 portions of the alignment (excluding the 8-bp overlap). While VP1 still showed a higher mean rate than NS1 (Table 1), the difference was not significant, as the HPDs overlapped.
TABLE 1.
Nucleotide substitution rates in human B19 erythrovirus
| Data set | Clock | Sequence length (bp) | No. of sequences | Nucleotide substitution rate
|
|
|---|---|---|---|---|---|
| Meana | HPDb | ||||
| VP1 gene | Strict | 2,247 | 38 | 1.14 × 10⁻⁴ | 1.20 × 10⁻⁵, 2.40 × 10⁻⁴ |
| Coding region | Strict | 4,216 | 24 | 1.83 × 10⁻⁴ | 9.04 × 10⁻⁵, 2.72 × 10⁻⁴ |
| NS1 from coding region set | Strict | 1,977 | 24 | 1.90 × 10⁻⁴ | 7.64 × 10⁻⁵, 3.11 × 10⁻⁴ |
| VP1 from coding region set | Strict | 2,247 | 24 | 2.60 × 10⁻⁴ | 1.16 × 10⁻⁴, 3.94 × 10⁻⁴ |
| Coding region with unique gene rates | Strict | 4,216 | 24 | ||
| NS1 | 1.72 × 10⁻⁴ | 8.66 × 10⁻⁵, 2.61 × 10⁻⁴ | |||
| VP1 | 2.07 × 10⁻⁴ | 1.03 × 10⁻⁴, 3.10 × 10⁻⁴ | |||
| Coding region with unique gene rates | Relaxed | 4,216 | 24 | ||
| NS1 | 1.74 × 10⁻⁴c | 7.04 × 10⁻⁵, 2.86 × 10⁻⁴ | |||
| VP1 | 2.04 × 10⁻⁴c | 8.30 × 10⁻⁵, 3.32 × 10⁻⁴ | |||
Mean rate of nucleotide substitutions per site per year.
HPD interval of rate of nucleotide substitutions per site per year.
Mean of the individual rates along each branch.
That a nonstructural gene evolves at a similar rate as a surface capsid gene suggests that immune selection is not the primary cause of the high substitution rate in B19 virus. This was further supported by an analysis of the ratio of nonsynonymous (dN) to synonymous (dS) nucleotide changes per site, estimated using an ML method (program CODEML) (20, 21). Mean dN/dS ratios (estimated with the M0 model) were 0.074 for the large VP1 data set and 0.135 and 0.079 for the NS1 and VP1 genes of the coding region data set, respectively, showing that purifying selection is dominant. Moreover, we found no evidence of positive selection acting on any individual amino acid residue (P > 0.5). Finally, to confirm that our molecular clock models adequately approximate the evolutionary history of this virus, we also employed the “relaxed” clock model available in the BEAST package and observed similar substitution rates (Table 1) and population growth dynamics.
That our inferred substitution rate, ∼1 × 10⁻⁴ substitutions/site/year, is so similar to those estimated for the carnivore parvoviruses suggests high mutation rates may be characteristic of all autonomous parvoviruses, irrespective of their lifestyle. While B19 virus and the carnivore parvoviruses share a genome structure, they exhibit low levels of sequence similarity, infect different hosts, and have unique routes of infection. For the future it will be important to determine whether this elevated rate is restricted to the Parvoviridae or is characteristic of all ssDNA viruses, as suggested by the high levels of diversity found among these viruses, including members of the Geminiviridae and the Circoviridae, most notably human TT virus (6, 9, 11, 12, 15).
It is clear that DNA viruses do not share a common rate of nucleotide substitution, although this does not preclude the existence of a universal rate of mutation per genome per replication (4). As substitution rates are determined by a combination of forces, including the intrinsic frequency of mutation per round of replication, viral generation time, and the extent of natural selection, it will ultimately be necessary to document the contribution of each to the high rates of evolutionary change seen in some DNA viruses. Although cellular proteins are responsible for the replication of all known ssDNA viruses (and indeed all small DNA viruses), it is possible that the required polymerases and/or proofreading proteins do not replicate or repair these unique genomes as accurately or efficiently as they replicate/repair cellular genomes. Consequently, the nature of the viral genome (ssDNA versus dsDNA) and/or the coding capacity—that is, the presence or absence of genes to supplement the host replication and repair machinery and modulate the host immune response—may be partially responsible for different rates of evolutionary change observed in DNA viruses.
Acknowledgments
We thank Andrew Rambaut for assistance with BEAST.
This work was supported by a Howard Hughes Medical Institute Fellowship to L.A.S.
REFERENCES
- 1.Bernard, H. 1994. Coevolution of papillomaviruses with human populations. Trends Microbiol. 2:140-143. [DOI] [PubMed] [Google Scholar]
- 2.Brown, K. E. 2004. Variants of B19. Dev. Biol. 118:71-77. [PubMed] [Google Scholar]
- 3.Cossart, Y. E., B. Cant, A. M. Field, and D. Widdows. 1975. Parvovirus-like particles in human sera. Lancet i:72-73. [DOI] [PubMed] [Google Scholar]
- 4.Drake, J. W. 1991. A constant rate of spontaneous mutation in DNA-based microbes. Proc. Natl. Acad. Sci. USA 88:7160-7164. [DOI] [PMC free article] [PubMed] [Google Scholar]
- 5.Drummond, A. J., A. Rambaut, B. Shapiro, and O. G. Pybus. 2005. Bayesian coalescent inference of past population dynamics from molecular sequences. Mol. Biol. Evol. 22:1185-1192. [DOI] [PubMed] [Google Scholar]
- 6.Khudyakov, Y. E., M. E. Cong, B. Nichols, D. Reed, X. G. Dou, S. O. Viazov, J. Chang, M. W. Fried, I. Williams, W. Bower, S. Lambert, M. Purdy, M. Roggendorf, and H. A. Fields. 2000. Sequence heterogeneity of TT virus and closely related viruses. J. Virol. 74:2990-3000. [DOI] [PMC free article] [PubMed] [Google Scholar]
- 7.McGeoch, D. J., S. Cook, A. Dolan, F. E. Jamieson, and E. A. Telford. 1995. Molecular phylogeny and evolutionary timescale for the family of mammalian herpesviruses. J. Mol. Biol. 247:443-458. [DOI] [PubMed] [Google Scholar]
- 8.Modrow, S., and S. Dorsch. 2002. Antibody responses in parvovirus B19 infected patients. Pathol. Biol. 50:326-331. [DOI] [PubMed] [Google Scholar]
- 9.Muljono, D. H., T. Nishizawa, F. Tsuda, M. Takahashi, and H. Okamoto. 2001. Molecular epidemiology of TT virus (TTV) and characterization of two novel TTV genotypes in Indonesia. Arch. Virol. 146:1249-1266. [DOI] [PubMed] [Google Scholar]
- 10.Muzyczka, N., and K. I. Berns. 2001. Parvoviridae: the viruses and their replication, p. 1089-1121. In D. M. Knipe and P. M. Howley (ed.), Fundamental virology, vol. 4. Lippincott Williams and Wilkins, Philadelphia, Pa. [Google Scholar]
- 11.Ooi, K., S. Ohshita, I. Ishii, and T. Yahara. 1997. Molecular phylogeny of geminivirus infecting wild plants in Japan. J. Plant Res. 110:247-257. [Google Scholar]
- 12.Ritchie, P. A., I. L. Anderson, and D. M. Lambert. 2003. Evidence for specificity of psittacine beak and feather disease viruses among avian hosts. Virology 306:109-115. [DOI] [PubMed] [Google Scholar]
- 13.Rosenfeld, S. J., K. Yoshimoto, S. Kajigaya, S. Anderson, N. S. Young, A. Field, P. Warrener, G. Bansal, and M. S. Collett. 1992. Unique region of the minor capsid protein of human parvovirus B19 is exposed on the virion surface. J. Clin. Investig. 89:2023-2029. [DOI] [PMC free article] [PubMed] [Google Scholar]
- 14.Sakaoka, H., K. Kurita, Y. Iida, S. Takada, K. Umene, Y. T. Kim, C. S. Ren, and A. J. Nahmias. 1994. Quantitative analysis of genomic polymorphism of herpes-simplex virus type-1 strains from 6 countries: studies of molecular evolution and molecular epidemiology of the virus. J. Gen. Virol. 75:513-527. [DOI] [PubMed] [Google Scholar]
- 15.Sanz, A. I., A. Fraile, J. M. Gallego, J. M. Malpica, and F. Garcia-Arenal. 1999. Genetic variability of natural populations of cotton leaf curl geminivirus, a single-stranded DNA virus. J. Mol. Evol. 49:672-681. [DOI] [PubMed] [Google Scholar]
- 16.Sawyer, S. 1989. Statistical tests for detecting gene conversion. Mol. Biol. Evol. 6:526-538. [DOI] [PubMed] [Google Scholar]
- 17.Shackelton, L. A., C. R. Parrish, U. Truyen, and E. C. Holmes. 2005. High rate of viral evolution associated with the emergence of carnivore parvovirus. Proc. Natl. Acad. Sci. USA 102:379-384. [DOI] [PMC free article] [PubMed] [Google Scholar]
- 18.Swofford, D. L. 2003. PAUP*: phylogenetic analysis using parsimony (*and other methods), 4th ed. Sinauer, Sunderland, Mass.
- 19.Takahashi, N., N. Takada, T. Hashimoto, and T. Okamoto. 1999. Genetic heterogeneity of the immunogenic viral capsid protein region of human parvovirus B19 isolates obtained from an outbreak in a pediatric ward. FEBS Lett. 450:289-293. [DOI] [PubMed] [Google Scholar]
- 20.Yang, Z. H. 1997. PAML: a program package for phylogenetic analysis by maximum likelihood. Comput. Appl. Biosci. 13:555-556. [DOI] [PubMed] [Google Scholar]
- 21.Yang, Z. H., R. Nielsen, N. Goldman, and A. M. Pedersen. 2000. Codon-substitution models for heterogeneous selection pressure at amino acid sites. Genetics 155:431-449. [DOI] [PMC free article] [PubMed] [Google Scholar]
- 22.Young, N. S., and K. E. Brown. 2004. Mechanisms of disease: parvovirus B19. N. Engl. J. Med. 350:586-597. [DOI] [PubMed] [Google Scholar]


