

Abstract
Neuronal responses at early stages in visual cortical processing, including those in primary visual cortex (V1), are subject to the influences of visual context, experience and attention. Here we show that for monkeys trained in a shape discrimination task, V1 neurons took on novel functional properties related to the attributes of the trained shapes. Furthermore, these properties depended on the perceptual task being performed; neurons responded very differently to an identical visual stimulus under different visual discrimination tasks. These top-down influences were seen from the very beginning and throughout the entire time course of the neural responses. Information theoretic analysis showed that neurons carried more information about a stimulus attribute when the animals were performing a task related to that attribute. Our findings suggest that the output from V1 reflects both sensory and behavioral context.
Perceptual learning, a form of implicit memory, is an improvement in sensory discrimination after an extended period of practice. In the visual system, training can improve the discriminability of spatial resolution1–4, orientation5,6, direction of motion7, the waveform of sinusoidal stimuli8, texture9 and depth10,11. An increasing body of evidence implicates plasticity of early sensory cortex in perceptual learning. The response properties of neurons, the structure of receptive fields (RFs) and the topographical map of the cortex can be altered by sensory experience (for review, see refs. 12,13). In primary somatosensory and auditory cortex, perceptual learning may lead to ‘cortical recruitment,’ a remapping of the cortical representation of the sensory surface that results in larger representation of the trained area14,15. In primary visual cortex (V1), on the other hand, after extensive training in a visual discrimination task, there is no significant change in the cortical area representing the trained part of visual space, nor in certain simple RF attributes16,17. Training does have profound effects in V1 (ref. 18), however, notably on the contextual influences mediating the selectivity of neurons to complex stimuli16.
Response properties of V1 neurons are dynamic. They can be modified by stimulus context19–29, visual experience16,18 and attentional state16,30–33. The dynamic properties and plasticity of V1 neurons suggest a direct involvement of V1 in analyzing more complex features of the visual environment and in mediating higher-order cognitive influences. Our previous work has shown an interaction in V1 among spatial attention, visual context and perceptual learning16. In the current study, to isolate the contribution of perceptual task, we trained the monkeys to do two different discrimination tasks with the same visual stimulus at the same visual field location. We observed striking task-related effects on response properties of V1 neurons.
RESULTS
Task modulation of contextual influences
Our experimental design allowed a dual dissociation between two perceptual tasks and two RF properties (Fig. 1a). The visual stimuli consisted of five line segments, a central line fixed in the RF center and paralleled side-by-side and end-to-end by four additional flanking lines surrounding the RF. Two monkeys were trained to perform two visual discrimination tasks based on different attributes of the five-line stimuli. In the bisection task, the task-relevant components were the three side-by-side lines. In different trials, the two side flanks were positioned randomly at one of five possible positions. In one position, the three lines were equidistant, and in the other four positions, either flank was placed closer to the central line with varying separation. The task was to determine to which of the two flanks the central line was closer. In the vernier task, the task-relevant components in the five-line stimuli were the three lines placed end-to-end. In different trials, both end flanks were positioned randomly at one of five positions, one collinear with the central line and two positions on either side of the central line with varying displacement. The task was to determine to which side of the flanks the central line was displaced. The animal was cued to the task by color difference, with task-relevant components shown in green and task-irrelevant components shown in white (insets in Fig. 1b,c). During V1 recording sessions, the contrasts of the three task-relevant green lines and the two task-irrelevant white lines were adjusted so that a single green line and a single white line presented in the RF alone elicited the same mean responses. The animal indicated its choice in the task by making a saccade to either of two targets displayed after the five-line stimulus was extinguished. From the psychometric curve (Fig. 1b,c), we were able to determine that the animal was performing the cued task and was not influenced by the positions of the task-irrelevant lines.
Figure 1.
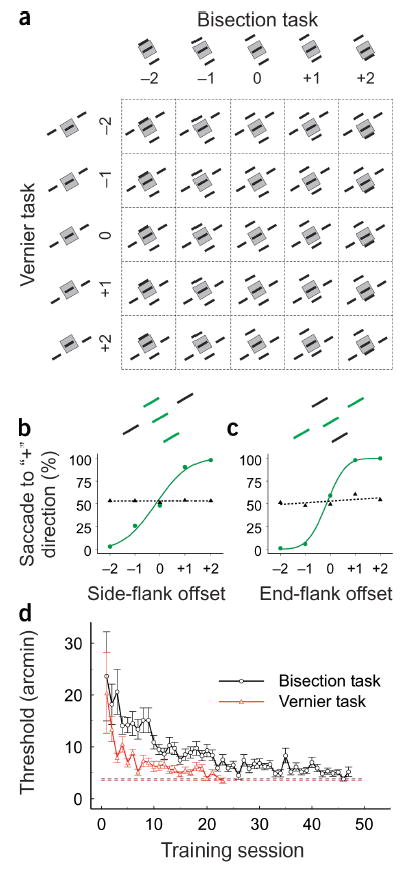
Stimulus and behavior paradigms. (a) The 5 × 5 stimulus array upon which two different discrimination tasks were performed. (b,c) Typical psychometric function (green curve) measured for the bisection (b) and vernier (c) tasks, using the five-line stimuli. The black dashed curve was constructed by assuming that the animal responded to the offsets of the task-irrelevant flanks rather than the task-relevant flanks. Note that the monkey’s behavioral responses were strongly associated with the cued task, but were not affected by the irrelevant stimulus flanks. (d) Learning curves of a monkey in a simplified bisection and vernier task, where either three side-by-side or three end-to-end lines were displayed horizontally at 1.4° eccentricity. Each data point was based on 300 responses. The bottom horizontal lines indicate thresholds measured 3 months after training.
The monkeys were initially trained with simplified displays of three side-by-side lines or three end-to-end lines. After their thresholds for bisection and vernier discrimination reached asymptote (Fig. 1d), the two sets of three-line stimuli were combined to form the five-line array, and the monkey was trained to perform the cued tasks with the presence of both task-relevant and task-irrelevant lines. Further training generalized the task to different orientations. Repeating bisection and vernier tasks at the same spatial location and on the same stimulus patterns allowed a dual dissociation of contextual tuning (response modulation by side flanks versus end flanks) and behavioral task (bisection versus vernier discrimination). This allowed us to explore the effect of the discrimination task independent of stimulus context and of attention to spatial location.
We measured neuronal responses as a function of side-flank position (referred to as ‘side-flank offset tuning’) or end-flank position (‘end-flank offset tuning’). When generating a side-flank offset tuning function, at each position of the side flanks, we pooled and averaged the five conditions with different positions of the end flanks (a column in the 5 × 5 stimulus array, Fig. 1a). Similarly, when generating an end-flank offset tuning function, we pooled the five conditions sharing the same end-flank position but with different side-flank positions (a row in the 5 × 5 stimulus array, Fig. 1a). To determine the modulation of neuronal responses by the offset of stimulus flanks, the central position of the tuning curve was used as a reference, where the central line of the five-line stimulus array was equidistant from the two side flanks in the side-flank offset tuning or was collinear with the two end flanks in the end-flank offset tuning. Any significant deviation of the neuronal response in other offset conditions relative to the zero offset condition provided a measure of the modulation induced by varying the offset of stimulus flanks. The side- or end-flank offset tuning function was compared under both bisection and vernier task conditions where the examined flanks were task-relevant in one condition but not the other.
When the animal performed the bisection task where the side flanks were task-relevant, some cells showed substantial positive modulation by the offset of the side flanks (Fig. 2a). In contrast, when the animal performed the vernier task where the side flanks were task-irrelevant, there was weak negative modulation for the same cells. This task-related effect can be clearly seen in the V-shaped differential tuning curve (Fig. 2e), which provides a measure of the magnitude and shape of the difference between the offset tuning curves for the same contextual influence under the two behavioral conditions.
Figure 2.
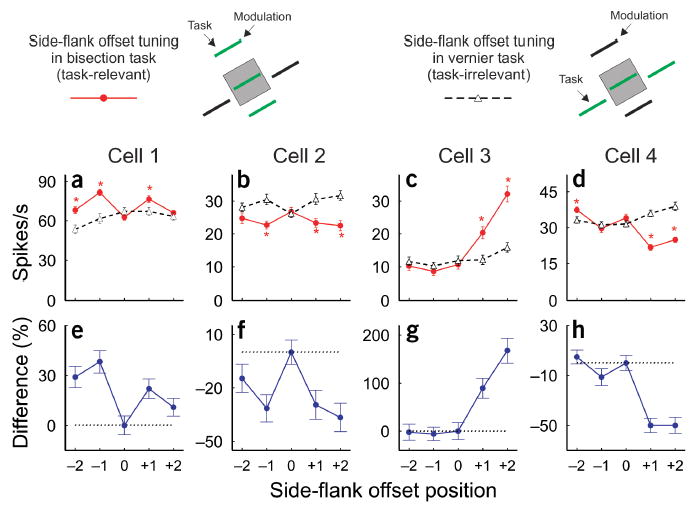
Task modulation of side-flank offset tuning. The top panel shows the stimulus paradigms used in task-relevant and task-irrelevant conditions. (a–d) Side-flank offset tuning curves of four examples of cells when the side flanks were task-relevant (red curves) and task-irrelevant (black dashed curves). Asterisks indicate that the difference in mean responses between the two tasks was significant (t-test, P < 0.05). (e–h) Differential side-flank offset tuning curves of each cell. The ‘differential tuning’ function was constructed by subtracting the normalized curve (with response at 0 offset set to 100%) of the task-irrelevant condition from that of the task-relevant condition. Error bars represent ± s.e.m.
The task-related effect varied from cell to cell. Whereas the neuron in Figure 2a showed positive modulation by lateral offsets of the side flanks in the task-relevant condition, others showed negative modulation (Fig. 2b), and still others showed asymmetric influences, with positive (Fig. 2c) or negative (Fig. 2d) modulation when the offset of side flanks was to one side or the other in the task-relevant condition. When the side flanks were task-irrelevant, the side-flank offset tuning curves were generally flatter, indicating a weaker modulation, than those in task-relevant conditions (Fig. 2a,c,d). Even when the modulation amplitude looked similar under both task conditions, the tuning curve frequently changed shape (Fig. 2b).
Similar task dependency was observed in the end-flank offset tuning function (Fig. 3). For the neurons shown, when the animal performed the vernier task where the end flanks were task-relevant, the shape of the end-flank offset tuning curve differed markedly from the curve obtained when the animal performed the bisection task, where the end flanks were task-irrelevant. The differential end-flank offset tuning curve could be V-shaped (Fig. 3e), caret-shaped (Fig. 3f) or asymmetric (Fig. 3g,h). Furthermore, when the end flanks were task-irrelevant, the end-flank offset tuning curves were generally flatter than those in task-relevant conditions (Fig. 3a,c,d).
Figure 3.
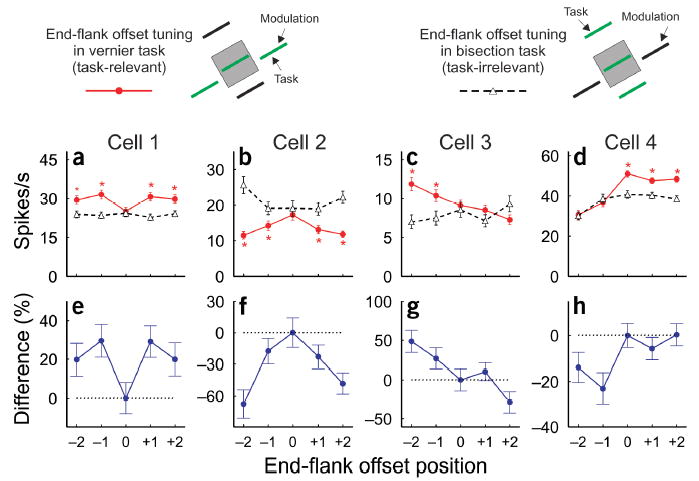
Task modulation of end-flank offset tuning. The top panel shows the stimulus paradigms used in task-relevant and task-irrelevant conditions. (a–d) End-flank offset tuning curves of four examples of cells when the end flanks were task-relevant (red curves) and task-irrelevant (black dashed curves). Asterisks indicate that the difference in mean responses was significant between the two tasks (t-test, P < 0.05). (e–h) Differential end-flank offset tuning curves of each cell (for details, see Fig. 2 legend). Error bars represent ± s.e.m.
No obvious relationship was observed for individual neurons in the task-related effects between the side- and end-flank offset tuning functions. The shape of the offset tuning curves and the differential tuning curves or the strength of the task-related effect could be different for the same cell in the side- and end-flank offset tuning functions.
To quantify the tendency for offset-tuning to be flatter in the task-irrelevant condition (Figs. 2 and 3), we used three measures addressing different aspects of the task-related effects: the modulation index, the asymmetry index and the average ‘mutual information’ between the number of spikes elicited in a trial and the task stimulus presented (see Methods).
The modulation index provides a measure of the magnitude of change of neuronal responses induced by the lateral displacement of the stimulus flanks16. The mean modulation index across the population of cells was higher in the task-relevant than task-irrelevant condition (Fig. 4a). The two clouds in Figure 4a are the modulation indices generated by 1,000 Monte Carlo simulations (see Methods) for side- and end-flank modulation, respectively. Since the mean modulation index was above the diagonal and clearly separated from the simulated clouds of data points, the same stimulus context did produce significantly higher modulation of neuronal responses when they were task-relevant than when they were irrelevant.
Figure 4.
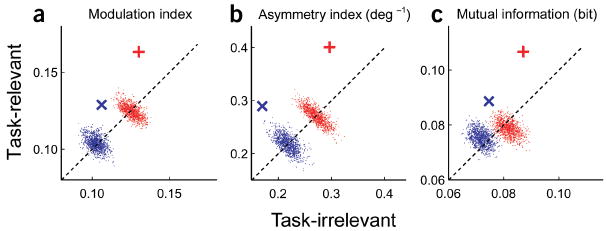
Population analysis of the task-related effect (n = 51). Comparisons between task-relevant and task-irrelevant conditions of (a) mean modulation index, (b) mean asymmetry index and (c) mean mutual information. Red +: side-flank offset tuning. Blue ×: end-flank offset tuning. The red and blue clouds of dots are Monte Carlo simulations of data for side- and end-flank modulation, respectively.
As the discrimination tasks required the animal to identify the direction of an offset, cells showing asymmetric task-related effects (Fig. 2c,d and Fig. 3c,d) should be more useful for solving the task than those showing symmetrical modulation. This property was quantified by an asymmetry index (see Methods). As with the modulation index, the asymmetry index was significantly higher in the task-relevant than task-irrelevant condition for both side- and end-flank modulation (Fig. 4b).
A third measure of the difference in tuning under the task-relevant and task-irrelevant conditions as well as the utility of the changes in performing the task was that of mutual information. Information theory34 provides a rigorous measure of the changes in offset tuning functions between task-relevant and irrelevant conditions, and also tells us to what extent an ideal observer could categorize the stimulus from knowing the spike count of one cell during one trial. The corresponding measure is the average mutual information between the response of a cell in a trial and the task stimulus eliciting it.
For both side- and end-flank modulation, the mutual information was significantly higher in the task-relevant than task-irrelevant condition (Fig. 4c). This analysis indicates that the offset-tuning function in the task-relevant condition was not only significantly different from the task-irrelevant condition, but also could have been useful to the animal in performing the discrimination task.
One should be aware that, when examining the side-flank (or end-flank) modulation, stimulus conditions sharing the same side-flank (or end-flank) position but different end-flank (or side-flank) positions were pooled (Fig. 1a). This would have the effect of decreasing the mutual information due to an increase of the variability of neuronal responses induced by position shifts of the flanks not relevant to the analysis, and thus the values shown in Figure 4c are only conservative estimates.
Effects of spatial attention
In the experiments described so far, the animal did the discrimination tasks by attending to the five-line stimulus at the RF location (Fig. 5a, 1 and 3). To explore the influence of the locus of spatial attention on contextual tuning, we introduced two ‘attending-away’ conditions (Fig. 5a, 2 and 4). In the attending-away conditions, the animal did the bisection or vernier task in the hemifield contralateral to the RF, while the five-line stimulus array was still presented at the RF location as a test stimulus. Because of the number of stimulus conditions in this experiment (4 behavioral conditions × 25 stimulus patterns), we were able to complete this set on a small proportion of recorded single units.
Figure 5.
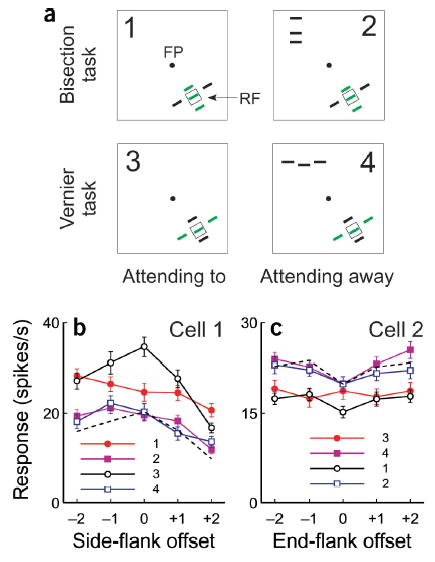
Effects of spatial attention. (a) The cartoons illustrate the stimulus paradigms: 1, bisection task at the RF location; 2, bisection task in hemifield opposite to the RF of the recorded neuron; 3, vernier task at the RF location; 4, vernier task in the hemifield opposite to the RF. (b) Side-flank offset tuning curves from a cell under the four test conditions. Each curve is numbered by the test condition shown in a. The dashed black curve represents curve 3 scaled to the level of curves 2 and 4. (c) End-flank offset tuning curves from another cell. The dashed black curve represents curve 1 scaled to the level of curves 2 and 4. Error bars represent ± s.e.m.
The side-flank offset tuning functions under the four behavioral conditions are shown for a V1 neuron in Figure 5b. In the attending-to conditions, consistent with Figure 2, the task-relevant tuning curve was very different from the task-irrelevant one. By contrast, the two curves in the attending-away conditions were very similar to each other, and both were substantially below the two curves made from the attending-to conditions. When the monkey did the vernier task at the RF location (where the side flanks were task-irrelevant), although the side-flank offset tuning curve was substantially above the two curves from the attending-away conditions, their shapes were similar to each other when scaled to the same level. These curves were very different, on the other hand, from the trials when the animal performed the bisection task at the RF location (where the side flanks were task-relevant). For this neuron, therefore, attending to the RF location by itself generally increased neuronal responses relative to the attending-away condition. At the higher response levels seen under the attending-to condition, performing the bisection task led to a further differential modulation of the side-flank offset tuning function relative to when the animal performed the vernier task.
Attending to the RF location did not always facilitate responses, as seen earlier30,31. For some cells, we observed a general suppression in the attending-to condition (Fig. 5c), where the two end-flank offset tuning curves in the attending-away conditions were elevated substantially above the two curves in the attending-to conditions. The two curves in the attending-away conditions and the curve in the attending-to but task-irrelevant condition had similar shapes, as seen by rescaling, but all differed from the curve in the task-relevant condition.
The color change used to cue the task in the five-line stimulus did not interfere with the observation of a task-related effect (Fig. 5) because the tuning curves in the two attending-away conditions were very close to each other despite the color difference in the five-line stimuli. Although the color change by itself in the absence of attention was insufficient to cause the differential effect that we observed, one might argue that an interaction between the color of the stimulus and attending to color could produce such a difference. To address this issue, we conducted a control experiment in which the monkey performed a simple three-line bisection task at the RF location. Here the two end flanks in the five-line stimuli were removed and only the three side-by-side lines were shown (Fig. 6b insets). While the color of the central line was kept green, the two side flanks were either green or white, as in the other experiments with five-line stimuli. For two representative cells (Fig. 6a) the shapes of the offset tuning curves were almost identical regardless of the color difference of the stimulus flanks. The averaged mutual information across the population (Fig. 6b) lay on the diagonal and within the cloud of Monte Carlo simulations, indicating no significant difference in mutual information between the two test conditions, where the task was the same three-line bisection discrimination, but the colors of the stimulus flanks were different. Here, because no pooling over end-flank positions was required, there was lower variability of neuronal responses at each side-flank position and thus higher mutual information than that seen in the experiments involving a five-line stimulus configuration.
Figure 6.
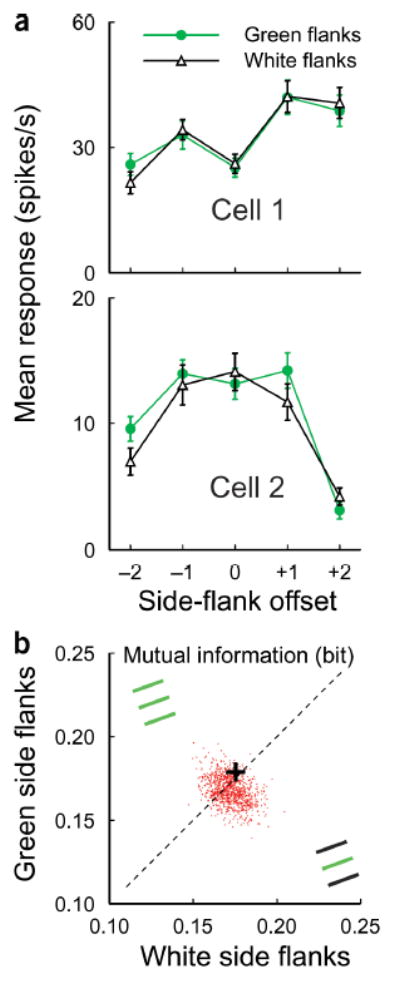
The color change had no significant effect on flank offset tuning function. (a) Two examples of cells recorded while the animal did the bisection task at the RF location with a central green and two flanking white lines (black curve) and with three green lines (green curve). (b) Comparison of the mean mutual information across the population of cells (n = 24) between two test conditions (as illustrated in insets). +: the mean value; red dots: Monte Carlo simulations.
Timing of the task-dependent effects
One indication of the locus of interaction between the top-down influence of behavioral context and the lateral influences of sensory context can be obtained from the timing of the top-down influence relative to stimulus onset. To address whether the differential effect of task operated differently over the time course of neuronal responses, we compared the post-stimulus time histograms (PSTHs) of neuronal responses between the conditions when the stimulus flanks were task-relevant and task-irrelevant. The difference started at the beginning and lasted through the full time course of the neuronal responses (Fig. 7).
Figure 7.
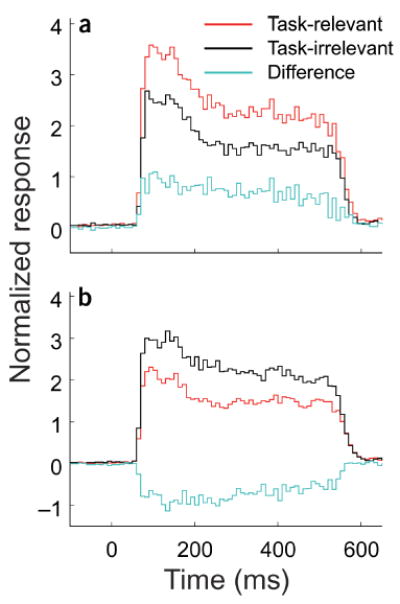
Population analysis of the timing of task-related effect. Normalized and averaged PSTHs showing the time course of positive (a) and negative (b) differential effects. Time 0 represents stimulus onset. Time bin is 10 ms. Data from side- and end-flank offset tuning were pooled in this analysis. The original PSTHs corresponding to each data point on the offset tuning curve were normalized so that the area under the PSTH at zero offset was set to 100%. For the population analysis, we selected for each cell the pairs of normalized PSTHs in task-relevant and task-irrelevant conditions that gave significantly different mean responses (t-test, P < 0.01). At a given offset position of stimulus flanks the differential effects could be positive or negative (see Figs. 2 and 3 for examples), so the selected pairs of PSTHs across the population were separately pooled and averaged for the positive (a) and negative (b) cases, respectively. For both positive and negative differential effects, the difference started at the beginning and lasted through the full time course of the neuronal responses.
DISCUSSION
We have previously shown that in monkey area V1, performing a bisection task near the RF in the trained visual field changes contextual influences with respect to a simple fixation task16. In the present study, centering the task stimulus directly on the RF enabled us to disambiguate the influence of spatial attention per se (attending to or away from the RF location) from the influence of the perceptual task. As with our earlier work on top-down effects16,33, the task-related effect operated most powerfully on contextual influences. In the attending-away conditions, however, the task-related effect was absent (Fig. 5). These results suggest that the modulation of response properties of V1 neurons by perceptual task is neither global, because it was not seen when the animal performed the task in the opposite hemifield several degrees away from the RF, nor completely local, because it is seen when the task is done near the RF16.
The diversity of profiles of differential tuning curves is reminiscent of the diversity of disparity-tuned cells in visual cortex. Disparity-tuned neurons in the striate and prestriate cortex have disparity tuning curves whose shapes provide the information necessary for making fine-tuned depth judgments, including tuned-excitatory (caret-shaped), tuned-inhibitory (V-shaped) and near and far (asymmetric)35. The differential effects of task on offset tuning properties in V1 had profiles that recall those seen for disparity tuning. We propose that these neurons may collectively encode not only the absolute spatial displacement information but also the sign (direction) of the offset relative to the RF, which is a requirement for performing the discrimination tasks. This is reinforced by the increase in the asymmetry index for the task-relevant conditions (Fig. 4b).
The finding that the task-relevant context produced tuning curves with greater modulation than the task-irrelevant context provides a possible neural basis for the discrimination involved in the trained tasks. In one sense, this observation is consistent with the ‘competition model’ of selective attention (for review, see refs. 36–38). However, the task-related modulation did not simply change the gain of the cell, but instead changed the shape of the contextual tuning curves. This differs from the multiplicative effects of space- or feature-based attention39,40. One might still consider this to be an example of object-oriented attention32, where the ‘object’ is either the three side-by-side lines or the three end-to-end lines. Whether or not one wants to include these task-dependent effects under the rubric of attention, the observation that the tuning properties of neurons were so markedly changed suggests that these neurons were altering their function to fit the requirements of the immediate perceptual task, and in essence changing their ‘line-label’ according to top-down signals. The broader implication is that, within certain limits, V1 acts as an adaptive processing unit, executing different algorithms according to the behavioral context. This idea is supported by the observation that neurons carried more information about a stimulus attribute when the animal performed a task related to that attribute (Fig. 4c). A further implication is that the improvement in perceptual discriminability with training (Fig. 1d) might be also associated with an increase in the mutual information between V1 neuronal responses and the task stimuli.
That the differential effects of task began from the outset of the neural responses suggests that the interaction between context and task was unlikely to occur in higher areas and subsequently to be fed back to V1, but rather occurred within V1. In our experimental paradigm, the top-down influence was likely to begin before stimulus presentation because a block design with some leading cuing trials was used. The top-down signal enables V1 neurons to multiplex visual signals for different perceptual tasks. Between the alternative possibilities of multiplexing (all cells participate in all perceptual tasks) and compartmentalization (cells become specialized in one task or another), our evidence suggests the former, with the same cells capable of coding information about vernier or bisection depending on the discrimination task. In fact, among the neurons responding to the orientation of the lines in the stimulus array, roughly half showed significant changes in their tuning according to the current task. The small increase in mutual information in the task-relevant condition relative to the irrelevant condition (Fig. 4c) implies that a large number of cells may be required to obtain enough information to reliably solve the task. A rough estimation of the number of cells needed by an ideal observer on average to distinguish among the five different offset positions in stimuli is made as follows. The five offset positions are equivalent to log25 = 2.32 bit in the binary system in which mutual information is usually quantified. Let us assume that the spike counts of different cells are statistically independent, that is, the mutual information contributed by each cell is linearly additive, and that the difference between task-relevant and irrelevant conditions is used in the bisection or vernier discrimination task. For an average increase of 0.02 bit in mutual information in side-flank modulation and 0.014 bit in end-flank modulation (Fig. 4c), a total of 116 neurons for the bisection task and 166 for the vernier task would acquire the necessary 2.32 bit for reliable performance in the task for an ideal observer. This estimate is an upper bound for several reasons. As pointed out in Figure 4c, our estimation of the mutual information is conservative as a result of pooling conditions. Moreover, even in the task-irrelevant condition, the mutual information in neuronal responses was not zero.
Our findings provide further evidence for the involvement of early visual cortical areas in representing learned information. V1 might be involved in this learning because of the high-resolution requirements of the task (a few arc minutes of visual angle). V1 has been shown to become involved in learned search tasks, whereby the learned shapes have to be identified rapidly and in parallel within numerous distractors, requiring representation in retinotopically mapped areas41 (also Sigman, M. and C.D.G., unpublished data). Here, we found that the RF properties related to a task were present only when the animal was executing the learned task. This would indicate that the information related to a given shape would be represented at the level of subsets of inputs to a cell, and that multiple learned shapes can be represented by the same cells, greatly expanding the information carrying capacity of V1.
METHODS
Stimulus and behavior protocols
Visual stimuli were generated by a VSG2/5 stimulus generator (Cambridge Research Systems) and consisted of oriented anti-aliased 0.5 × 0.08° light bars. The background was gray of 6.5 cd/m2. Bar contrast ranged between 15% and 60%. In the five-line stimulus array (Fig. 1a), the central line was fixed in the RF center and the flanks were placed near the edge of the RF. In different trials, the stimulus flanks were laterally displaced in varying steps with step size of 0.1° or 0.15°. All lines were oriented at the preferred orientation of the recorded neuron.
In stimulus presentation, all stimuli in the same task were randomized within a block of trials, and different tasks were arranged in different blocks and were preceded by a couple of cuing trials with only task-relevant lines shown. Each stimulus was repeated 8–20 times in different trials. At trial outset, a 0.08° fixation point (FP) was displayed in the center of the screen. Eye positions were sampled at 30 Hz by an infrared tracking system (Matsuda, K. et al., Soc. Neurosci. Abstr. 26, 744.2, 2000). Within 600 ms after FP presentation, the animal was required to fixate within an invisible circular window of 0.4–0.5° in radius around the FP. After the animal maintained fixation for 191 ms (20 CRT frames at 105 Hz), the stimulus was presented for 476 ms. Another 191 ms later, the FP was extinguished and two 0.15° saccade targets were presented for 600 ms symmetrically around the screen center on an axis orthogonal to the orientation of stimulus lines. The animal indicated its choice by a saccade toward either target.
Animal preparation and electrophysiological recordings
Two adult monkeys (Macaca mulatta) were trained to perform the discrimination tasks (Fig. 1, see ref. 16 for details). Single units were recorded by a spike sorting and acquisition system (Plexon Inc.) with glass-coated platinum-iridium microelectrodes (FHC, impedance 1–3 MΩ at 1 KHz). All recordings were made from the opercular surface of the striate cortex with eccentricities between 1.8 and 3.5° and RF sizes between 0.5 and 1.5°, and were restricted to the superficial layers. Recording tracks were skipped where cells were weakly orientation-selective or strongly color-selective. All procedures were conducted in compliance with the National Institutes of Health Guide for the Care and Use of Laboratory Animals and under approval of the Institutional Animal Care and Use Committee at Rockefeller University.
Data analysis
The thresholds for bisection and vernier discrimination were determined by the method of probits42, with thresholds defined as the half-distance between the 75% and 25% points on the psychometric curve (Fig. 1b,c).
The responses of individual cells were analyzed by comparing tuning curves, while the behavior of the population was characterized by comparing the averages of three measures for the task-relevant and task-irrelevant condition: the modulation index, the asymmetry index and the mutual information between neuronal responses and the stimuli. The modulation index is the difference between the highest and lowest point of the tuning curve divided by their sum. The asymmetry index is the absolute value of the average slope on the tuning curve divided by the mean firing rate. The mutual information34 (I(R;S)) was calculated with the probabilities of presenting a stimulus p(sj), the probabilities of observing a particular number of spikes in the response p(ri) and the conditional probabilities of observing a particular number of spikes in the response for a given stimulus p(ri|sj):
To calculate the probabilities p(ri) and p(ri|sj), the spike count was binned at the standard deviation of the response to all stimulus conditions for a given task and cell, rounded to the next integer. While changing the bin size from 30 to 300% of the standard deviation also changed the mutual information, it had little effect on the difference between task-relevant and task-irrelevant conditions because both had very similar limited sampling biases and regularization losses from binning43.
After the neuronal response latency (50–70 ms after stimulus onset), a 400 ms window was used for the spike count. The population analysis used 51 of the 66 recorded cells with at least 8 trials per stimulus pattern and thus 40 trials when pooled over the positions irrelevant to the performed analysis.
The Monte Carlo simulation represents the null hypothesis that the difference in the population measures between two experimental conditions (e.g., the mean modulation index between task-relevant and task-irrelevant conditions, Fig. 4a) resulted from random fluctuation of neuronal responses rather than the difference in experimental conditions. In the simulation, for each stimulus pattern and for each cell, individual trials were randomly assigned to either of the two compared conditions, resulting in a binomial distribution of trials from each condition.
Acknowledgments
This work was supported by US National Institutes of Health grant EY07968. We are grateful to K. Matsuda for generously sharing the eye tracking software and G. Reeke for valuable comments on the data analysis with information theory. We also thank J. Jones, K. Hazleton and N. Lingenhol for technical assistance.
Footnotes
COMPETING INTERESTS STATEMENT
The authors declare that they have no competing financial interests.
References
- 1.McKee SP, Westheimer G. Improvement in vernier acuity with practice. Percept Psychophys. 1978;24:258–262. doi: 10.3758/bf03206097. [DOI] [PubMed] [Google Scholar]
- 2.Poggio T, Fahle M, Edelman S. Fast perceptual learning in visual hyperacuity. Science. 1992;256:1018–1021. doi: 10.1126/science.1589770. [DOI] [PubMed] [Google Scholar]
- 3.Saarinen J, Levi DM. Perceptual learning in vernier acuity: what is learned? Vision Res. 1995;35:519–527. doi: 10.1016/0042-6989(94)00141-8. [DOI] [PubMed] [Google Scholar]
- 4.Crist RE, Kapadia MK, Westheimer G, Gilbert CD. Perceptual learning of spatial localization: specificity for orientation, position, and context. J Neurophysiol. 1997;78:2889–2894. doi: 10.1152/jn.1997.78.6.2889. [DOI] [PubMed] [Google Scholar]
- 5.Vogels R, Orban GA. The effect of practice on the oblique effect in line orientation judgments. Vision Res. 1985;25:1679–1687. doi: 10.1016/0042-6989(85)90140-3. [DOI] [PubMed] [Google Scholar]
- 6.Shiu LP, Pashler H. Improvement in line orientation discrimination is retinally local but dependent on cognitive set. Percept Psychophys. 1992;52:582–588. doi: 10.3758/bf03206720. [DOI] [PubMed] [Google Scholar]
- 7.Ball K, Sekuler R. A specific and enduring improvement in visual motion discrimination. Science. 1982;218:697–698. doi: 10.1126/science.7134968. [DOI] [PubMed] [Google Scholar]
- 8.Fiorentini A, Berardi N. Perceptual learning specific for orientation and spatial frequency. Nature. 1980;287:43–44. doi: 10.1038/287043a0. [DOI] [PubMed] [Google Scholar]
- 9.Karni A, Sagi D. Where practice makes perfect in texture discrimination: evidence for primary visual cortex plasticity. Proc Natl Acad Sci USA. 1991;88:4966–4970. doi: 10.1073/pnas.88.11.4966. [DOI] [PMC free article] [PubMed] [Google Scholar]
- 10.Ramachandran VS, Braddick O. Orientation-specific learning in stereopsis. Perception. 1973;2:371–376. doi: 10.1068/p020371. [DOI] [PubMed] [Google Scholar]
- 11.Fendick M, Westheimer G. Effects of practice and the separation of test targets on foveal and peripheral stereoacuity. Vision Res. 1983;23:145–150. doi: 10.1016/0042-6989(83)90137-2. [DOI] [PubMed] [Google Scholar]
- 12.Gilbert CD. Adult cortical dynamics. Physiol Rev. 1998;78:467–485. doi: 10.1152/physrev.1998.78.2.467. [DOI] [PubMed] [Google Scholar]
- 13.Weinberger NM, Bakin JS. Learning-induced physiological memory in adult primary auditory cortex: receptive fields plasticity, model, and mechanisms. Audiol Neuro-Otol. 1998;3:145–167. doi: 10.1159/000013787. [DOI] [PubMed] [Google Scholar]
- 14.Recanzone GH, Merzenich MM, Jenkins WM, Grajski KA, Dinse HR. Topographic reorganization of the hand representation in cortical area 3b owl monkeys trained in a frequency-discrimination task. J Neurophysiol. 1992;67:1031–1056. doi: 10.1152/jn.1992.67.5.1031. [DOI] [PubMed] [Google Scholar]
- 15.Recanzone GH, Schreiner CE, Merzenich MM. Plasticity in the frequency representation of primary auditory cortex following discrimination training in adult owl monkeys. J Neurosci. 1993;13:87–103. doi: 10.1523/JNEUROSCI.13-01-00087.1993. [DOI] [PMC free article] [PubMed] [Google Scholar]
- 16.Crist RE, Li W, Gilbert CD. Learning to see: experience and attention in primary visual cortex. Nat Neurosci. 2001;4:519–525. doi: 10.1038/87470. [DOI] [PubMed] [Google Scholar]
- 17.Ghose GM, Yang T, Maunsell JH. Physiological correlates of perceptual learning in monkey V1 and V2. J Neurophysiol. 2002;87:1867–1888. doi: 10.1152/jn.00690.2001. [DOI] [PubMed] [Google Scholar]
- 18.Schoups A, Vogels R, Qian N, Orban G. Practising orientation identification improves orientation coding in V1 neurons. Nature. 2001;412:549–553. doi: 10.1038/35087601. [DOI] [PubMed] [Google Scholar]
- 19.Blakemore C, Tobin EA. Lateral inhibition between orientation detectors in the cat’s visual cortex. Exp Brain Res. 1972;15:439–440. doi: 10.1007/BF00234129. [DOI] [PubMed] [Google Scholar]
- 20.DeAngelis GC, Freeman RD, Ohzawa I. Length and width tuning of neurons in the cat’s primary visual cortex. J Neurophysiol. 1994;71:347–374. doi: 10.1152/jn.1994.71.1.347. [DOI] [PubMed] [Google Scholar]
- 21.Gilbert CD, Wiesel TN. The influence of contextual stimuli on the orientation selectivity of cells in primary visual cortex of the cat. Vision Res. 1990;30:1689–1701. doi: 10.1016/0042-6989(90)90153-c. [DOI] [PubMed] [Google Scholar]
- 22.Kapadia MK, Ito M, Gilbert CD, Westheimer G. Improvement in visual sensitivity by changes in local context: parallel studies in human observers and in V1 of alert monkeys. Neuron. 1995;15:843–856. doi: 10.1016/0896-6273(95)90175-2. [DOI] [PubMed] [Google Scholar]
- 23.Knierim JJ, Van Essen DC. Neuronal responses to static texture patterns in area V1 of the alert macaque monkey. J Neurophysiol. 1992;67:961–980. doi: 10.1152/jn.1992.67.4.961. [DOI] [PubMed] [Google Scholar]
- 24.Lamme VA. The neurophysiology of figure-ground segregation in primary visual cortex. J Neurosci. 1995;15:1605–1615. doi: 10.1523/JNEUROSCI.15-02-01605.1995. [DOI] [PMC free article] [PubMed] [Google Scholar]
- 25.Li CY, Li W. Extensive integration field beyond the classical receptive field of cat’s striate cortical neurons—classification and tuning properties. Vision Res. 1994;34:2337–2355. doi: 10.1016/0042-6989(94)90280-1. [DOI] [PubMed] [Google Scholar]
- 26.Li W, Thier P, Wehrhahn C. Contextual influence on orientation discrimination of humans and responses of neurons in V1 of alert monkeys. J Neurophysiol. 2000;83:941–954. doi: 10.1152/jn.2000.83.2.941. [DOI] [PubMed] [Google Scholar]
- 27.Maffei L, Fiorentini A. The unresponsive regions of visual cortical receptive fields. Vision Res. 1976;16:1131–1139. doi: 10.1016/0042-6989(76)90253-4. [DOI] [PubMed] [Google Scholar]
- 28.Nelson JI, Frost BJ. Orientation-selective inhibition from beyond the classic visual receptive field. Brain Res. 1978;139:359–365. doi: 10.1016/0006-8993(78)90937-x. [DOI] [PubMed] [Google Scholar]
- 29.Rossi AF, Rittenhouse CD, Paradiso MA. The representation of brightness in primary visual cortex. Science. 1996;273:1104–1107. doi: 10.1126/science.273.5278.1104. [DOI] [PubMed] [Google Scholar]
- 30.Haenny PE, Schiller PH. State dependent activity in monkey visual cortex. I Single cell activity in V1 and V4 on visual tasks. Exp Brain Res. 1988;69:225–244. doi: 10.1007/BF00247569. [DOI] [PubMed] [Google Scholar]
- 31.Motter BC. Focal attention produces spatially selective processing in visual cortical areas V1, V2, and V4 in the presence of competing stimuli. J Neurophysiol. 1993;70:909–919. doi: 10.1152/jn.1993.70.3.909. [DOI] [PubMed] [Google Scholar]
- 32.Roelfsema PR, Lamme VA, Spekreijse H. Object-based attention in the primary visual cortex of the macaque monkey. Nature. 1998;395:376–381. doi: 10.1038/26475. [DOI] [PubMed] [Google Scholar]
- 33.Ito M, Gilbert CD. Attention modulates contextual influences in the primary visual cortex of alert monkeys. Neuron. 1999;22:593–604. doi: 10.1016/s0896-6273(00)80713-8. [DOI] [PubMed] [Google Scholar]
- 34.Shannon CE. A mathematical theory of communication. Bell Syst Tech J. 1948;27:379–423. [Google Scholar]
- 35.Poggio GF. Mechanisms of stereopsis in monkey visual cortex. Cereb Cortex. 1995;5:193–204. doi: 10.1093/cercor/5.3.193. [DOI] [PubMed] [Google Scholar]
- 36.Desimone R, Duncan J. Neural mechanisms of selective visual attention. Annu Rev Neurosci. 1995;18:193–222. doi: 10.1146/annurev.ne.18.030195.001205. [DOI] [PubMed] [Google Scholar]
- 37.Kastner S, Ungerleider LG. Mechanisms of visual attention in the human cortex. Annu Rev Neurosci. 2000;23:315–341. doi: 10.1146/annurev.neuro.23.1.315. [DOI] [PubMed] [Google Scholar]
- 38.Treue S. Neural correlates of attention in primate visual cortex. Trends Neurosci. 2001;24 :295–300. doi: 10.1016/s0166-2236(00)01814-2. [DOI] [PubMed] [Google Scholar]
- 39.McAdams CJ, Maunsell JH. Effects of attention on orientation-tuning functions of single neurons in macaque cortical area V4. J Neurosci. 1999;19:431–441. doi: 10.1523/JNEUROSCI.19-01-00431.1999. [DOI] [PMC free article] [PubMed] [Google Scholar]
- 40.Treue S, Martinez TJ. Feature-based attention influences motion processing gain in macaque visual cortex. Nature. 1999;399:575–579. doi: 10.1038/21176. [DOI] [PubMed] [Google Scholar]
- 41.Sigman M, Gilbert CD. Learning to find a shape. Nat Neurosci. 2000;3:264–269. doi: 10.1038/72979. [DOI] [PubMed] [Google Scholar]
- 42.Finney, D.J. Probit Analysis: A Statistical Treatment of the Sigmoid Response Curve (Cambridge University Press, Cambridge, 1952).
- 43.Panzeri S, Treves A. Analytical estimates of limited sampling biases in different information measures. Comput Neural Syst. 1996;7:87–107. doi: 10.1080/0954898X.1996.11978656. [DOI] [PubMed] [Google Scholar]