

Summary
Objective
To test the validity of the hypothesis that active vasodilatation and vasoconstriction underlie the occurrence of intracranial pressure (ICP) plateau waves by evaluating corresponding changes of cerebrovascular pressure transmission of arterial blood pressure (ABP) to ICP.
Methods
Digitized recordings of ICP and ABP sampled at 30 Hz were obtained from nine patients with traumatic brain injury. For each 16.5 s recording interval mean values of ICP, ABP, cerebral perfusion pressure (CPP), and the corresponding highest modal frequency (HMF) of cerebrovascular pressure transmission were calculated.
Results
Mean ICP and HMF significantly increased (P < 0.003) and mean CPP decreased significantly (P < 0.00036) at onset of the wave. Conversely at termination, mean ICP and HMF significantly decreased (P < 0.026) and mean CPP significantly increased (P < 0.028). In addition, the strong negative correlations between mean ICP and mean CPP (r = −0.87) and mean HMF and CPP (r = −0.87) were demonstrated.
Conclusion
The findings that HMF increased at onset and decreased at the termination of plateau wave support the validity of the vasodilatatory/constriction cascade model that postulates active vasodilation at the onset and active vasoconstriction of the cerebrovascular bed at the termination of a plateau wave.
Keywords: Plateau waves, vasodilation, vasoconstriction, cerebrovascular pressure transmission, highest modal frequency
Introduction
Plateau waves consist of a sudden rapid elevation of intracranial pressure (ICP) to 50–100 mmHg for 5 to 20 min [2, 5, 8]. After a sustained period of elevation, termination of the wave is characterized by a rapid decrease of ICP. Changes of cerebral blood volume are thought to produce corresponding changes of ICP [6]. The onset of the wave has been described by the vasodilatory cascade model, a closed loop unstable process linking active vasodilation, increased cerebral blood volume (CBV), elevated ICP and decreased cerebral perfusion pressure (CPP) [7, 8]. The relatively rapid termination of the wave has been described by a vaso-constriction cascade model in which active vaso-constrictive events lead to decreases in CBV and ICP and an increase of CPP [7, 8].
Since the vasodilatory/constriction cascade model postulates intact pressure regulation prior to onset of the plateau wave [7, 8], we surmised that during the period before the wave the critical vibration frequencies of cerebrovascular pressure transmission should be dampened. For this state of cerebrovascular tone the highest modal frequency (HMF), the highest vibration mode by which energy is transferred from ABP to ICP, will be low. However, at the onset of the wave, active vasodilation will reduce vascular tone of the cerebrovascular bed resulting in an increase of both the ability of the cerebrovascular bed to vibrate and of the HMF. For termination of the wave, the vasodilatory/constriction cascade model describes a reduction in CBV due to active vasoconstriction as the basis for the reduction of ICP. Thus, tone of the cerebrovascular bed will increase resulting in a reduction of the HMF. The purpose of this study was to test the validity of the postulated descriptive changes of the cerebrovascular bed of the vasodilatory/vasoconstriction cascade model by the evaluation of changes of the HMF of cerebrovascular pressure transmission at the onset and termination of a plateau wave.
Materials and methods
Patients
Measurement of ICP and ABP is a standard monitoring routine in the management of severely head injured patients in Addenbrooke’s Hospital, Cambridge, United Kingdom. Computer recording of the data did not influence clinical decision; the data were processed anonymously. Local Ethical Committee was informed but individual permissions were not required at the time of recording. The Institutional Review Board at The University of Memphis approved the data analysis protocol.
Pressure recording analysis
Monitoring included invasive ABP from the radial or dorsalis pedis artery. ICP was monitored using an intraparenchymal probe (Camino ICP transducer or Codman ICP MicroSensors). ICP and ABP recordings sampled at 30 Hz and CPP was calculated as the difference between mean ABP and mean ICP. The length of the pressure recordings obtained from each patient varied from 16.2 min to 117 min. To reconstruct the sampled recordings to a more accurate description of the actual pressure recordings, a moving average filter was applied to every 3 sample values of the sampled recordings.
Numerical methods
Because the pressure recordings are analyzed over a brief period of 16.5 s during relatively steady-state conditions, our method of analysis assumes that cerebrovascular pressure transmission can be described by a linear time invariant process. Selection of the appropriate model equation is essential for constructing a valid identification model [4]. We chose a cerebrovascular pressure transmission equation based on a mathematical model that has been successfully used to interpret bedside tests of cerebrovascular autoreguation [1] and is of the form:
| (1) |
Specifically, in the above equation, Y(nT) and U(nT) represent ICP and ABP, respectively, and T represents the sampling epoch of 33 ms. For each 500 paired samples of pressure values representing 16.5 s segments, the autoregressive moving average (ARMAX) numerical technique was applied using MATLAB System Identification Toolbox software (Mathworks, Inc., Natick, MA) to obtain the minimum least square error set of constants a0, a1, a2 and b1, b2, b3 for equation #1 above. These constants are used to derive the equivalent continuous-time differential equation description of cerebrovascular pressure transmission of the form:
| (2) |
The eigenvalues of this differential equation are the modal radian frequencies of the cerebrovascular pressure transmission and are the roots of the polynomial equation:
| (3) |
The highest modal radian frequency is defined as the eigenvalue with the greatest absolute value and is converted to modal frequency by division by 2*pi.
The ABP recording obtained from either the radial artery or dorsalis pedis artery does not have the same time relationship to the ICP recording as does an ABP recording obtained from one of the major arteries entering the intracranial subarachnoid space. To account for the time difference between recordings, the computation is done on 10 paired recordings. These paired recordings are obtained by shifting the start of the 16.5 s ICP recording in steps of 33 ms over a range of ± 165 ms relative to the same 16.5 s ABP recording. As a result, 10 sets of constants each derived by the ARMAX technique were determined and the best fit set which produced minimum least square error was selected to describe the cerebrovascular pressure transmission between ABP and ICP and the corresponding value of HMF.
Results
The initial numerical step in implementation of an identification technique is to remove the mean value from each data set [8]. As a result, computation of HMF is based solely on the variation of ICP with respect to ABP. Examples of the ICP and ABP recordings with the mean removed and the corresponding simulated ICP waveform computed by the autoregressive moving average technique described above are given in Fig. 1. An example of ICP and ABP recordings containing a plateau wave along with serial mean values of ICP, ABP, and CPP with each corresponding value of HMF is given in Fig. 2. Serial values of HMF demonstrate a sudden significant increase (P < 0.001, n = 20) from a mean baseline value of 2.42 (±0.12) Hz before the plateau wave to a mean value of 3.97 (±0.50) Hz during the plateau wave. After more than 5 min with CPP below 50 mmHg, termination of the wave occurs.
Fig. 1.

Arterial blood pressure and intracranial pressure recordings with corresponding simulated ICP generated by system identification techniques. a) Arterial Blood Pressure Recording. Moving average filtering was applied to every three samples of the digitized recording at a rate of 30 Hz to obtain a continuous approximation of the original recording. To apply autoregressive identification technique the mean value of the recording was removed. b) Intracranial Pressure Recording. As described for sampled ABP recording, moving average filtering was applied to the sampled ICP recording to obtain an approximation of continuous ICP recording. c) Simulated Intracranial Pressure. The Autoregressive Moving Average (ARMAX) identification technique was applied to recordings shown in a) and b) above. The ARMAX identification technique determines by least square criteria the set of best fit constants for equation #1 given in Materials and Methods section. By using the ABP recording shown above as the input function to eqn #1, the simulated ICP recording is produced. Of note is that the identification technique is based on variation of pressure and is not dependent on mean values
Fig. 2.

Plateau wave: ICP and ABP recording, serial mean ICP, ABP, and CPP values with corresponding highest modal frequency derived from serial segments of 500 samples of ABP and ICP recordings. (a) ICP Recording. ICP recording illustrates complete plateau wave over a 26 min period. (b) ABP Recording. Corresponding ABP recording over same period as ICP recording in a). (c) Serial Mean ICP. For each 500 serial samples of ICP, mean ICP was computed and plotted at 16.5 s intervals. Standard error within symbol for each plotted point. (d) Serial Mean ABP. Mean ABP computed and plotted as described in c) above. Standard error within symbol for each plotted point. (e) Serial Mean CPP. For each 500 samples of difference between ABP and ICP, mean CPP was computed and plotted. Standard error within symbol for each plotted point. (f) Serial HMF. For each serial 500 samples of paired ABP and ICP recordings, an autoregressive moving average technique was used to determine the best set of constants for cerebrovascular pressure transmission described by equation #1. Given these constants, the highest modal frequency of cerebrovascular pressure transmission for each series of 500 consecutive samples representing 16.5 s was determined and plotted. Onset of wave associated with brief salient decrease in ABP. Termination of plateau period associated with brief increase in ICP and ABP
Mean values of ABP, ICP, and CPP were computed from the 500 paired pressure values representing 16.5 s of paired ABP and ICP recordings. Three recordings contained a complete wave with periods corresponding to before, during, and after the wave. Five recordings contained the onset of a wave, and one recording contained a termination of a wave. For each phase of each set of pressure recording, at least 10 serial mean values representing 16.5 s of paired ABP and ICP recordings were used to compute the grand mean (±standard deviation) of ICP, ABP, CPP, and HMF. The grand mean value (±standard deviation) for the three periods are shown in Table 1.
Table 1.
Grand mean (±S.D) of ICP, HMF, CPP, & ABP before, during, and after plateau wave
| Phase of wave and No. recordings | ICP (mmHg) | HMF (Hz) | CPP (mmHg) | ABP (mmHg) |
|---|---|---|---|---|
| Before | 28.3 ( ±5.5) | 2.69 ( ±1.01) | 58.2 ( ±7.6) | 86.5 ( ±5.2) |
| (n = 8) | P < 0.0003a | P < 0.00003 | P < 0.00036 | |
| During | 48.5 ( ±6.6) | 4.71 ( ±0.70) | 37.2 ( ±8.41) | 86.4 ( ±7.6) |
| (n = 9) | P < 0.017 | P < 0.026 | P < 0.028 | |
| After | 21.9 ( ±8.9) | 2.32 ( ±2.32) | 67.1 ( ±7.84) | 89.3 ( ±10.1) |
| (n = 4) |
Level of significance between grand means was determined using Student’s t-test
Individual grand mean values of HMF, ICP, and CPP for each period in each recording were plotted (see Fig. 3). Grand mean ICP was found to inversely correlate with grand mean CPP with r = −0.85 with regression line parameters of slope and intercept of −0.78 and 75.5 mmHg, respectively (see Fig. 3a). Also, grand mean HMF inversely correlated with grand mean CPP with r = −0.87 with regression line parameters of slope and intercept of −0.083 Hz/mmHg and 7.68 Hz, respectively (see Fig. 3b).
Fig. 3.
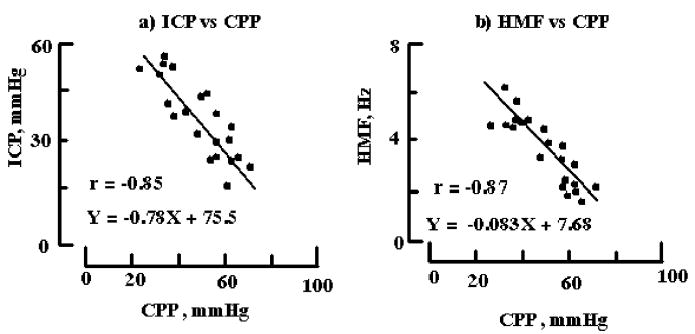
Inverse relationship between intracranial pressure, highest modal frequency, and cerebral perfusion pressure. (a) ICP vs. CPP. Mean paired values of ICP and CPP for all recordings segments (N = 21) are plotted. Standard error bar is within each symbol. Linear regression line parameters of slope and intercept are −0.78 and 75.5 mmHg, respectively, with correlation value of −0.85 at P < 0.001. (b) Highest Modal Frequency vs. CPP. As described in a) above mean values of HMF and CPP were determined and plotted. Linear regression parameters of slope and intercept are −0.083 Hz/mmHg and 7.68 Hz with correlation value of −0.87 at p < 0.001
Discussion
The vasodilatory/constrictive cascade model postulates the occurrence of dynamic structural and functional changes of the cerebrovascular bed associated with the onset and termination of a plateau wave. To evaluate the postulated descriptive changes of the cascade model, a novel measure, the HMF of cerebrovascular pressure transmission, was derived from paired ABP and ICP recordings obtained before, during, and after a plateau wave. Mean HMF significantly increased at onset and significantly decreased at termination of plateau wave (see Table 1). Such a finding provides additional support for the active vasodilatory and constrictive changes of the cerebrovascular bed at onset and termination of a plateau wave described by the cascade model.
To some, our findings may seem obvious, intuitive, and established knowledge ever since ICP and CPP monitoring were initiated. What is original in this study is use of the methodology which employs modal frequency analysis on clinical pressure recordings. Recently, demonstrated in a laboratory study that during active cerebrovascular pressure regulation the relationship between HMF and CPP is an inverse one in uninjured preparations [3]. In this study the relationship between HMF and CPP was also found to be inverse (see Fig. 3b) which is consistent with our laboratory finding that pressure regulation is intact when the HMF is inversely related to CPP [3].
Use of HMF analysis enables both a structural and functional understanding of changes in cerebrovascular pressure transmission which may occur during a plateau wave. In particular, the rapid increase of HMF at the onset of the wave (see Table 1 and Fig. 2f) is consistent with the structural and functional changes of the cerebrovascular bed described by the vasodilatory cascade model [7, 8]. Structurally, dilation results in an increase of the compliance of the arterial-arteriolar bed and a decrease of intracranial compliance primarily due to decreased compliance of the cerebrovascular venous bed. Functionally, vasodilation results in a significant reduction of arterial-arteriolar resistance and increased intravascular pressure within the cerebrovascular bed. At termination of the wave, the structural and functional changes of vasoconstriction are the reverse of those that occur during vasodilation. Compliance of the arterial-arteriolar bed is reduced because of increased vascular tone, intracranial compliance increases due to increased compliance of the cerebrovascular venous bed. Functionally, vasoconstriction results in an increase of arterial-arteriolar resistance and a decrease of intravascular pressure with the cerebrovascular bed. These changes are consistent with the decrease of the HMF observed at the termination of the wave (see Table 1 and Fig. 2f ).
Our reported strong correlative linear relationships between mean ICP, mean CPP, and mean HMF all support the contention that all of the patients had some degree of pressure regulation. Rosner has previously reported that ICP correlated indirectly with CPP for a group of patients who demonstrated plateau waves [7]. Here we report a similar finding for our patient group with the correlation between mean ICP and mean CPP at r = −0.85 (see Fig. 3a). With cerebral arterial pressure regulation, an increase in CPP would cause active vasoconstriction resulting in a reduction in CBV and ICP; whereas, a decrease in CPP would cause active vasodilation resulting in an increase of CBV and ICP [8]. The strong negative correlation (r = −0.87) between mean HMF and mean CPP further supports the contention that pressure regulation was at least partially intact in all patients (see Fig. 3b). With pressure regulation, increases of CPP cause active vasoconstriction which produces structural and functional changes of the cerebrovascular bed that are consistent with the reduction of the HMF. The converse also occurs with active vasodilation associated with reduced CPP. In contrast, with loss of pressure regulation, an increase of CPP would cause passive vasodilation (distension) and an increase of the HMF, while a decrease of CPP would cause passive vasoconstriction (compression) and a decrease of the HMF. The HMF would be directly related to CPP.
In summary, predicted changes in the cerebrovascular bed during a plateau wave described by the vasodilatory/constriction cascade model were evaluated by examining changes in the HMF of cerebrovascular pressure transmission of ABP to ICP. The predicted structural and functional changes of the cerebrovascular bed associated with the cascade model were validated by the finding that mean HMF values increased significantly at the onset and decreased significantly at termination of the wave. In addition, the strong inverse linear correlation between HMF and CPP supports the contention that all patients who demonstrate plateau waves have some degree of cerebrovascular pressure regulation at onset and termination of the plateau wave.
Acknowledgments
This project was partially (MC and JDP) supported by the UK Government Technology Foresight Initiative, and the Medical Research Council (Grant No G9439390 ID 65883). This research was also supported in part by the NHLB National Institutes of Health.
Dr. M. Czosnyka is on leave from Warsaw University of Technology, Poland.
References
- 1.Czosnyka M, Piechnik P, Richards HK, Kirpatrick P, Smielewski P, Pickard JD. Contribution of mathematical modeling to the interpretation of bedside tests of cerebrovascular autoregulation. J Neurol Neurosurg Psychiat. 1997;63:721–731. doi: 10.1136/jnnp.63.6.721. [DOI] [PMC free article] [PubMed] [Google Scholar]
- 2.Czosnyka M, Smielewski P, Piechnik S, Schmidt E, Al-Rawi PG, Kirkpatrick PJ, Pickard JD. Hemodynamic characterization of intracranial pressure plateau waves in head-injured patients. J Neurosurg. 1999;92:11–19. doi: 10.3171/jns.1999.91.1.0011. [DOI] [PubMed] [Google Scholar]
- 3.Daley ML, Pourcyrous M, Timmons SD, Leffer CW. Assessment of cerebrovascular autoregulation: changes of highest modal frequency of cerebrovascular pressure transmission with cerebral perfusion pressure. Stroke. 2004;35:1952–1956. doi: 10.1161/01.STR.0000133690.94288.c9. [DOI] [PubMed] [Google Scholar]
- 4.Ljung L (1987) Chapter 1: Introduction. In: System identification: theory for the user. Prentice Hall, Upper Saddle River, NJ, pp 1–12
- 5.Lundberg N (1960) Continuous recording and control of ventricular fluid pressure in neurological practice. Acta Psychiat Neurol Scand (Copenhagen) (thesis) [PubMed]
- 6.Risberg J, Lundberg N, Ingvar DH. Regional cerebral blood volume during acute transient rises of the intracranial pressure (plateau waves) J Neurosurg. 1969;31(3):303–310. doi: 10.3171/jns.1969.31.3.0303. [DOI] [PubMed] [Google Scholar]
- 7.Rosner MJ (1986) The vasodilatory cascade and intracranial pressure. In: Miller JD, Teasdale GM, Rowan JO (eds) Intracranial pressure VI. Springer, Berlin, pp 137–141
- 8.Rosner MJ, Becker DP. Origin and evolution of plateau waves. Experimental observations and a theoretical model. J Neurosurg. 1984;60(2):312–324. doi: 10.3171/jns.1984.60.2.0312. [DOI] [PubMed] [Google Scholar]