

Abstract
Stimulation of the T-cell receptor (TCR) results in the activation of several transcription factors, including NF-κB, that are crucial for T-cell proliferation and gain of effector functions. On TCR engagement, several proteins within the TCR-directed NF-κB signaling pathway undergo dynamic spatial redistribution, but the significance of these redistribution events is largely unknown. We have previously described TCR-induced cytoplasmic structures called POLKADOTS (punctate and oligomeric killing or activating domains transducing signals) that are enriched in the NF-κB signaling intermediate, Bcl10. We now show that these structures are formed only under conditions that promote efficient NF-κB activation. Furthermore, POLKADOTS formation is dependent on functional domains of specific NF-κB signal transducers. Through use of a photoactivatable GFP, we demonstrate that POLKADOTS contain both a highly stable and a rapidly equilibrating protein component. FRET analyses show that POLKADOTS are sites of enriched interactions between Bcl10 and partner signaling proteins. These observations strongly suggest that POLKADOTS are focal sites of dynamic information exchange between cytosolic intermediates in the process of TCR activation of NF-κB.
INTRODUCTION
T lymphocytes are critical mediators of the adaptive immune response. The T-cell response to foreign antigen is governed primarily by the T-cell receptor (TCR), a heterodimeric cell surface transmembrane receptor that recognizes processed peptides in the context of the major histocompatibility complex (MHC; Davis et al., 1998). Via its association with a complex of transmembrane molecules called CD3, the TCR activates T-cell cytoplasmic signal transducers, including kinases, phosphatases, and phospholipases (Nel, 2002). TCR ligation leads to the activation of complex signaling pathways, culminating in the activation of the transcription factors NF-κB, NFAT, and AP-1 (Isakov and Altman, 2002). Activation of NF-κB is of particular importance in the T-cell response to antigen, because NF-κB activation is required for T-cells to successfully enter S phase (Boothby et al., 1997). Furthermore, entry into S-phase and subsequent proliferation are required for acquisition of the majority of T-cell effector functions (Lanzavecchia and Sallusto, 2002).
Recent studies have identified multiple cytosolic mediators that are involved in signal transduction from the TCR to NF-κB. Early TCR-generated signals activate the kinases PDK1 (Lee et al., 2005) and protein kinase C θ (PKCθ; Villalba et al., 2000; Sedwick and Altman, 2004), which cooperatively transduce a signal (Lee et al., 2005) to a protein complex containing CARMA1, Bcl10, and MALT1 (McAllister-Lucas et al., 2001). Bcl10 is a caspase recruitment domain (CARD)-containing adapter protein that apparently connects the caspaselike protein MALT1 to upstream CARD-containing signaling molecules, including the MAGUK protein, CARMA1 (Lin and Wang, 2004), and the kinase, RIP2 (Ruefli-Brasse et al., 2004). Knockouts of the PKCθ, CARMA1, Bcl10, and MALT1 genes have confirmed that each plays an essential role in TCR activation of NF-κB (Lin and Wang, 2004). Biochemical data suggest that TCR signaling induces the oligomerization of Bcl10 and MALT1, leading to the subsequent oligomerization and activation of the ubiquitin ligase, TRAF6, which is bound to the C-terminus of MALT1 (Sun et al., 2004). Activated TRAF6 mediates the K63-linked ubiquitination of the noncatalytic IκB kinase (IKK) γ subunit of the IKKα/β/γ complex (Deng et al., 2000). K63-ubiquitination of IKKγ stimulates the recruitment of the kinase TAK1, leading to the phosphorylation of the IKKβ subunit of the IKK complex (Sun et al., 2004; Zhou et al., 2004). Activated IKKβ then phosphorylates IκBα, resulting in its ubiquitination and subsequent degradation by the proteasome (Karin and Ben-Neriah, 2000). Degradation of IκBα releases cytoplasmic NF-κB, allowing it to enter the nucleus and activate target gene transcription (Ghosh et al., 1998).
Previous studies by many groups have shown that several transmembrane and cytoplasmic T-cell signaling proteins undergo dynamic spatial redistribution in response to TCR engagement (Jacobelli et al., 2004). In particular, multiple members of the TCR-regulated NF-κB signaling pathway have been shown to redistribute over time to the immunological synapse (IS), the junction between a T-cell and an antigen-presenting cell (APC), where the TCR becomes clustered and transduces signals. Specifically, PKCθ, CARMA1, Bcl10, and the IKK complex have been reported to redistribute to the cytoplasmic face of the stimulated TCR (Monks et al., 1997; Gaide et al., 2002; Hara et al., 2004; Schaefer et al., 2004). Interestingly, we have previously reported that a distinct pattern of Bcl10 redistribution precedes its enrichment at the IS. Thus, within the first few minutes after TCR stimulation, Bcl10 initially forms punctate and filamentous structures throughout the T-cell cytosol. Over time, these structures become reorganized, migrating to and clustering at the IS. Because these Bcl10 structures resemble the filamentous structures formed in apoptosis signaling (Siegel et al., 1998), we named them punctate and oligomeric killing or activating domains transducing signals (POLKADOTS; Schaefer et al., 2004).
Our data demonstrated that POLKADOTS formation requires upstream signaling from PKCθ, as well as a functional Bcl10 CARD, whereas cytoskeletal filaments (F-actin, microtubules, and intermediate filaments) are not required. We also showed that the kinetics of POLKADOTS formation closely mirror the kinetics of biochemical activation of NF-κB. In combination with the biochemical evidence showing that Bcl10 oligomerization is involved in activation of the IKK complex (Zhou et al., 2004), our previous observations (Schaefer et al., 2004) suggested that Bcl10 POLKADOTS may be mechanistically involved in transducing TCR-originated signals to NF-κB. In the current study, we sought to further investigate the hypothesis that POLKADOTS are cytoplasmic sites at which oligomerized Bcl10 transmits signals that ultimately result in the activation of NF-κB.
MATERIALS AND METHODS
Cells and Reagents
D10 T-cells and CH12 B cells were maintained as previously described (Schaefer et al., 2004). Conalbumin was purchased from Sigma (St. Louis, MO). Conalbumin variant peptides (Dittel and Janeway, 2000) were synthesized by the Biomedical Instrumentation Center at the Uniformed Services University, and were used for stimulation experiments at 5 μg/ml. Serine-32 phosphorylated IκBα was detected with a rabbit polyclonal primary antibody (Cell Signaling Technology, Beverly, MA), followed by Alexa555-conjugated goat anti-rabbit IgG (Molecular Probes, Eugene, OR). Anti-LFA-1 antibody I21/7.7 and anti-TCR antibody H57-597 were purified from the hybridomas using protein G and protein A chromatography, respectively. Rat IgG2a isotype control antibody (eBR2a) was purchased from eBioscience (San Diego, CA). Bcl10 was detected with a rabbit polyclonal antibody (H-197; Santa Cruz Biotechnology, Santa Cruz, CA). FLAG-MALT1 was detected with a mouse monoclonal anti-FLAG antibody (M2; Sigma). Actin was detected with a goat polyclonal antibody (I-19; Santa Cruz Biotechnology). Cellular membranes were stained with CellTrace Bodipy TR methyl ester (Invitrogen, Carlsbad, CA).
Cloning and Retroviral Infections
cDNAs encoding murine Bcl10, PKCθ, MALT1, RIP2, TRAF6, and CARD9 were obtained from IMAGE consortium expressed sequence tag (EST) clones (Invitrogen and ATCC, Rockville, MD). The CARMA1 cDNA was a gift from J. Pomerantz (Johns Hopkins University) and D. Baltimore (Caltech). All cDNAs were of mouse origin, with the exception of the CARD9 cDNA, which was of human origin. cDNAs were fused to the cerulean variant of CFP (Rizzo et al., 2004), the citrine variant of YFP (Griesbeck et al., 2001), mKO (MBL International) or photoactivatable GFP (PA-GFP; Patterson and Lippincott-Schwartz, 2002). The CFP and YFP genes also contained the A206K mutation, which causes these proteins to behave as monomers, even at high local concentration (Zacharias et al., 2002). Bcl10-ΔMALT1-GFP was constructed from Bcl10-GFP by deleting residues encoding amino acids 107–119, as previously reported (Lucas et al., 2001). MALT1 constructs were fused with the sequence encoding the FLAG epitope, replacing the starting methionine of MALT1 with the Met-FLAG epitope tag. FLAG-MALT1 deletion constructs were then constructed from the full-length FLAG-MALT1 such that MALT1-ΔC contains amino acids 2–344 of the murine MALT1 protein, MALT1-ΔN contains amino acids 345–832, and MALT1–2EA contains the mutations E661A and E814A in the murine equivalents of the previously reported TRAF6 binding sites (Sun et al., 2004). Gene fusions were then cloned into the retroviral expression vectors pEneo or pEhyg (Schaefer et al., 2001). Retroviral infection and selection were as previously described (Schaefer et al., 1999). To confirm that fluorescent protein fusions of signal transduction proteins are fully functional, we compared untagged cDNA constructs to CFP- or YFP-tagged fusion proteins to assess their abilities to activate an NF-κB–responsive luciferase construct in transient transfection assays. In all tests, there were no statistically significant differences between tagged and untagged constructs in induction of NF-κB activity (Supplementary Figure 1).
Confocal Microscopy
Conjugates, 2 × 10⁵, of D10 T-cells and antigen-loaded CH12 B-cells were fixed with 3% paraformaldehyde for 10 min and mounted in 90:10 glycerol: phosphate-buffered saline, with p-phenylenediamine added to reduce photobleaching. Confocal images were taken at room temperature on a Zeiss Pascal LSM 5 microscope using Zeiss AIM software in multitrack mode (Thornwood, NY). Images were obtained with a 40× Plan-Neofluar 1.3 NA objective or a 100× Plan-Apochromat 1.4 NA objective. CFP was imaged using the 405-nm line of a diode laser (Point-Source, Southampton, United Kingdom) with a 405/488/543-nm excitation filter, a 515-nm dichroic and a 470–500-nm emission filter. YFP was imaged using the 514-nm line of an argon ion laser (Lasos, Jena, Germany) with a 458/514 nm excitation filter, a 515-nm dichroic and a 530–600 nm emission filter. Alexa-555 was imaged using the 543-nm line of a HeNe laser (Lasos) with a 405/488/543-nm excitation filter, a 515-nm dichroic and a 470–500-nm emission filter. CellTrace Bodipy TR methyl ester was imaged using the 543 line of a HeNe laser with a 405/488/543-nm excitation filter, a 515-nm dichroic and a 590-nm long pass emission filter. For live cell imaging, cells were imaged in phenol red–free EMEM (Cellgro, Herndon, VA) with 10% fetal bovine serum and 25 mM HEPES, pH 7.2. Cells were plated in Lab-Tek chamber slides (Naperville, IL) coated with poly-d-lysine, and imaging was performed with stage and objective heaters maintained at a constant temperature of 37°C. POLKADOTS were scored through visual observation of Bcl10 and/or MALT1 clustering. Because both molecules are constitutively enriched in a single cellular focus that colocalizes with the microtubule organizing center (MTOC; unpublished data), cells were scored as positive for POLKADOTS only if at least two punctate or filamentous structures were observed (the vast majority of cells had more than this) in the cell, which were brighter than the average cytosolic fluorescence by at least a factor of 2.
Fluorescence Energy Resonance Transfer
For each pair of proteins examined, three cell lines were prepared: CFP fusion protein only, YFP fusion protein only, and a cell line expressing both fusion proteins. Conjugates from all three cell lines were prepared in tandem, as described above for confocal microscopy. Cells were imaged on a Zeiss Pascal LSM 5 microscope using Zeiss AIM software. Images were obtained with a 40× Plan-Neofluar 1.3 NA objective. Images were collected in multitrack mode with four channels: DIC, CFP, YFP, and fluorescence energy resonance transfer (FRET). CFP was imaged using the 458-nm line of an argon ion laser (Lasos) with a 458/514-nm excitation filter, a 515-nm dichroic and a 470–500-nm emission filter. YFP was imaged as described above. FRET was visualized with the 458-nm line of an argon ion laser (Lasos), a 458/514-nm excitation filter, a 515-nm dichroic and a 530–600-nm emission filter. All filters were from Chroma (Brattleboro, VT). Images were gathered without binning, at 12 bit, with 4 times averaging and with a pixel time of 1.6 μs. N-FRET was calculated as previously described (Xia and Liu, 2001), using the Aim software FRET macro v1.5d (Zeiss) and the default settings. Cross-talk parameters and N-FRET estimates were calculated using 50–100 cells each.
Photoactivation of PA-GFP
D10 T-cells, 1 × 10⁵, expressing Bcl10-PA-GFP and MALT1-mKO were conjugated to CH12 B cells for 20 min in poly-d-lysine (Sigma)-coated Lab-Tek chamber slides. Live cell imaging was as described above. Images were obtained on a Zeiss 510 Meta laser scanning confocal microscope with a 63× Plan-Apochromat 1.4 NA objective using Zeiss Aim software. mKO was imaged using the 543-nm line of a HeNe laser (Lasos) with a 700/543-nm excitation filter, a 545-nm dichroic and a 560–615-nm emission filter. Activated PA-GFP was imaged using the 488-nm line of an argon ion laser (Lasos), a 700/488-nm excitation filter and a 500–550-nm emission filter. Multiphoton PA-GFP activation was performed using the Aim software bleach macro (Zeiss) with 800-nm excitation from a TI:Sapphire Chameleon laser (Coherent, Palo Alto, CA) with an activation time of <1 s. One-photon activation of PA-GFP was performed as previously described (Patterson and Lippincott-Schwartz, 2002).
Western Blotting
For each time point 2–5 × 10⁶ D10 T-cells were stimulated on 100 μg/ml plate-bound anti-TCR antibody. Cells were lysed in 1× Laemmli buffer with sonication, and 1 × 10⁶ cell equivalents were run per lane. Samples were subjected to SDS-PAGE gel electrophoreses, transferred to a nitrocellulose membrane, and probed with an anti-P-IκBα antibody (Cell Signaling Technology). Membranes were stripped with Restore Western blot stripping buffer (Pierce, Rockford, IL) and reprobed with additional antibodies, as indicated in Figure 4. Primary antibodies were detected with species-specific HRP-conjugated secondary antibodies (Jackson ImmunoResearch, West Grove, PA). Membranes were developed with SuperSignal Dura (Pierce), imaged on a Fuji LAS-3000 CCD camera system and quantified using MultiGauge 3.0 software (Fuji, Stamford, CT). Phosphate-buffered saline values were calculated using a Student's t test.
Figure 4.

A functional MALT1 C-terminus is required for TCR-mediated NF-κB activation and POLKADOTS formation. (A) Diagram depicting the MALT1 deletions used in this study. (B) %N-FRET between Bcl10-CFP and MALT1-YFP constructs. Red dashed line indicates the threshold for significant FRET detection in this study. Data are means ± SEM. (C) D10 T-cells expressing Bcl10-CFP plus the indicated MALT1-YFP constructs were stimulated with anti-TCR and subjected to Western blot analysis. (D) Relative phosphorylation of IκBα (vs. wild-type, t = 0) was quantified for each cell line. Data are means of three experiments ± SEM. (E) p values for each mutant versus wild-type MALT1 were quantified at each time point, using a Student's t test. (F) POLKADOTS formation was assessed through confocal microscopy. POLKADOTS formation, FRET data and NF-κB activation (as indicated by IκBα phosphorylation) are summarized for each MALT1 construct. Y, yes; N, no. No FRET means FRET was beneath the 0.5% threshold of background, shown in B. Asterisk (*) indicates detection of a small number of cells with POLKADOTS containing only Bcl10-CFP.
RESULTS
Productive and Continuous T-Cell Receptor Signaling Is Required for POLKADOTS Formation and Maintenance
We have previously shown that T-cell Bcl10 redistributes to POLKADOTS in response to specific antigen stimulation of the TCR, and we showed that POLKADOTS formation is dependent on PKC activity and occurs after PKCθ translocation to the IS (Schaefer et al., 2004). However, these experiments were performed under conditions of optimal antigen stimulation. To determine how suboptimal stimulation of the TCR influences PKCθ translocation and POLKADOTS formation, we performed an antigen titration experiment. D10 T-cells expressing PKCθ-CFP and Bcl10-YFP were stimulated with APCs (CH12 B cells), which had been loaded with increasing doses of stimulatory antigen (conalbumin). Microscopic analyses showed that both PKCθ translocation and Bcl10 POLKADOTS formation occurred with reduced frequency as the concentration of stimulatory antigen was lowered (Figure 1A). Although T-cells with PKCθ translocation almost always also contained Bcl10 POLKADOTS, a large fraction of cells had Bcl10 POLKADOTS in the absence of PKCθ translocation. These results are consistent with our live cell observations showing that PKCθ translocation precedes formation of Bcl10 POLKADOTS (Schaefer et al., 2004). On initiation of Bcl10 POLKADOTS formation, we observed a reversal of PKCθ enrichment at the IS, with the result that POLKADOTS persisted in an enriched state after detectable PKCθ translocation had terminated (Schaefer et al., 2004). Thus, in cells that contain POLKADOTS, but no PKCθ translocation (Figure 1A), the enrichment of PKCθ at the IS had presumably already completely reversed.
Figure 1.
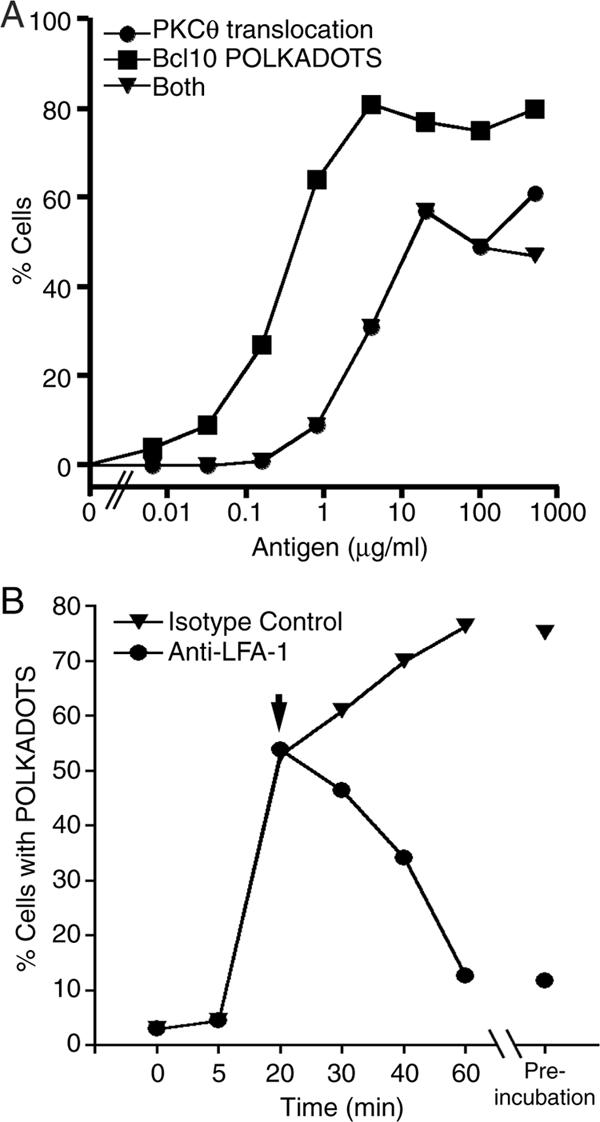
Formation and maintenance of POLKADOTS is influenced by antigen concentration and duration of TCR signaling. (A) D10 T-cells expressing PKCθ-CFP+Bcl10-YFP were conjugated with CH12 B cells in the presence of the indicated concentrations of conalbumin for 30 min. The percentage of cells having PKCθ translocation, Bcl10 POLKADOTS formation, or both redistributions was quantified. (B) D10 T-cells expressing Bcl10-CFP+MALT1-YFP were conjugated with CH12 B cells in the presence of 250 μg/ml conalbumin. After 20 min, 100 μg/ml anti-LFA-1 antibody, or an isotype control antibody, was added to disrupt T-cell/B-cell conjugates. Data represent ≥100 cells per time point.
We also previously observed that POLKADOTS formation commenced ∼7–10 min after initial (optimal) antigen stimulation, and Bcl10 enrichment in POLKADOTS continued for at least 30 min after initial formation (Schaefer et al., 2004). To assess whether continuous TCR signaling is required for the maintenance of POLKADOTS, D10 T-cells expressing Bcl10-CFP were conjugated with antigen-loaded APC for 20 min. To prematurely terminate TCR signaling, T-cell/APC conjugates were disrupted by addition of anti-LFA-1 antibody, or treated with an isotype control antibody. Microscopic analyses of the cell population after conjugate disruption revealed that continuous cell–cell contact was required for POLKADOTS maintenance. Disruption of T-cell/APC interaction resulted in the decay of cytosolic POLKADOTS over a period of 30 min, to levels comparable to preincubation with anti-LFA-1 (Figure 1B). Together, the data in Figure 1 show that POLKADOTS formation is directly influenced by the efficiency of TCR stimulation, and that continuous TCR signaling is required for the maintenance of POLKADOTS.
We next investigated the effect of a distinct form of suboptimal TCR stimulation on POLKADOTS formation, using single amino acid substitution variants of the stimulatory conalbumin peptide (Dittel and Janeway, 2000). We stimulated D10 T-cells that express either PKCθ-CFP and Bcl10-YFP or Bcl10-CFP and MALT1-YFP with selected conalbumin peptides having distinct stimulatory efficiencies. Strong agonist peptides (wild-type and I5N) stimulated efficient PKCθ translocation and POLKADOTS formation. In contrast, modest or weak agonists (W7Y, I5L, I5V, and I5G) stimulated no PKCθ translocation and resulted in minimal POLKADOTS formation (Table 1). Furthermore, stimulation by modest or weak agonist peptides caused no detectable increase in phosphorylation of IκBα, indicating that they induced little to no NF-κB activation (Table 1). These results show that measurable NF-κB activation occurs only when POLKADOTS formation and PKCθ translocation are observed, thereby providing further evidence that these translocation events mechanistically participate in TCR activation of NF-κB.
Table 1.
PKCθ translocation and POLKADOTS formation
| Peptide | Antigenic strengtha | POLKADOTS formation (% cells) | PKCθ translocation (% cells) | Relative P-IκBα increaseb |
|---|---|---|---|---|
| Wild-type | Strong | 48.72 | 24.61 | 1.83c |
| I5N | Strong | 41.80 | 23.59 | 1.82c |
| W7Y | Moderate | 9.53d | ND | 1.02 |
| I5L | Moderate | 9.98d | ND | 0.96 |
| I5V | Weak | 4.68 | ND | 0.99 |
| I5G | Weak | 4.85 | ND | 1.04 |
| No antigen | NA | 2.89 | ND | 1 |
ND, none detected; NA, not applicable.
Strength based on IL-4 production (Dittel and Janeway, 2000).
Fold increase in phosphorylated IκBα relative to no antigen.
p < 0.001 vs. no antigen, using the Student's t test.
Smaller POLKADOTS and/or delayed formation.
Interaction between Bcl10 and MALT1 Is Required for POLKADOTS Formation
Previous studies have shown that Bcl10 directly interacts with the caspaselike protein, MALT1 (Uren et al., 2000; Lucas et al., 2001; McAllister-Lucas et al., 2001), and that these proteins cooperatively participate in TCR-mediated activation of NF-κB (Sun et al., 2004). On the basis of these observations, we expected that MALT1 would colocalize with Bcl10 in POLKADOTS. We thus performed a time course experiment to determine the degree of colocalization of Bcl10 and MALT1 in POLKADOTS. D10 T-cells expressing Bcl10-CFP and MALT1-YFP were conjugated with antigen-loaded CH12 B cells and imaged via confocal microscopy. Figure 2 and Supplementary Video 1 show that small POLKADOTS formed by 20 min after stimulation. Over the next hour, the POLKADOTS coalesced into larger structures, with some moving toward the IS. POLKADOTS formation and coalescence peaked at 90 min and then decayed over the next 90 min. By 180 min, the majority of Bcl10 POLKADOTS had decayed, and the remaining MALT1 POLKADOTS were very small (Figure 2). Thus, over 3 h of TCR stimulation, POLKADOTS form, reach a maximal intensity, and begin to disappear. POLKADOTS contain significant levels of both Bcl10 and MALT1 until the reversal phase. The accelerated disappearance of Bcl10 from POLKADOTS may be related to the reported degradation of Bcl10, post-TCR stimulation (Scharschmidt et al., 2004).
Figure 2.

Bcl10 and MALT1 colocalize in POLKADOTS. (A) D10 T-cells expressing Bcl10-CFP+MALT1-YFP were conjugated with CH12 B cells in the presence of 250 μg/ml conalbumin. The percentage of cells with Bcl10 or MALT1 POLKADOTS was quantified for ≥100 cells at various time points. (B) Representative images of Bcl10-CFP (green) and MALT1-YFP (red) POLKADOTS formation and decay at various time points (see also Supplementary Video 1). Bar, 5 μm.
The interaction between Bcl10 and MALT1 has been reported to be functionally important for activation of the IKK complex (Sun et al., 2004; Zhou et al., 2004). To determine whether the interaction between Bcl10 and MALT1 is also necessary for POLKADOTS formation, we constructed a D10 T-cell line expressing a Bcl10 mutant (Bcl10-ΔMALT1-GFP) that cannot interact with MALT1, and cannot activate NF-κB (Lucas et al., 2001). The Bcl10-ΔMALT1-GFP cell line was observed to form no POLKADOTS, whereas a control cell line expressing wild-type Bcl10-GFP efficiently formed POLKADOTS upon antigen stimulation (Figure 3). Thus, Bcl10 must interact with MALT1 for Bcl10 POLKADOTS formation to occur.
Figure 3.

Interaction between Bcl10 and MALT1 is required for POLKADOTS formation. D10 T-cells expressing Bcl10-GFP or Bcl10-ΔMALT1-GFP (lacking amino acids 107–119) were conjugated with CH12 B cells in the presence or absence of 250 μg/ml conalbumin (Antigen) and imaged via wide-field fluorescence microscopy as previously described (Schaefer et al., 2004).
We next performed experiments to determine the influence of various functional domains of MALT1 on the activation of NF-κB and the formation of POLKADOTS. We constructed mutants of MALT1 lacking the C-terminus (ΔC), lacking the N-terminus (ΔN), or having mutated TRAF6 binding sites (2EA; Figure 4A). The TRAF6 binding sites are required for MALT1-mediated activation of the IKK complex (Sun et al., 2004). Because only the N-terminus of MALT1 is required for interaction with Bcl10 (Lucas et al., 2001; Che et al., 2004), we expected that all of the MALT1 constructs except the ΔN mutant would interact with Bcl10. We used FRET to measure interactions between Bcl10-CFP and MALT1-YFP constructs in D10 T-cells. Although there were slight differences in Bcl10 binding efficiency between the wild-type, ΔC, and 2EA mutants, all clearly bound to Bcl10, whereas the ΔN mutant did not bind to Bcl10, either before or after antigen stimulation (Figure 4B).
We next assessed NF-κB activation in these cell lines by quantifying increases in phosphorylation of IκBα. Consistent with previously reported data in the Jurkat T-cell line (Che et al., 2004), deletion of the MALT1 C-terminus blocked NF-κB activation. As expected (Sun et al., 2004), mutation of the TRAF6 binding sites (2EA) also blocked NF-κB activation. Moreover, the basal level of NF-κB activation in the 2EA-expressing cell line was also significantly diminished. In contrast, deletion of the MALT1 N-terminus did not inhibit NF-κB activation (Figure 4, C–E), and caused a reproducible enhancement of basal IκBα phosphorylation in unstimulated cells (albeit statistically insignificant). We also assessed the degree of Bcl10 phosphorylation. Although the significance of Bcl10 phosphorylation has not yet been determined, we previously observed that phosphorylation of Bcl10 is TCR- and PKC-dependent, and occurs with kinetics that closely mimic the kinetics of NF-κB activation (Schaefer et al., 2004). However, as shown in Figure 4C, the occurrence and degree of Bcl10 phosphorylation does not seem to follow a predictable pattern. Although there is some degree of correlation with the level of overexpression of the Bcl10-CFP fusion protein (Supplementary Figure 3), the lack of correlation with IκBα phosphorylation suggests that phosphorylation of the Bcl10 protein may not participate in NF-κB activation. Indeed, our preliminary data suggest that phosphorylation is confined to the C-terminal third of the Bcl10 protein (F. Langel and B. Schaefer, unpublished data), a region that is not required for Bcl10 activation of NF-κB (Lucas et al., 2001). Overall, these data show that a MALT1 C-terminal region containing functional TRAF6 binding sites is required for TCR-mediated activation of NF-κB.
We next determined the effects of the MALT1 mutants on POLKADOTS formation, using confocal microscopy to detect Bcl10/MALT1 POLKADOTS after antigen stimulation. We found that only the cell line expressing wild-type MALT1 formed Bcl10/MALT1 POLKADOTS. The ΔC cell line exhibited no POLKADOTS formation, whereas cell lines expressing the ΔN and 2EA mutants formed a few POLKADOTS containing only Bcl10 in a minority population of cells (Figure 4F). We hypothesize that the sporadic Bcl10-only POLKADOTS may reflect the fact that endogenous MALT1 is still being expressed in these cells, allowing for the induction of some POLKADOTS formation. Overall, however, the data in Figure 4 demonstrate that POLKADOTS form only when a fully functional MALT1 interacts with Bcl10. Moreover, the fact that the 2EA mutant fails to form POLKADOTS strongly suggests that TRAF6 must also interact with this complex in order for Bcl10 and MALT1 to redistribute to the POLKADOTS structures.
POLKADOTS Are Enriched in Both Stable and Rapidly Equilibrating Bcl10
To better understand the physical nature of POLKADOTS, we devised a set of experiments to determine whether POLKADOTS are stable sites of enrichment of cytoplasmic Bcl10, or, alternatively, whether the Bcl10 in POLKADOTS is at rapid equilibrium with the cytosolic pool of Bcl10. For these experiments, Bcl10 was fused to a PA-GFP (Patterson and Lippincott-Schwartz, 2002), and MALT1 was fused to the reef coral fluorescent protein, monomeric Kusabira-Orange (mKO; Karasawa et al., 2004). D10 T-cells expressing Bcl10-PA-GFP and MALT1-mKO were then used in photoactivation experiments. Bcl10-PA-GFP was activated in either the cytoplasm or in POLKADOTS, and then imaged over time. MALT1-mKO was used as a marker for the location of POLKADOTS.
As shown in Figure 5, A and B, and Supplementary Video 2, multiphoton activation of PA-GFP in a single POLKADOT results in stable fluorescence over a period of at least 30 min, with no detectable equilibration of PA-GFP with the cytosolic pool. These results suggested that POLKADOTS are sites of extremely stable enrichment of Bcl10. Next, we activated PA-GFP in the cytosol, to determine equilibration kinetics in the cytoplasm. After cytosol activation, we observed identical PA-GFP fluorescence in the activated cytoplasm region of interest (ROI) and in a distal cytoplasm ROI, from the earliest postactivation time point (8 s; Supplementary Videos 3 and 4). Thus, as expected, there is rapid equilibration of PA-GFP in the cytoplasm (Figure 5C). In contrast, we were quite surprised to observe rapid equilibration of photoactivated cytosolic PA-GFP with POLKADOTS (Figure 5D, Supplementary Videos 5 and 6), a result that initially appeared to contradict the results of photoactivation of single POLKADOTS. This experiment was repeated several times to confirm that it was not simply the result of performing photoactivation during a period in which POLKADOTS were still rapidly forming. In every case, the same phenomenon was observed (four distinct examples are shown in Figure 5E). Importantly, the rapid incorporation of cytosolically activated PA-GFP into POLKADOTS is not followed by any measurable gain in fluorescence over time, further demonstrating that these observations are reflective of a process of rapid equilibration, rather than a continued incorporation of cytosolic Bcl10 into POLKADOTS during their formation. Thus, we conclude that POLKADOTS are also at rapid equilibrium with the cytosolic pool of Bcl10. In sum, these data show that POLKADOTS consist of two distinct pools of Bcl10 protein: a population of Bcl10 protein that is very stably incorporated in POLKADOTS, and a second population of Bcl10 molecules that are in rapid equilibrium with cytosolic Bcl10.
Figure 5.

POLKADOTS contain both stably incorporated Bcl10 and Bcl10 that is at rapid equilibrium with the cytosolic pool. (A) D10 T-cells expressing Bcl10-PA-GFP+MALT1-mKO were conjugated to CH12 B cells in the presence or absence of 250 μg/ml conalbumin. Bcl10-PA-GFP was activated in a single POLKADOT, via 800-nm (multiphoton) excitation. Images were collected for Bcl10-PA-GFP (green), MALT1-mKO (red), and Nomarski (blue). Data are shown immediately before PA-GFP activation (–1 s) and at the indicated time points after activation (see also Supplementary Video 2 and Supplementary Figure 2). Arrow is at t = 8 s is site of photoactivation; bar, 5 μm. (B) POLKADOTS fluorescence intensity was quantified after multiphoton activation of a single POLKADOT. (C) Bcl10-PA-GFP was activated via single-photon excitation of a cytoplasmic Region of interest (ROI), using 405-nm excitation. Fluorescence intensity was quantified in the activated cytoplasm ROI and in a distant cytoplasm ROI (see also Supplementary Videos 3 and 4). (D) Bcl10-PA-GFP was activated in a cytoplasmic ROI as in C, and relative fluorescence intensity was quantified for a distal POLKADOT, as well as for the activated and distal cytoplasm ROIs (see also Supplementary Videos 5 and 6). (E) Distal POLKADOTS fluorescence intensity data from four cells, with conditions as in D. For all graphs, fluorescence of a cytoplasm ROI in a previously photoactivated cell (Control Cell) was included to show the rate of imaging-induced photobleaching. Results are typical for 5–10 cells per condition.
POLKADOTS Are Sites of Enrichment of Functional Signaling Interactions
The presence in POLKADOTS of a population of Bcl10 molecules in rapid equilibration with cytosolic Bcl10 suggests that POLKADOTS are sites of dynamic formation and dissociation of protein–protein interactions between Bcl10 and itself, possibly via CARD–CARD homotypic interactions or activation-induced oligomerization of partner proteins such as TRAF6. The close relationship between POLKADOTS and TCR activation of NF-κB further suggests that POLKADOTS may also represent sites of heterotypic interactions between Bcl10 and known partner signaling proteins. Bcl10 has been reported to interact with numerous cytoplasmic signaling molecules including MALT1, the CARD proteins RIP2, CARMA1, and CARD9, and, the ubiquitin ligase TRAF6 (an indirect interaction, via MALT1; Koseki et al., 1999; Bertin et al., 2000, 2001; Lucas et al., 2001; Ruefli-Brasse et al., 2004; Sun et al., 2004). To investigate the interactions between Bcl10 and these partner signaling proteins in T-cells, we made YFP fusions of each of these proteins and introduced them into D10 cells that also expressed Bcl10-CFP. We then assessed interactions between Bcl10 and each partner signaling protein by performing FRET analyses both in the whole cell and in individual POLKADOTS.
As we showed in Figure 4B, we used FRET to measure the interaction of various MALT1 constructs with Bcl10, confirming that this interaction depends on the N-terminus of the protein, as previously reported (Lucas et al., 2001). In Figure 6, A and B, we extended these results by performing FRET analysis on both whole cells and POLKADOTS. As is suggested by the strong colocalization of Bcl10 and MALT1 in POLKADOTS, there is also enhanced FRET between Bcl10 and MALT1 in these structures. Bcl10-MALT1 FRET in POLKADOTS peaks at 20 min, and declines significantly by 60 min. This apparent dissociation over time of MALT1-Bcl10 interactions in POLKADOTS is consistent with the distinct kinetics of disappearance of Bcl10 and MALT1 from POLKADOTS at late time points after stimulation (see Figure 2). These FRET kinetics furthermore suggest that dissociation of close Bcl10-MALT1 interactions begins while there is still strong colocalization of Bcl10 and MALT1 in POLKADOTS.
Figure 6.

POLKADOTS are sites of enriched interactions between Bcl10 and partner signaling proteins. (A) Confocal microscopy and FRET analyses were performed on D10 T-cells expressing Bcl10-CFP (blue) and MALT1-YFP (yellow), after 20-min stimulation with CH12 B cells loaded with 250 μg/ml conalbumin. Enhanced FRET (purple) is observed in POLKADOTS. Bar, 5 μm. (B–G) FRET analyses were performed as in A for D10 T-cells expressing both Bcl10-CFP and the indicated YFP-fusions of partner signaling proteins. Cells were stimulated with CH12 B cells loaded with no antigen or with 250 μg/ml conalbumin, for the indicated time periods. Percent N-FRET was calculated for whole cells and for POLKADOTS (when present). The red dashed line indicates the threshold for significant FRET detection (see also Supplementary Figure 4). *p < 0.001 for the indicated time point for whole cell versus POLKADOTS values; #p < 0.02 for t = 20 min POLKADOTS versus t = 60 min POLKADOTS values.
Validity of this FRET assay was confirmed by establishing control cell lines, in which FRET was measured both between nonfused versions of CFP and YFP and between Bcl10-CFP POLKADOTS and nonfused YFP (Supplementary Figure 4). In both cases, the FRET values were 0.4–0.5%, and the value of 0.5% thus represents the threshold for detection of significant FRET interactions in our studies (dashed red line). Validity of the assay is further supported by our observation that we detected no significant FRET between Bcl10 and MALT1 when the N-terminal domain of MALT1 (required for Bcl10-MALT1 interaction) was not present (Figure 4B).
As anticipated, enhanced Bcl10-Bcl10 FRET was detected in POLKADOTS, and this FRET increased between 20 and 60 min (Figure 6C), suggesting that Bcl10-Bcl10 homotypic interactions increase over time in POLKADOTS. We also measured FRET between Bcl10 and CARMA1, RIP2, TRAF6, and CARD9 (Figure 6, D–G). With the exception of CARD9, all of these proteins demonstrate measurable interaction with Bcl10 on the whole cell level and enhanced association with Bcl10 in POLKADOTS. It is important to note that the absence of FRET between Bcl10 and CARD9 may have other explanations, such as an orientation or spacing of the CFP and YFP chromophores that does not yield efficient FRET. However, of the above four proteins, only CARD9 has not been reported to participate in TCR activation of NF-κB, and its association with Bcl10 in T lymphocytes has also not been previously investigated. Thus, the observation that CARD9 may not interact with Bcl10 in T-cells, although somewhat surprising, does not contradict previously published data. In contrast, CARMA1, RIP2 and TRAF6 all demonstrate enhanced FRET with Bcl10 in POLKADOTS, suggesting that POLKADOTS are also sites of enrichment of complexes between Bcl10 and these three partner signaling proteins.
The kinetics of FRET between Bcl10 and TRAF6 in POLKADOTS mirrors the kinetics of Bcl10-MALT1 FRET, with the interaction in POLKADOTS maximal at 20 min and declining by 60 min. Because the association of Bcl10 and TRAF6 is mediated by the association of both molecules with MALT1 (Sun et al., 2004), this observation is consistent with published biochemical data.
The lack of observation of FRET between Bcl10 and CARMA1 in POLKADOTS at the 20-min time point was due to the fact that significant POLKADOTS formation does not occur in this cell line until 60 min. We are unsure of the mechanism that accounts for the delayed kinetics of POLKADOTS formation in the Bcl10-CARMA1 cell line. However, it is notable that this cell line was very difficult to produce, with very few cells surviving the initial retroviral infection with the CARMA1-YFP retrovirus. Thus, it is possible that only cells that are impaired in CARMA1-mediated NF-κB activation survived the initial selection, perhaps causing the delayed POLKADOTS formation phenotype. Importantly, though, we did observe significantly enhanced Bcl10-CARMA1 FRET in POLKADOTS, once formed.
Finally, as seen with the Bcl10-Bcl10 homotypic CARD–CARD interactions, the heterotypic CARD–CARD interaction between Bcl10 and RIP2 also increased between 20 and 60 min. Because RIP2 has been reported to phosphorylate Bcl10 (Ruefli-Brasse et al., 2004), and because the kinetics of POLKADOTS formation mirror the kinetics of Bcl10 phosphorylation (Schaefer et al., 2004), the observation of strong Bcl10-RIP2 FRET in POLKADOTS may suggest that POLKADOTS are a major site of phosphorylation of Bcl10 by RIP2.
In summary, in all cell lines exhibiting FRET, the measured FRET was greatest in the POLKADOTS. The simplest interpretation of these observations is that POLKADOTS are sites of enriched interactions between Bcl10 and partner signaling proteins. However, it is important to note that other phenomena, such as protein conformational changes, can also influence FRET (Truong and Ikura, 2001). Given that the data show only increased FRET in POLKADOTS, relative to whole cell FRET, we believe that the data are most consistent with increased protein–protein associations in POLKADOTS. These data thus strongly suggest that POLKADOTS are functional sites of signaling interactions in the TCR-driven NF-κB signaling pathway.
DISCUSSION
Receptor-stimulated assembly of cytoplasmic signal transduction intermediates into macromolecular signaling complexes is poorly understood. For most signaling pathways, there is little or no information regarding whether activated signal transduction intermediates assemble into macromolecular complexes at discrete intracellular sites, or whether assembly of such protein complexes occurs throughout the cytosol, without obvious spatial organization. In this study, we have performed a series of experiments to address the hypothesis that TCR-induced cytoplasmic structures called POLKADOTS are sites of assembly of macromolecular clusters of signaling intermediates, which actively participate in the transduction of signals to NF-κB.
In support of the above hypothesis, we first showed that antigen dose governs the frequency of PKCθ translocation and Bcl10 POLKADOTS formation in T-cells (Figure 1A). We furthermore showed, via anti-LFA-1 disruption of T-cell/APC conjugates, that maintenance of POLKADOTS requires continuous TCR signaling (Figure 1B). Additionally, using previously characterized substitution mutants of the conalbumin peptide, we showed that efficient PKCθ translocation, formation of Bcl10 POLKADOTS, and measurable activation of NF-κB occur only in response to strong agonist peptides (Table 1). Together, the above data establish that TCR stimulation of PKCθ translocation to the IS, formation of Bcl10 POLKADOTS, and activation of NF-κB are closely linked processes that occur efficiently only under conditions of optimal TCR stimulation.
We next investigated the potential role of functional cooperation between Bcl10 and MALT1 in POLKADOTS formation and activation of NF-κB. In Figure 2, we demonstrated that Bcl10 and MALT1 colocalize in POLKADOTS and are recruited to POLKADOTS with indistinguishable kinetics. The importance of direct interaction between Bcl10 and MALT1 for POLKADOTS formation was demonstrated by showing that either deletion of the MALT1 interaction domain of Bcl10 or deletion of the Bcl10 interaction domain of MALT1 abrogates POLKADOTS formation (Figures 3 and 4). Moreover, interaction of Bcl10 with a signaling-competent form of MALT1 is required for POLKADOTS formation, because deletion or point mutation of the TRAF6 binding sites of MALT1 also blocks POLKADOTS formation (Figure 4). These data suggest that Bcl10, MALT1, and TRAF6 are all required participants in assembly of POLKADOTS.
A potentially complicating observation in these experiments was the fact the cell line expressing the MALT1 ΔN mutant (deletion of the Bcl10-binding domain) was not at all impaired in TCR activation of NF-κB, consistent with previously reported results (Che et al., 2004). These results suggest either that the ΔN mutant is not effective as a dominant negative, or that the ΔN mutant is capable of activating NF-κB by a Bcl10-independent mechanism. The following observations suggest that the second possibility is correct: First, the ΔN mutant blocks the formation of Bcl10 POLKADOTS, strongly suggesting that this construct is indeed a potent dominant negative (note that Bcl10 POLKADOTS form robustly in the absence of ectopically expressed wild-type MALT1; see Supplementary Video1 and Schaefer et al., 2004). Second, it has previously been reported that the ΔN mutant can directly interact with CARMA1 (Che et al., 2004). Because CARMA1 is an upstream activator of Bcl10, and because Bcl10-mediated activation of NF-κB appears to be entirely dependent on interaction with MALT1, the direct interaction between CARMA1 and the MALT1 ΔN mutant may bypass the need for Bcl10 in TCR activation of NF-κB. Finally, in some MALT lymphomas that exhibit MALT1 translocations with the IAP-2 gene, the entire Bcl10-interaction domain is deleted, but the translocation product activates NF-κB independently of upstream stimuli, again demonstrating that the MALT1 C-terminus is competent for transducing activating signals. In sum, several lines of evidence strongly suggest that the C-terminus of MALT1 is capable of activating NF-κB independently of interaction with Bcl10 and, consequently, independently of POLKADOTS formation. Further experimentation will be required to determine whether this Bcl10-independent activity of the MALT1 C-terminus occurs only upon substantial overexpression.
In contrast, the presence of the N-terminal Bcl10 interaction domain renders MALT1 completely dependent on Bcl10 for activation of NF-κB, as evidenced by the fact that antigen receptor activation of NF-κB is blocked by deletion of the Bcl10 gene (Ruland et al., 2001). In the case of MALT1 mutants that contain the Bcl10 interaction domains (ΔC and 2EA mutants), there is a strong correlation between blockade of NF-κB activation and inhibition of formation of POLKADOTS. Thus, the above data both suggest that POLAKDOTS formation is an integral feature of NF-κB activation in the context of a MALT1 protein that is capable of interacting with TRAF6, and they are consistent with our model that POLKADOTS formation plays a mechanistic role in TCR activation of NF-κB.
Previous models of TCR-mediated activation of NF-κB have shown a stepwise signal transduction pathway, whereby oligomerization of Bcl10 leads to the binding and oligomerization of MALT1 and then of TRAF6 (Sun et al., 2004). However, our data show that MALT1 and TRAF6 are required for the oligomerization of Bcl10 and the formation of POLKADOTS. Our data furthermore imply that POLKADOTS formation is required for TRAF6-mediated ubiquitination of IKKγ (Sun et al., 2004) and subsequent NF-κB activation. Thus, Bcl10, MALT1, and TRAF6 appear to act in concert, transducing TCR signals to NF-κB. In this capacity, these molecules may best be described as a tripartite enzyme.
To better characterize the composition and assembly of POLKADOTS, we performed studies with Bcl10 fused to a photoactivatable variant of GFP (Patterson and Lippincott-Schwartz, 2002). Photoactivation of individual POLKADOTS versus photoactivation of cytoplasmic ROIs led to the surprising observation that there appear to be two distinct pools of Bcl10 in POLKADOTS: a population of molecules that are stable in POLKADOTS over an extended time period, and a population of molecules that are at rapid equilibrium with the cytosolic pool of Bcl10 (Figure 5). These results are consistent with previous studies that have shown the presence of stable, TCR-signaling induced microdomains that can alter the free diffusion of signaling molecules (Bunnell et al., 2002; Douglass and Vale, 2005).
We propose a model in which the inner “core” of POLKADOTS would contain oligomerized Bcl10, possibly in association with partner signaling proteins such as MALT1 and TRAF6. Whether such oligomerization is driven by Bcl10 CARD–CARD homotypic interactions, or by the oligomerization of a partner protein (e.g., MALT1 or TRAF6), remains to be established. In this model, molecules in the inner core of the POLKADOTS would not be accessible to the cytosol, and would thus not be at equilibrium with cytosolic Bcl10. In contrast, molecules occupying the outer membrane “shell” of the POLKADOTS would be accessible to the cytosol, and we postulate that this is the population of molecules that is at rapid equilibrium with cytosolic Bcl10 (Figure 7). Alternatively, it is also possible that the interactions between proteins in the stable POLKADOTS-associated pool and the freely diffusible pool may occur throughout a porous POLKADOTS structure, as opposed to our postulated outer shell. However, if the core of the POLKADOTS was found to be separated from the shell by a membrane (Figure 7), this second possibility would be much less likely. Indeed, the existence of a membrane boundary separating the outer shell from the inner core is supported by our preliminary observations that Bcl10 and MALT1 POLKADOTS appear to colocalize with membrane bound structures (Supplementary Figure 5). However, further work is needed to confirm this observation, and to further establish the characteristics of this putative membrane boundary.
Figure 7.

Model of possible structure and function of POLKADOTS. As suggested by data from photoactivation experiments with Bcl10-PA-GFP (Figure 5), POLKADOTS are depicted as a stable inner core of Bcl10, surrounded by an outer shell of Bcl10 that is at rapid equilibrium with cytoplasmic Bcl10 monomers, and with Bcl10 molecules complexed with partner signaling proteins (note that there are other possible models, in which interactions with partner signaling proteins occur throughout the POLKADOTS structure). A membrane may separate the inner core from the outer shell (see Supplementary Figure 5). FRET data demonstrate that POLKADOTS are preferential sites of interaction between Bcl10 and partner signal transduction intermediates. Additionally, the high local concentration of these diverse combinations of Bcl10-associated signaling intermediates may facilitate complex interactions and information exchange between signaling intermediates that do not directly interact. Note that the model shows only Bcl10 in the POLKADOTS core, because we have not performed PA-GFP fusions with other partner proteins, to examine their stability in POLKADOTS. It is therefore possible that other Bcl10 partner proteins (e.g., MALT1,TRAF6, etc.) may also reside in this proposed core region.
Finally, FRET studies of interactions between Bcl10 and several previously reported partner signaling proteins (Figure 6) confirmed that, in T-cells, Bcl10 interacts to a significant degree with each of these proteins (with the exception of CARD9). Importantly, upon stimulation of the TCR, significantly higher FRET was detected in POLKADOTS than in the whole cell, demonstrating that POLKADOTS are enriched in interactions between Bcl10 and partner signaling proteins. Similarly, previous reports have shown that TCR-signaling induced microclusters are the sites of early signaling events (Brossard et al., 2005; Campi et al., 2005; Yokosuka et al., 2005). These data thus strongly support our central hypothesis that POLKADOTS are focal sites of TCR-directed NF-κB signal transduction, because they are sites of enrichment of critical protein–protein interactions in the process of TCR activation of NF-κB.
In the context of our model of the structure of POLKADOTS (Figure 7), we propose that rapid equilibration of the outer shell of Bcl10 with cytosolic Bcl10 allows both temporally controlled recruitment of Bcl10-associated partner signaling proteins and complex interactions between these partner proteins at fixed focal sites (POLKADOTS). We propose that such complex interactions are essential steps in TCR activation of NF-κB. Importantly, our proposed model is consistent with recent single molecule studies of the behavior of cytoplasmic signal transducers in T-cells (Douglass and Vale, 2005). These studies showed that, in response to TCR engagement, the T-cell signaling proteins LAT and lck become transiently concentrated in focal, membrane-associated microdomains, which are distinct from lipid rafts. These clusters are static in space, but exchange molecules with the freely diffusible membrane pool of LAT and lck. These LAT-lck membrane aggregates therefore appear to be similar in many respects to POLKADOTS. Thus, further studies may reveal that clustered signaling protein microdomains such as POLKADOTS, which facilitate complex information transfer in discrete focal regions, represent a widely utilized and critically important mechanism for the transduction of receptor-initiated signals in eukaryotic cells.
Supplementary Material
Acknowledgments
We thank Drs. Joel Pomerantz and David Baltimore for supplying the CARMA1 cDNA clone, Erin Wohl for cloning the N-terminus of the murine MALT1 cDNA, and Drs. Joe Giam and Stephen Davies for critical reading of the manuscript. This research was supported by a Kimmel Scholar Award from the Sidney Kimmel Society for Cancer Research (B.C.S.), a grant from the Dana Foundation Program in Brain and Immuno-imaging (B.C.S.), and an Exploratory Research Award from Uniformed Services University of the Health Sciences (B.C.S.).
This article was published online ahead of print in MBC in Press (http://www.molbiolcell.org/cgi/doi/10.1091/mbc.E05–10–0985) on February 22, 2006.
Abbreviations used: APC, antigen-presenting cell; CARD, caspase recruitment domain; FRET, fluorescence resonance energy transfer; IS, immunological synapse; mKO, monomeric Kusabira-Orange; PA-GFP, photo-activatable GFP; POLKADOTS, punctate oligomeric killing and activating domains transducing signals; ROI, region of interest; TCR, T-cell receptor.
The online version of this article contains supplemental material at MBC Online (http://www.molbiolcell.org).
References
- Bertin, J. et al. (2000). CARD9 is a novel caspase recruitment domain-containing protein that interacts with BCL10/CLAP and activates NF-kappa B. J. Biol. Chem. 275, 41082–41086. [DOI] [PubMed] [Google Scholar]
- Bertin, J., Wang, L., Guo, Y., Jacobson, M. D., Poyet, J. L., Srinivasula, S. M., Merriam, S., DiStefano, P. S., and Alnemri, E. S. (2001). CARD11 and CARD14 are novel caspase recruitment domain (CARD)/membrane-associated guanylate kinase (MAGUK) family members that interact with BCL10 and activate NF-kappa B. J. Biol. Chem. 276, 11877–11882. [DOI] [PubMed] [Google Scholar]
- Boothby, M. R., Mora, A. L., Scherer, D. C., Brockman, J. A., and Ballard, D. W. (1997). Perturbation of the T lymphocyte lineage in transgenic mice expressing a constitutive repressor of nuclear factor (NF)-kappaB. J. Exp. Med. 185, 1897–1907. [DOI] [PMC free article] [PubMed] [Google Scholar]
- Brossard, C., Feuillet, V., Schmitt, A., Randriamampita, C., Romao, M., Raposo, G., and Trautmann, A. (2005). Multifocal structure of the T cell–dendritic cell synapse. Eur. J. Immunol. 35, 1741–1753. [DOI] [PubMed] [Google Scholar]
- Bunnell, S. C., Hong, D. I., Kardon, J. R., Yamazaki, T., McGlade, C. J., Barr, V. A., and Samelson, L. E. (2002). T cell receptor ligation induces the formation of dynamically regulated signaling assemblies. J. Cell Biol. 158, 1263–1275. [DOI] [PMC free article] [PubMed] [Google Scholar]
- Campi, G., Varma, R., and Dustin, M. L. (2005). Actin and agonist MHC-peptide complex-dependent T cell receptor microclusters as scaffolds for signaling. J. Exp. Med. 202, 1031–1036. [DOI] [PMC free article] [PubMed] [Google Scholar]
- Che, T., You, Y., Wang, D., Tanner, M. J., Dixit, V. M., and Lin, X. (2004). MALT1/paracaspase is a signaling component downstream of CARMA1 and mediates T cell receptor-induced NF-kappaB activation. J. Biol. Chem. 279, 15870–15876. [DOI] [PubMed] [Google Scholar]
- Davis, M. M., Boniface, J. J., Reich, Z., Lyons, D., Hampl, J., Arden, B., and Chien, Y. (1998). Ligand recognition by alpha beta T cell receptors. Annu. Rev. Immunol. 16, 523–544. [DOI] [PubMed] [Google Scholar]
- Deng, L., Wang, C., Spencer, E., Yang, L., Braun, A., You, J., Slaughter, C., Pickart, C., and Chen, Z. J. (2000). Activation of the IkappaB kinase complex by TRAF6 requires a dimeric ubiquitin-conjugating enzyme complex and a unique polyubiquitin chain. Cell 103, 351–361. [DOI] [PubMed] [Google Scholar]
- Dittel, B. N., and Janeway, C. A., Jr. (2000). Differential sensitivity to mutations in a single peptide by two TCRs having identical beta-chains and closely related alpha-chains. J. Immunol. 165, 6334–6340. [DOI] [PubMed] [Google Scholar]
- Douglass, A. D., and Vale, R. D. (2005). Single-molecule microscopy reveals plasma membrane microdomains created by protein-protein networks that exclude or trap signaling molecules in T cells. Cell 121, 937–950. [DOI] [PMC free article] [PubMed] [Google Scholar]
- Gaide, O., Favier, B., Legler, D. F., Bonnet, D., Brissoni, B., Valitutti, S., Bron, C., Tschopp, J., and Thome, M. (2002). CARMA1 is a critical lipid raft-associated regulator of TCR-induced NF-kappa B activation. Nat. Immunol. 3, 836–843. [DOI] [PubMed] [Google Scholar]
- Ghosh, S., May, M. J., and Kopp, E. B. (1998). NF-kappa B and Rel proteins: evolutionarily conserved mediators of immune responses. Annu. Rev. Immunol. 16, 225–260. [DOI] [PubMed] [Google Scholar]
- Griesbeck, O., Baird, G. S., Campbell, R. E., Zacharias, D. A., and Tsien, R. Y. (2001). Reducing the environmental sensitivity of yellow fluorescent protein. Mechanism and applications. J. Biol. Chem. 276, 29188–29194. [DOI] [PubMed] [Google Scholar]
- Hara, H., Bakal, C., Wada, T., Bouchard, D., Rottapel, R., Saito, T., and Penninger, J. M. (2004). The molecular adapter Carma1 controls entry of IkappaB kinase into the central immune synapse. J. Exp. Med. 200, 1167–1177. [DOI] [PMC free article] [PubMed] [Google Scholar]
- Isakov, N., and Altman, A. (2002). PKC(theta) in T cell activation. Annu. Rev. Immunol. 20, 761–794. [DOI] [PubMed] [Google Scholar]
- Jacobelli, J., Andres, P. G., Boisvert, J., and Krummel, M. F. (2004). New views of the immunological synapse: variations in assembly and function. Curr. Opin. Immunol. 16, 345–352. [DOI] [PubMed] [Google Scholar]
- Karasawa, S., Araki, T., Nagai, T., Mizuno, H., and Miyawaki, A. (2004). Cyan-emitting and orange-emitting fluorescent proteins as a donor/acceptor pair for fluorescence resonance energy transfer. Biochem. J. 381, 307–312. [DOI] [PMC free article] [PubMed] [Google Scholar]
- Karin, M., and Ben-Neriah, Y. (2000). Phosphorylation meets ubiquitination: the control of NF-κB activity. Annu. Rev. Immunol. 18, 621–663. [DOI] [PubMed] [Google Scholar]
- Koseki, T., Inohara, N., Chen, S., Carrio, R., Merino, J., Hottiger, M. O., Nabel, G. J., and Nunez, G. (1999). CIPER, a novel NF kappaB-activating protein containing a caspase recruitment domain with homology to Herpesvirus-2 protein E10. J. Biol. Chem. 274, 9955–9961. [DOI] [PubMed] [Google Scholar]
- Lanzavecchia, A., and Sallusto, F. (2002). Progressive differentiation and selection of the fittest in the immune response. Nat. Rev. Immunol. 2, 982–987. [DOI] [PubMed] [Google Scholar]
- Lee, K. Y., D'Acquisto, F., Hayden, M. S., Shim, J. H., and Ghosh, S. (2005). PDK1 nucleates T cell receptor-induced signaling complex for NF-kappaB activation. Science 308, 114–118. [DOI] [PubMed] [Google Scholar]
- Lin, X., and Wang, D. (2004). The roles of CARMA1, Bcl10, and MALT1 in antigen receptor signaling. Semin. Immunol. 16, 429–435. [DOI] [PubMed] [Google Scholar]
- Lucas, P. C., Yonezumi, M., Inohara, N., McAllister-Lucas, L. M., Abazeed, M. E., Chen, F. F., Yamaoka, S., Seto, M., and Nunez, G. (2001). Bcl10 and MALT1, independent targets of chromosomal translocation in malt lymphoma, cooperate in a novel NF-kappa B signaling pathway. J. Biol. Chem. 276, 19012–19019. [DOI] [PubMed] [Google Scholar]
- McAllister-Lucas, L. M. et al. (2001). Bimp1, a MAGUK family member linking PKC activation to Bcl10-mediated NF-kappaB induction. J. Biol. Chem. 276, 30589–30597. [DOI] [PubMed] [Google Scholar]
- Monks, C. R., Kupfer, H., Tamir, I., Barlow, A., and Kupfer, A. (1997). Selective modulation of PKC-theta during T-cell activation. Nature 385, 83–86. [DOI] [PubMed] [Google Scholar]
- Nel, A. E. (2002). T-cell activation through the antigen receptor. Part 1, signaling components, signaling pathways, and signal integration at the T-cell antigen receptor synapse. J. Allergy Clin. Immunol. 109, 758–770. [DOI] [PubMed] [Google Scholar]
- Patterson, G. H., and Lippincott-Schwartz, J. (2002). A photoactivatable GFP for selective photolabeling of proteins and cells. Science 297, 1873–1877. [DOI] [PubMed] [Google Scholar]
- Rizzo, M. A., Springer, G. H., Granada, B., and Piston, D. W. (2004). An improved cyan fluorescent protein variant useful for FRET. Nat. Biotechnol. 22, 445–449. [DOI] [PubMed] [Google Scholar]
- Ruefli-Brasse, A. A., Lee, W. P., Hurst, S., and Dixit, V. M. (2004). Rip2 participates in Bcl10 signaling and T-cell receptor-mediated NF-kappaB activation. J. Biol. Chem. 279, 1570–1574. [DOI] [PubMed] [Google Scholar]
- Ruland, J. et al. (2001). Bcl10 is a positive regulator of antigen receptor-induced activation of NF-kappaB and neural tube closure. Cell 104, 33–42. [DOI] [PubMed] [Google Scholar]
- Schaefer, B. C., Kappler, J. W., Kupfer, A., and Marrack, P. (2004). Complex and dynamic redistribution of NF-{kappa}B signaling intermediates in response to T cell receptor stimulation. Proc. Natl. Acad. Sci. USA 101, 1004–1009. [DOI] [PMC free article] [PubMed] [Google Scholar]
- Schaefer, B. C., Mitchell, T. C., Kappler, J. W., and Marrack, P. (2001). A novel family of retroviral vectors for the rapid production of complex stable cell lines. Anal. Biochem. 297, 86–93. [DOI] [PubMed] [Google Scholar]
- Schaefer, B. C., Ware, M. F., Marrack, P., Fanger, G. R., Kappler, J. W., Johnson, G. L., and Monks, C. R. (1999). Live cell fluorescence imaging of T cell MEKK2, redistribution and activation in response to antigen stimulation of the T cell receptor. Immunity 11, 411–421. [DOI] [PubMed] [Google Scholar]
- Scharschmidt, E., Wegener, E., Heissmeyer, V., Rao, A., and Krappmann, D. (2004). Degradation of Bcl10 induced by T-cell activation negatively regulates NE-kappaB signaling. Mol. Cell. Biol. 24, 3860–3873. [DOI] [PMC free article] [PubMed] [Google Scholar]
- Sedwick, C. E., and Altman, A. (2004). Perspectives on PKCtheta in T cell activation. Mol. Immunol. 41, 675–686. [DOI] [PubMed] [Google Scholar]
- Siegel, R. M., Martin, D. A., Zheng, L., Ng, S. Y., Bertin, J., Cohen, J., and Lenardo, M. J. (1998). Death-effector filaments: novel cytoplasmic structures that recruit caspases and trigger apoptosis. J. Cell Biol. 141, 1243–1253. [DOI] [PMC free article] [PubMed] [Google Scholar]
- Sun, L., Deng, L., Ea, C. K., Xia, Z. P., and Chen, Z. J. (2004). The TRAF6 ubiquitin ligase and TAK1 kinase mediate IKK activation by BCL10 and MALT1 in T lymphocytes. Mol. Cell 14, 289–301. [DOI] [PubMed] [Google Scholar]
- Truong, K., and Ikura, M. (2001). The use of FRET imaging microscopy to detect protein-protein interactions and protein conformational changes in vivo. Curr. Opin. Struct. Biol. 11, 573–578. [DOI] [PubMed] [Google Scholar]
- Uren, A. G., O'Rourke, K., Aravind, L. A., Pisabarro, M. T., Seshagiri, S., Koonin, E.V., and Dixit, V. M. (2000). Identification of paracaspases and metacaspases: two ancient families of caspase-like proteins, one of which plays a key role in MALT lymphoma. Mol. Cell 6, 961–967. [DOI] [PubMed] [Google Scholar]
- Villalba, M., Coudronniere, N., Deckert, M., Teixeiro, E., Mas, P., and Altman, A. (2000). A novel functional interaction between Vav and PKCtheta is required for TCR-induced T cell activation. Immunity 12, 151–160. [DOI] [PubMed] [Google Scholar]
- Xia, Z., and Liu, Y. (2001). Reliable and global measurement of fluorescence resonance energy transfer using fluorescence microscopes. Biophys. J. 81, 2395–2402. [DOI] [PMC free article] [PubMed] [Google Scholar]
- Yokosuka, T., Sakata-Sogawa, K., Kobayashi, W., Hiroshima, M., Hashimoto-Tane, A., Tokunaga, M., Dustin, M. L., and Saito, T. (2005). Newly generated T cell receptor microclusters initiate and sustain T cell activation by recruitment of Zap70 and SLP-76. Nat. Immunol. 6, 1253–1262. [DOI] [PubMed] [Google Scholar]
- Zacharias, D. A., Violin, J. D., Newton, A. C., and Tsien, R. Y. (2002). Partitioning of lipid-modified monomeric GFPs into membrane microdomains of live cells. Science 296, 913–916. [DOI] [PubMed] [Google Scholar]
- Zhou, H., Wertz, I., O'Rourke, K., Ultsch, M., Seshagiri, S., Eby, M., Xiao, W., and Dixit, V. M. (2004). Bcl10 activates the NF-kappaB pathway through ubiquitination of NEMO. Nature 427, 167–171. [DOI] [PubMed] [Google Scholar]
Associated Data
This section collects any data citations, data availability statements, or supplementary materials included in this article.