

Abstract
Objectives. This study examined whether differences in heat alone, as opposed to public health interventions or other factors, accounted for the reduction in heat-related deaths and paramedic emergency medical service (EMS) runs between 1995 and 1999 during 2 heat waves occurring in Milwaukee, Wis.
Methods. Two previously described prediction models were adapted to compare expected and observed heat-related morbidity and mortality in 1999 based on the city's 1995 experience.
Results. Both models showed that heat-related deaths and EMS runs in 1999 were at least 49% lower than levels predicted by the 1995 relation between heat and heat-related deaths or EMS runs.
Conclusions. Reductions in heat-related morbidity and mortality in 1999 were not attributable to differences in heat levels alone. Changes in public health preparedness and response may also have contributed to these reductions.
From 1979 through 1997, an average of 371 Americans per year died from excessive heat, more than the number dying as a result of earthquakes, lightning, hurricanes, tornadoes, and floods combined.1 During heat waves, heat-related morbidity and mortality can increase dramatically.2–13 During a 1995 heat wave in the upper midwestern United States, an estimated 700 people died from heatrelated illness in Chicago, Ill, alone.9
In Milwaukee County, Wis, in 1995 and 1999, heat contributed to 91 and 11 deaths, respectively.7,14,15 In these same years, respectively, 95 and 28 heat-related paramedic emergency medical service (EMS) runs were made. In the present study, we sought to determine whether the reductions in heatrelated deaths and paramedic runs (heatrelated outcomes) in 1999 were the result of differences in heat levels alone. We used 2 different methods relating heat levels to heat-related outcomes to quantify the changes observed between 1995 and 1999.
METHODS
Data
Heat-related deaths were identified from death certificates on which the Milwaukee County medical examiner indicated excessive heat (International Classification of Diseases, 9th Revision, code E900) as an underlying or contributing cause of death.16 Paramedic EMS data were obtained from centralized Milwaukee County dispatch records. The hourly heat index was calculated from Milwaukee airport weather records. We used regional 1999 National Weather Service heat advisory criteria to define “heat wave” days: a 3-hour average heat index above 105°F (40.6°C) and a nighttime (7 pm–7 am) average heat index of 80°F (26.7°C). Population estimates and 1990 poverty data were obtained from the US Department of the Census, which defines poor and extremely poor areas as those with more than 20% and 40% of incomes below the poverty level, respectively.
Calculations of Outcomes
We used 2 methods to predict 1999 heat wave–associated outcomes based on 1995 events. The first (model 1), adapted from Ramlow and Kuller,8 calculated rates of deaths or EMS runs per degree of excessive heat during and after heat wave days. The sum of degrees above the National Weather Service heat advisory thresholds on each day of a heat wave was the denominator, while the numerator was number of heatrelated deaths or EMS runs on or within 10 days after heat wave days. Heat-related outcome events outside this time window were assumed to be unrelated to the heat wave. This model had the advantage of being independent of the exact lag between individual heat stress and illness or death, but assumes a linear relationship between the excess-heat index and health outcomes. We performed independent calculations with 3 different definitions of heat-wave threshold values and both outcome types (deaths and EMS runs; Table 1 ▶).
TABLE 1—
1999 Heat-Related Deaths and Emergency Medical Service (EMS) Runs vs 1995 for the 2 Prediction Models and by Different Heat Index Measures: Milwaukee, Wis
| Model 1 | |||
| Heat index threshold | Observeda | Expected | Observed to expected ratio (95% CI) |
| Deaths | |||
| Day average > 80°F (26.7°C) | 10 | 42.3 | 0.24 (0.13, 0.44) |
| Maximum 3-hour average > 105°F (40.6°C) | 10 | 50.6 | 0.20 (0.11, 0.37) |
| Night average > 80°F (26.7°C) | 10 | 26.7 | 0.37 (0.20, 0.70) |
| EMS runs | |||
| Day average > 80°F (26.7°C) | 10 | 30.9 | 0.32 (0.17, 0.60) |
| Maximum 3-hour average > 105°F (40.6°C) | 10 | 37.0 | 0.27 (0.15, 0.50) |
| Night average > 80°F (26.7°C) | 10 | 19.5 | 0.51 (0.28, 0.95) |
| Model 2 | |
| Heat index measure used for adjustment | Relative risk (95% CI) |
| Note. CI = confidence interval. | |
| aDuring the heat advisory days or within 10 days after. | |
| Deaths | |
| Previous day's maximum 3-hour average | 0.20 (0.06, 0.69) |
| Previous day's night average | 0.17 (0.03, 1.06) |
| Same day and previous 2 days' maximum 3-hour average and night average | 0.24 (0.06, 0.88) |
| EMS runs | |
| Previous day's maximum 3-hour average | 0.45 (0.23, 0.87) |
| Previous day's night average | 0.32 (0.12, 0.91) |
| Same day and previous 2 days' maximum 3-hour average and night average | 0.46 (0.27, 0.79) |
The second method (model 2) used the following equation for all summer days during 1995 and 1999: ln(Deaths or EMS Runs) = β1(Year) + β2(Heat Index Measure) + K, where β1 and β2 are parameter estimates, K is a constant, and “Year” is a dichotomous variable. The relative risk of a heat-related death or EMS run in 1999 as compared with 1995 was calculated from β1. Three heat index–time combinations were used in making calculations (Table 1 ▶). The advantage of this method was that it is based on evidence that the physiological effects of heat follow an exponential pattern17,18 and that heat stress best correlates with mortality 1 day after the index day.3,4,11,18 Similar models have effectively predicted observed deaths in several different years and cities.11,18,19
Statistical Analysis
Poisson statistics were used in all analyses. Relative risks were generated via the GENMOD procedure of SAS with a Poisson distribution and a log link function.20 Wald confidence intervals (CIs) were calculated and scaled via Pearson coefficients. Observed-to-expected ratios for heatrelated deaths were age adjusted to the 1999 Milwaukee County population.
RESULTS
Fewer heat-related deaths occurred in 1999 (11) than in 1995 (91) in Milwaukee County. In both 1995 and 1999, the majority of heat-related deaths occurred among individuals older than 65 years (rates were 67% and 73%, respectively), and the average ages were similar (1995: 70.1 ± 18.7, median = 76; 1999: 67.5 ± 14.5, median = 70). Slightly more decedents were male in both 1995 (57%) and 1999 (55%). More decedents were White in both years (1995: 76%; 1999: 91%), although rates per 100 000 were similar among White and Black decedents (1995: 10.7 and 9.5, respectively; 1999: 1.6 and 0.5, respectively). In 1999, fewer decedents lived in poor neighborhoods (27% vs 55%) and extremely poor neighborhoods (9% vs 33%), but these differences were not statistically significant.
Excessive heat, by definition, contributed to all heat-related deaths but was only the second leading underlying cause in both 1995 and 1999. The primary underlying cause in both years was cardiovascular disease (1995: 51%; 1999: 64%). Percentages of decedents taking psychotropic medication were similar for the 2 study years (1995: 16%; 1999: 18%). With the exception of 1 case (in 1995), all such decedents were younger than 65 years.
Model 1
July 13 and 14, 1995, were heat advisory days. The sum of heat-index degrees above 80°F (26.7°C) for these 2 days was 50.1 (Figure 1 ▶). There were 91 heat-related deaths within 10 days of the 1995 heat wave. Adjustment for the 1999 population yielded a predicted rate of 1.80 (90.3/50.1) heatrelated deaths per heat-index degree above 80°F. July 29 and 30, 1999, also were heat advisory days. The sum of excess heat-index degrees for these days was 23.5 (Figure 1 ▶). Applying the 1995 rate of 1.80 heat-related deaths per degree yielded 42.3 expected heat-related deaths, but only 10 heat-related deaths occurred within 10 days of the 1999 heat wave (Table 1 ▶). Similar calculations involving alternate excess heat thresholds during these heat waves also indicated reduced observed-to-expected ratios in 1999.
FIGURE 1—
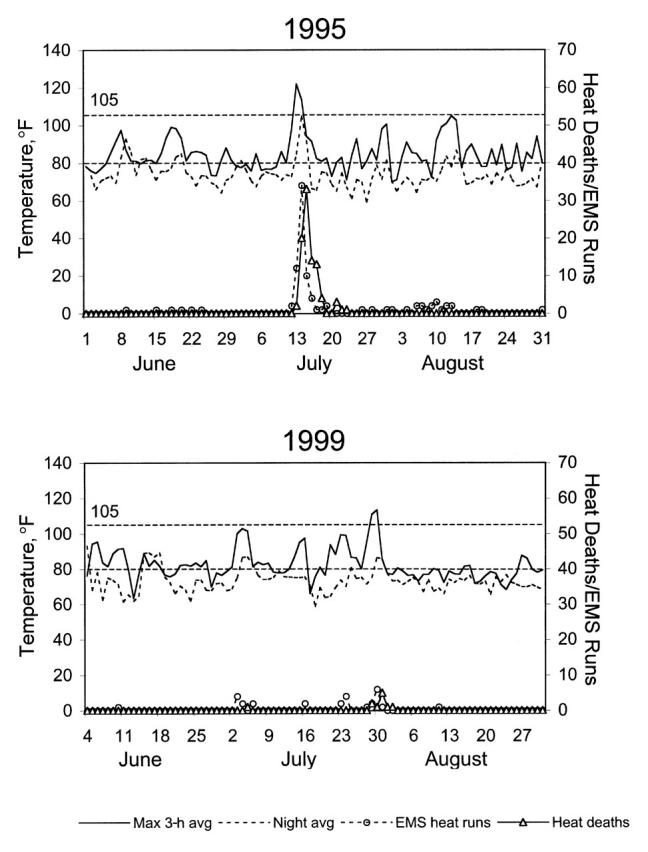
Summer daily heat-index measures, heat-related mortality, and heat-related emergency medical service (EMS) runs: Milwaukee, Wis, 1995 and 1999.
Heat-related EMS runs closely tracked heat deaths (Figure 1 ▶). Calculations based on 1995 and 1999 heat-related EMS runs also yielded statistically significant reductions in 1999 observed-to-expected ratios (Table 1 ▶). Reductions in observed-to-expected ratios for all excess heat thresholds and outcomes ranged from 49% to 76%, and all were statistically significant. Qualitatively similar results were obtained when the threshold was based on the average heat indices over the 14 or 30 days before the heat wave each year rather than on the National Weather Service thresholds.
Model 2
Poisson regression analyses showed reduced relative risks of both heat-related deaths (0.17 to 0.24) and EMS runs (0.32 to 0.46) in 1999 as compared with 1995 for all of the heat index–time combinations used in adjustments (Table 1 ▶). Except in the case of the model predicting heat-related death from the previous day's nighttime average heat index (95% CI = 0.03, 1.06), 95% confidence intervals for these relative risks excluded 1.
DISCUSSION
Our results were consistent across different prediction models, different definitions of excess heat, different time relationships, and 2 different heat-related health outcomes. Both heat-related deaths and EMS runs showed reductions in 1999 to between 17% and 51% of expected rates based on the 1995 relation between heat and heat-related deaths or EMS runs. We believe that these reductions were not the result of differences in heat levels alone.
Several aspects of the 1995 and 1999 Milwaukee heat waves were similar and thus not likely to explain the differences in heatrelated deaths and EMS runs. The heat advisory days each year occurred on a Thursday and Friday. The ages of decedents and other causes that contributed to death—factors associated with heat-related morbidity and mortality3,4,6,10,15,21—were similar. The percentages of decedents from poor and extremely poor neighborhoods were not statistically different between years, although both decreased in 1999, suggesting that public health efforts to target these vulnerable populations4,6,10,21 may have been effective.
The average heat index during the 2 weeks and 1 month before the heat waves differed by less than 1°F between 1995 and 1999. Heat indices fluctuated more widely before the 1999 than before the 1995 heat wave (Figure 1 ▶). However, physiological acclimatization can be acquired over the course of about a week and lost in a similar period if not maintained.22,23 Thus, the brief peaks (2–3 days) in heat indices followed by days of cooler temperatures in 1999 would have been unlikely to induce acclimatization. Furthermore, high-risk populations for heat wave–associated mortality—the elderly, people taking psychotropic medications, and people with chronic health conditions—acclimatize inefficiently.
The same medical examiner classified heat-related deaths in both years. If any variability occurred, its effect probably would have been to increase reporting in 1999 as a result of increased public awareness after the heat wave of 1995—a bias against our results. The same should hold true for EMS runs, given the centralized management. The major known differences between 1995 and 1999 included substantial improvements in the public health heat wave preparedness plan, decreased overnight heat indices in 1999 relative to 1995, and 2 lesser heat advisories that preceded the July 29–30, 1999, heat wave.
Milwaukee's extreme heat conditions plan (available at www.ci.mil.wi.us/citygov/health/heat) has been progressively refined since the 1995 heat wave. Improvements include designated multijurisdictional leadership (on the part of the Milwaukee Health Department); specific roles for more than 20 agencies; springtime preparation, communications tests, and public/professional education efforts; indexing of the plan to local National Weather Service advisory criteria; stepped responses appropriate to early forecasts; partner agency and mass media alerts via fax and e-mail; an emphasis on cooling measures other than air-conditioning; and a 24-hour hotline and active Internet-assisted heatinjury surveillance during advisories.
Differences in nighttime heat indices could have accounted for differences in heatrelated deaths between the study years, in that the confidence interval of a model based on nighttime heat indices included 1. High nighttime temperatures are dangerous2,4–6 and are the primary reason for the “urban heat island” effect.11,24 Although case–control studies have identified risk factors for heat-related morbidity and mortality, they have not focused specifically on nighttime risk factors.9,25,26 Public health prevention efforts may need to concentrate on nighttime heat even though night heat-index values are typically lower than daytime values. The 24-hour hotline established during heat alerts in Milwaukee typically receives peak call volumes after the suppertime and evening local news broadcasts, and this service helps to address nighttime heat concerns.
Before the National Weather Service heat advisory issued for July 29–30, 1999, 2 periods triggered advisories (July 3–4 and July 23–24), although the actual heat indices never actually reached the most severe advisory levels. In 1995, no earlier advisories were issued. These earlier advisories in 1999 may have improved the response to subsequent higher heat indices by either psychologically preparing the public or enhancing the effect of the Milwaukee extreme heat conditions plan through “practice runs.”
Although National Weather Service heat advisory criteria effectively predict when deaths are likely to occur, the success of prevention activities and messages may be compromised by too little advance warning. Lowering the threshold for issuing a heat advisory might be effective in reducing heat-related mortality during subsequent, more extreme heat waves. This possibility should be carefully weighed against the increased costs and the “crying wolf” effect of activating a full-blown extreme heat response plan more frequently. The Milwaukee extreme heat conditions plan includes a “heat outlook” provided by agencies serving at-risk populations. Such behind-the-scenes preparation could achieve the benefits of a reduced threshold while alleviating concerns regarding extra costs and public disregard if the full plan were activated at lower thresholds.
Acknowledgments
We thank the following individuals for their assistance in the conduct of this study: Rusty Kapella, warning coordination meteorologist, National Weather Service, Milwaukee/Sullivan, Wis; Lauryl Pukansky, RHIA, health information manager, Milwaukee County EMS; and Lyle Anderson, manager of the Wisconsin climatologist's office.
M. G. Weisskopf was the lead investigator and had a principal role in all phases of the study. H. A. Anderson, S. Foldy, and P. D. Rumm participated in the design and conception of the work as well as data interpretation. L. P. Hanrahan participated in the data analysis and interpretation. K. Blair participated in data collection and interpretation. T. J. Török and S. Foldy participated in the writing.
Peer Reviewed
References
- 1.Mortality Computer Tapes for the Years 1979–1997. Hyattsville, Md: National Center for Health Statistics; 1997.
- 2.Bridger CA, Ellis FP, Taylor HL. Mortality in St Louis, Missouri, during heat waves in 1936, 1953, 1954, 1955, and 1966. Environ Res. 1976;12:38–48. [DOI] [PubMed] [Google Scholar]
- 3.Ellis FP. Mortality from heat illness and heataggravated illness in the United States. Environ Res. 1972;5:1–58. [DOI] [PubMed] [Google Scholar]
- 4.Ellis FP, Nelson F, Pincus L. Mortality during heat waves in New York City, July, 1972 and August and September, 1973. Environ Res. 1975;10:1–13. [DOI] [PubMed] [Google Scholar]
- 5.Greenberg JH, Bromberg J, Reed CM, Gustafson TL, Beauchamp RA. The epidemiology of heat-related deaths, Texas—1950, 1970–79, and 1980. Am J Public Health. 1983;73:805–807. [DOI] [PMC free article] [PubMed] [Google Scholar]
- 6.Kilbourne EM. The Public Health Consequences of Disasters. Atlanta, Ga: Centers for Disease Control and Prevention; 1989.
- 7.Knobeloch L, Anderson H, Morgan J, Nashold R. Heat-related illness and death, Wisconsin, 1995. Wis Med J. 1997;96(5):33–38. [PubMed] [Google Scholar]
- 8.Ramlow JM, Kuller LH. Effects of the summer heat wave of 1988 on daily mortality in Allegheny County, PA. Public Health Rep. 1990;105:283–289. [PMC free article] [PubMed] [Google Scholar]
- 9.Semenza JC, Rubin CH, Falter KH, et al. Heatrelated deaths during the July 1995 heat wave in Chicago. N Engl J Med. 1996;335:84–90. [DOI] [PubMed] [Google Scholar]
- 10.Jones TS, Liang AP, Kilbourne EM, et al. Morbidity and mortality associated with the July 1980 heat wave in St Louis and Kansas City, Mo. JAMA .1982;247:3327–3331. [PubMed] [Google Scholar]
- 11.Oechsli FW, Buechley RW. Excess mortality associated with three Los Angeles September hot spells. Environ Res. 1970;3:277–284. [DOI] [PubMed] [Google Scholar]
- 12.Whitman S, Good G, Donoghue ER, Benbow N, Shou W, Mou S. Mortality in Chicago attributed to the July 1995 heat wave. Am J Public Health 1997;87:1515–1518. [DOI] [PMC free article] [PubMed] [Google Scholar]
- 13.Semenza JC, McCullough JE, Flanders WD, McGeehin MA, Lumpkin JR. Excess hospital admissions during the July 1995 heat wave in Chicago. Am J Prev Med. 1999;16:269–277. [DOI] [PubMed] [Google Scholar]
- 14.Rajpal RC, Weisskopf MG, Rumm PD, et al. Wisconsin, July 1999 heat wave: an epidemiologic assessment. Wis Med J. 2000;99(5):41–44. [PubMed] [Google Scholar]
- 15.Nashold RD, Jentzen JM, Peterson PL, Remington PL. Heat-related deaths during the summer of 1995, Wisconsin. Wis Med J. 1996;95(6):382–383. [PubMed] [Google Scholar]
- 16.Donoghue ER, Graham MA, Jentzen JM, Lifschultz BD, Luke JL, Mirchandani HG. Criteria for the diagnosis of heat-related deaths: National Association of Medical Examiners. Am J Forensic Med Pathol. 1997;18:11–14. [DOI] [PubMed] [Google Scholar]
- 17.Lind AR. Physiological effects of continuous or intermittent work in the heat. Appl Physiol. 1963;18:57–60. [DOI] [PubMed] [Google Scholar]
- 18.Marmor M. Heat wave mortality in New York City, 1949 to 1970. Arch Environ Health .1975;30:130–136. [DOI] [PubMed] [Google Scholar]
- 19.Buechley RW, Van Bruggen J, Truppi LE. Heat island equals death island? Environ Res. 1972;5:85–92. [DOI] [PubMed] [Google Scholar]
- 20.SAS/STAT User's Guide, Version 8. Cary, NC: SAS Institute Inc; 1999.
- 21.Schuman SH. Patterns of urban heat-wave deaths and implications for prevention: data from New York and St Louis during July, 1966. Environ Res. 1972;5:59–75. [DOI] [PubMed] [Google Scholar]
- 22.Delaney KA, Goldfrank LR. Hot and cold work environments. In: Rom WN, ed. Environmental and Occupational Medicine. Boston, Mass: Little Brown & Co; 1992:1153–1164.
- 23.Wenger CB. Human heat acclimatization. In: Pandolf KB, Sawka MN, Gonzalez RR, eds. Human Performance Physiology and Environmental Medicine at Terrestrial Extremes. Carmel, Ind: Cooper Publishing Group; 1986:153–198.
- 24.Clarke JF. Some effects of the urban structure on heat mortality. Environ Res. 1972;5:93–104. [DOI] [PubMed] [Google Scholar]
- 25.Kilbourne EM, Choi K, Jones TS, Thacker SB. Risk factors for heatstroke. A case–control study. JAMA 1982;247:3332–3336. [PubMed] [Google Scholar]
- 26.Naughton MP, Kaiser R, Henderson A, et al. The hot zone revisited—Chicago, Illinois, 1999. Paper presented at: Epidemic Intelligence Service Conference, April 2000, Atlanta, Ga.