

Abstract
Objectives. This study examined the association between a residential area's socioeconomic status (SES), race, and advanced-stage breast cancer in New York City.
Methods. The cross-sectional study design used breast cancer information for 37 921 cases diagnosed in New York City from 1986 to 1995. Residential education and income levels were based on the 1990 census and ascribed to each case by zip code. Associations between race, area SES, and advanced-stage breast cancer stage, and the interaction between race and SES, were evaluated in bivariate and multivariate analyses.
Results. After adjusting for age and year at diagnosis, living in areas with lower levels of education and income increased the odds of presenting with advanced-stage breast cancer by 50% for Black women and by 75% for White women. No significant qualitative interaction was present between area SES and race.
Conclusions. This study confirmed independent racial and socioeconomic differences in the risk of advanced-stage breast cancer in a large and diverse population. The results emphasize the need to improve screening practices and clinical treatment in both high-risk populations and high-risk geographic areas.
Breast cancer is the second leading cause of cancer death among women, with cancer deaths in 1999 estimated at 43 300.1 Although evidence supports several risk factors for breast cancer, these factors do not have consistent effects on all groups of women2–4 and do not fully explain the high frequency of breast cancer in women.1,5–7 Considering the limited availability of primary preventive measures, detecting breast cancer at an early stage in the disease pathway is an effective way to reduce morbidity and prevent mortality associated with breast cancer.5,8–10 To improve early detection, it is essential to identify risk factors associated with advanced stages of the disease, which result in higher breast cancer mortality rates.
Breast cancer mortality trends differ in Black and White populations in the United States. Overall, White women have higher breast cancer incidence rates than do Black women; however, Black women with breast cancer have lower survival rates than do their White counterparts.9,11–14
Much of the racial difference in survival has been explained in terms of stage distribution, with Black women being diagnosed at more advanced stages.9,12,15–19 According to several studies, Black women consistently develop larger primary tumors, experience a higher rate of spread to axillary lymph nodes, and have more distant metastatic disease than do White women.9 This is consistent with other findings that stage is a strong indicator of prognosis.15,20 Five-year survival rates for female breast cancer in the United States from 1989 to 1996 declined from 96% for localized tumors to 77% for regional cancers and to 21% for tumors with distant metastases.1
Evidence indicates that lower socioeconomic status (SES) is associated with higher rates of disease or death.21–25 Studies have found that people with lower SES are more likely to be given diagnoses of breast cancer at an advanced stage.17,26 Given the strong association between SES and race,27,28 SES may explain the racial differences in advanced breast cancer. Studies that have examined this possibility, however, found that only part of the racial difference in breast cancer mortality and stage distribution is a result of socioeconomic differences.9,12,15,29
The persistence of racial differences after SES is accounted for may be due to an interactive effect of race and SES. Several researchers have shown the importance of examining the interactive effects of race and SES on different health outcomes.25,28,30 Disparate effects may be a result of the social elements of racism. Positive effects of being at a high socioeconomic level can be less pronounced in the Black community.31 For example, Black individuals often receive lower economic return than White individuals for attaining the same education. Another study showed that racial differences in psychologic distress were more pronounced at lower socioeconomic levels.30 Thus, at different socioeconomic levels, racial differences may be more or less pronounced or may differ in varying degrees.
Two studies considered the interaction of SES with race with regard to breast cancer stage.12,32 Lannin et al.12 found no statistically significant effect modification between race and SES on predicting breast cancer stage. The study, however, was limited to a relatively small, nonurban population in eastern North Carolina. Wells and Horm32 stratified cases from 1978 to 1982 by race/ethncity and SES indicators (income and education) and found that greater Black–White differences in advanced stages were present in the lower strata. Although the study was population based, the data may not reflect the full effect of mammography use, which peaked in the late 1980s.33,34
We conducted a study of breast cancer cases in New York City from 1986 to 1995 to examine the associations between area SES, race, and advanced-stage breast cancer and to determine whether an interaction exists between the effects of a residential area's SES and race on advanced-stage breast cancer.
METHODS
Study Design
The design was a cross-sectional study of women diagnosed with in situ or invasive breast cancer (International Classification of Diseases, 9th Revision, codes 174 and 2330) and reported to the New York State Cancer Registry in New York City from 1986 to 1995. State law, extended to New York City in 1973, requires the reporting of all residents's cancer cases within 6 months of diagnosis.35 Most cases are reported by hospitals, and some are reported by laboratories, physicians, or ambulatory care centers.35 New York State estimates find cancer reporting to be 95% complete (P. Wolfgang, New York State Cancer Registry, written communication, May 2000).
To be eligible for our analysis, individuals had to be younger than 80 years and to have race reported as “Black” or “White.” We excluded patients living in 7 zip code areas (10018, 10031, 10032, 10033, 10034, 10040, 10452) with incomplete reporting of stage and race to the Cancer Registry (15% of the breast cancer cases were coded as unstaged or of unknown race) and in 1 zip code area (11371) with no census information.
Registry Data
As classified in other studies,15,17,18,27,32,36 stage categories from the Cancer Registry were collapsed into the following categories: in situ, local (tumor restricted to breast tissue), regional (tumor with direct extension to adjacent tissue or direct extension to lymph nodes), distant (metastasized to distant tissue or lymph nodes), and unknown (unstaged).37 The race variable was directly obtained from the Cancer Registry.
We examined the independent and potentially confounding effects of age and year at diagnosis. Younger women (often categorized as younger than 40 years) have lower survival rates and higher rates of advanced-stage disease compared with older women.3,18,38,39 Moreover, certain years may have yielded more favorable stage distributions for different racial groups. Age was coded in the Cancer Registry as a continuous variable, and we collapsed it into 5 categories: <40, 40 to 49, 50 to 59, 60 to 69, and 70 to 79. Year at diagnosis was coded as such in the Cancer Registry.
Census Data
This study measured the effects of a geographic area's SES rather than individual SES levels. Area SES variables were based on the 1990 census and obtained from the Geolytics, Inc. CD-ROM.40 Area socioeconomic indicators for income and education were ascribed to each case in the Cancer Registry based on zip code (available for each case). Various studies examining SES found that income and education are the most appropriate measures of SES.15,17,23,27,30,32,41 In this study, median household income42 quintiles were used to create 5 income categories: Q1 (<$22 380), Q2 ($22 380–$29 249), Q3 ($29 250–$34 189), Q4 ($34 190–$41 729), and Q5 (≥$41 730). Educational attainment was based on the percentage of individuals who were at least high school graduates.42 This variable was collapsed into 5 categories based on quintiles of the distribution: Q1 (<59.7), Q2 (59.7–67.4), Q3 (67.5–73.5), Q4 (73.6–81.0), and Q5 (≥81.1).
Statistical Analysis
Descriptive statistics were used to observe the distribution of characteristics by race and stage of disease. The χ2 test was used to determine statistical significance for each covariate.
In bivariate analyses, odds ratios (ORs) were obtained with logistic regression for each variable's effect on advanced-stage disease. Advanced stage was defined as distant stage rather than local or regional stages to examine the most extreme outcome, the stage with the most severe prognosis. In situ stage was not considered in these analyses because of some controversy as to its potential progression to invasive carcinoma,43 and consequently it is often treated separately when examining breast cancer stages.27,33,36 Moreover, the office of the New York State Cancer Registry claims that in situ cases are probably underreported (P. Wolfgang, New York State Cancer Registry, e-mail communication, September 18, 2000). Cases with unknown stage also were excluded. We considered the interaction of race and area SES by stratifying the association between stage distribution and area SES by race. For these analyses, only 3 levels of stage were used (excluding in situ and unknown cases).
To ascertain which area socioeconomic indicator was a stronger predictor of advanced stage, a separate variable was used that combines income and education information. This variable contained 9 categories that were composed of combinations of income and education levels (based on tertiles of each variable). The crude odds ratios for each of these categories and their effects on advanced stage were determined based on logistic regression analysis.
Multivariate analysis was used to examine the independent effects of race and community SES on advanced-stage breast cancer. These logistic regression models did not include in situ and unknown stages of breast cancer. Separate models for each race were compared; 1 set used the same education quintiles, and the other used race-specific quintiles. The race-specific quintiles were as follows: Blacks, Q1 (<52.0), Q2 (52.0–59.8), Q3 (59.9–67.4), Q4 (67.5–72.0), and Q5 (≥72.1); and Whites, Q1 (<62.5), Q2 (62.5–70.7), Q3 (70.8–76.1), Q4 (76.2–83.3), and Q5 (≥83.4). The models were compared by race to determine whether the risk of advanced-stage disease in lower area socioeconomic levels differs by race. Models including both races and an interaction term for race and education were considered as well. We also constructed models redefining advanced-stage disease as regional and distant stages combined. SPSS, Version 7.0 (SPSS Inc, Chicago, Ill), was used for all the analyses.
RESULTS
Characteristics of the Population
In total, 37 921 of the 48 142 women with diagnosed in situ or invasive breast cancer in New York City from 1986 to 1995 met our eligibility criteria. Table 1 ▶ shows selected characteristics of the patients with breast cancer. Age distribution was distinctive in each racial group. Black patients tended to present at younger ages compared with White patients.
TABLE 1.
—Characteristics of 37 921 Cases of Diagnosed Female Breast Cancer, by Race, 1986–1995
| Blacka | Whitea | |||
| n | %* | n | %* | |
| Cancer stage | ||||
| In situ | 534 | 6.4 | 2319 | 7.9 |
| Local | 3360 | 40.0 | 14 490 | 49.1 |
| Regional | 2513 | 29.9 | 7106 | 24.1 |
| Distant | 1120 | 13.3 | 3046 | 10.3 |
| Unknown | 864 | 10.3 | 2569 | 8.7 |
| Age at diagnosis, y | ||||
| <39 | 778 | 11.1 | 1555 | 6.3 |
| 40–49 | 1559 | 22.3 | 3999 | 16.2 |
| 50–59 | 1818 | 26.0 | 5111 | 20.7 |
| 60–69 | 1725 | 24.7 | 7117 | 28.9 |
| 70–79 | 1113 | 15.9 | 6860 | 27.8 |
| Education | ||||
| Low: Q1 (52.0)b | 2436 | 34.8 | 2624 | 10.6 |
| Q2 (62.8) | 1403 | 20.1 | 4695 | 19.1 |
| Q3 (70.9) | 1806 | 25.8 | 5336 | 21.7 |
| Q4 (77.1) | 1152 | 16.5 | 5626 | 22.8 |
| High: Q5 (89.7) | 196 | 2.8 | 6361 | 25.8 |
| Income, $ | ||||
| Low: Q1 (17 378)b | 3060 | 43.8 | 2754 | 11.2 |
| Q2 (26 528) | 1163 | 16.6 | 4591 | 18.6 |
| Q3 (31 230) | 1327 | 19.0 | 5789 | 23.5 |
| Q4 (37 251) | 903 | 12.9 | 5208 | 21.1 |
| High: Q5 (46 937) | 540 | 7.7 | 6300 | 25.6 |
an = 24 642 for White cases and n = 6993 for Black cases, except for “stage” variable, for which in situ and unknown stages are shown as well.
bNumbers indicate median values for each education and income quintile.
*χ2 tests for associations between each characteristic and race yielded P < .001.
Stage distributions differed by race as well. White patients had greater percentages of in situ and local stages of disease. Black patients, however, presented with higher percentages of regional, distant, and unknown stages.
Area SES was associated with race; both education and income levels showed similar trends. Black patients were more likely than White patients to live in areas with low income and low education levels.
An association between area SES and stage was observed (data not shown). With ascending income and education levels, the percentages of local and in situ cancers increased. The percentages of regional stage were less consistent, however, showing an overall slight decrease with ascending area SES levels. Finally, percentages of distant and unknown stages decreased steadily with greater levels of community income and education.
The analysis comparing area SES indicators showed that although the community education and income variables were highly correlated (Spearman rank correlation = 0.88, P < .001), education seemed the stronger factor when observing the association between area SES and advanced-stage disease. Within each education level, risk slightly decreased with increasing income tertiles. However, a greater decrease in risk occurred with increasing education levels. Thus, education was chosen as the area socioeconomic indicator for the remaining analyses.
Bivariate Association of Population Characteristics With Advanced-Stage Breast Cancer
Odds ratios of distant-stage disease vs local or regional stage, by race, community education, and year, indicated mostly statistically significant risks (except for age). The relative odds of advanced-stage disease associated with Black race compared with White race was 1.35 (95% confidence interval [CI] = 1.26, 1.46). The relative odds of advanced-stage presentation was 84% greater for individuals living in the lowest education quintile compared with the highest quintile (OR = 1.84; 95% CI = 1.65, 2.06) and decreased steadily with ascending quintiles.
Finally, potential interactions between community SES and race were initially explored by stratifying the associations between the 3 stages of interest (excluding in situ and unknown stages) and area SES, by race (Figure 1 ▶). Among the Black patients, an overall downward trend was seen (with the exception of the highest quintile) with regard to distant-stage disease and increasing levels of community education. The White patients had a similar, but stronger, trend (P for trend, Blacks = .015, Whites < .001).
FIGURE 1.
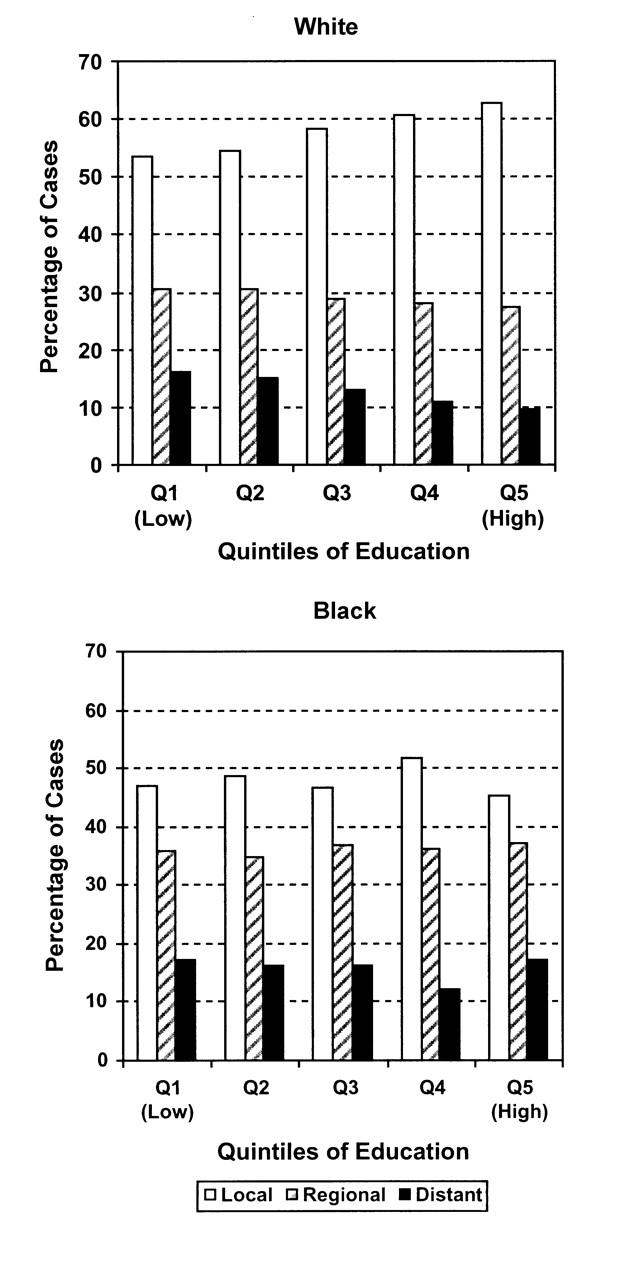
—Distribution of breast cancer stages, by community-level education quintiles, for White and Black individuals.
Multivariate Association of SES With Advanced-Stage Breast Cancer
Table 2 ▶ shows a separate logistic regression model for each race. These models included 31 635 cases (6993 Blacks and 24 642 Whites). The model for White cases showed a strong independent risk of advanced-stage disease associated with decreasing levels of community education, adjusted for age and year at diagnosis. Among Black cases, however, most associations were not statistically significant, and the effects of community education on advanced stage were greatly reduced or eliminated, if not reversed, for some levels. Because of the few Black cases in the highest education quintile, we examined another set of models that used the lowest education level as the reference (data not shown). In these models, the results were similar, with increasing protective effects found with increasing community education levels among White patients and little or no socioeconomic effect among Black patients. The interaction term for race and education was just barely statistically significant when both races were included in 1 model, with education as a continuous variable (P = .05). These models suggest that an interaction does exist between race and area SES, with area SES affecting White, but not Black, women.
TABLE 2.
—Association of Area Socioeconomic Status and Advanced-Stage Breast Cancer
| Multiple logistic regression models using the same quintiles of educationa | ||
| Education quintile | Black (n = 6993) OR (95% CI) | White (n = 24 642) OR (95% CI) |
| Low: Q1 | 1.01 (0.68, 1.48) | 1.82 (1.59, 2.08) |
| Q2 | 0.93 (0.63, 1.39) | 1.61 (1.44, 1.81) |
| Q3 | 0.96 (0.65, 1.42) | 1.36 (1.21, 1.53) |
| Q4 | 0.67 (0.44, 1.01) | 1.14 (1.02, 1.29) |
| High: Q5 | 1.00 (reference) | 1.00 (reference) |
| P for trendb | .006 | <.001 |
| Multiple logistic regression models using race-specific quintiles of educationa | ||||
| Education quintile | Black (n = 6993) OR (95% CI) | White (n = 24 642) OR (95% CI) | ||
| Note. OR = odds ratio; CI = confidence interval. | ||||
| aAll models were adjusted for age at diagnosis and year at diagnosis. | ||||
| bP values were obtained by including the covariate in the model as an ordinal variable. | ||||
| cNumbers indicate median values for each race-specific education and income quintile. | ||||
| Low: Q1 | (47.8)c | 1.50 (1.22, 1.85) | (55.2)c | 1.75 (1.55, 1.98) |
| Q2 | (54.6) | 1.38 (1.12, 1.70) | (67.2) | 1.48 (1.31, 1.67) |
| Q3 | (62.0) | 1.31 (1.06, 1.61) | (72.2) | 1.28 (1.13, 1.45) |
| Q4 | (69.7) | 1.44 (1.18, 1.76) | (78.7) | 1.01 (0.88, 1.15) |
| High: Q5 | (76.7) | 1.00 (reference) | (90.0) | 1.00 (reference) |
| P for trendb | .001 | <.001 | ||
Another set of models was calculated with race-specific quintiles to account for the distribution differences with regard to education level between Blacks and Whites (Table 2 ▶). The odds ratios indicated significant risks associated with low community education levels and advanced stage. Among Black patients, the odds of presenting with distant-stage breast cancer was 50% greater among people living in the lowest education quintile compared with the highest, and among White patients, the risk was 75% greater. Although the overall trends were similar in both races, the risks were slightly greater among White patients, and the gradient was clearer. No significant interaction appeared to be present between area SES and race. The results of the initial models presented in Table 2 ▶ seem to have been a consequence of using education categories that were based on the entire population (consisting mostly of White patients) and not particularly relevant to the Black patients.
With regard to the association of calendar year at diagnosis and risk of advanced-stage disease among Black patients, the relative odds of presenting with advanced-stage breast cancer showed no changing association with each advancing calendar year. Among White patients, however, each advancing calendar year was associated with a steadily decreasing risk of advanced-stage cancer (P for trend < .001).
These analyses were repeated with new outcomes combining regional and distant stage as advanced stage. The results were similar, but the new models produced weaker odds ratios. Models that used the same education quintiles found a 50% greater risk for those living at the lowest community education level among Whites (OR = 1.49; 95% CI = 1.36, 1.64) and almost no risk, or even a slightly protective effect (nonsignificant), among Blacks (OR = 0.93; 95% CI = 0.69, 1.25). The models that used race-specific quintiles found a 55% greater risk among Whites at the lowest community education level (OR = 1.55; 95% CI = 1.43, 1.69) and a 20% greater risk among Blacks (OR = 1.20; 95% CI = 1.03, 1.39), with the risks decreasing for both race groups with increasing community education levels.
DISCUSSION
This study, which used a large cancer registry for New York City, confirmed racial differences in the risk of advanced-stage breast cancer and an association between area SES and advanced-stage disease in both Black and White women. The data indicate that this latter trend—specifically, the association between community educational attainment and advanced-stage breast cancer—is similar among Black and White women.
Race is an arbitrary division of “visual class,” a social categorization that was historically used to segregate and exploit various groups of people28,44; scientific evidence has shown that race is not a valid biological category.28,45 Because the aim of this study was to examine racial differences with regard to advanced-stage breast disease, it is important to examine the underlying social factors that may explain these differences.
A strong social factor, or group of factors, is included in the term SES. Rather than investigate these factors on an individual level, this study “contextualized” the disease by examining the social framework that might affect this relation with health.24 The literature suggests that neighborhood or community socioeconomic characteristics may have important roles in affecting a person's health, independent of that person's individual SES.20,22,25,46–55 The premise is that neighborhood units may capture much of the SES as well as cultural and social issues affecting individual health in a given community.50 For example, poor education, high crime levels, poor housing quality, limited access to information and resources, and other structural restraints are characteristics of a poor community,24,54 and these factors can be crucial when measuring health inequality in society.
The effects of area SES on advanced-stage breast cancer appeared in both Black and White populations in this analysis. The absence of an effect among Blacks when the same education quintiles were used is most likely a result of the uneven distribution of Black cases within those quintiles that were constructed based on a majority of White individuals. It is thus often difficult to directly compare Black and White populations because of the significantly smaller proportion of Black patients. Use of racespecific education quintiles showed similar effects of area SES in both racial groups. Although no qualitative interaction (effect in a different direction) was present, the risks were slightly greater and the gradient stronger among White patients. This distinction may be a result of the slightly smaller ranges of education categories that were created based on the Black population.
New York City provides an ideal diverse urban population to examine area SES and race association with advanced-stage breast cancer. First, it has numerous cases. Second, a greater percentage of African American females live in New York City, compared with the rest of the United States (30% of the total female population and 12%, respectively).40 The tendency toward late-stage disease is also particularly great among African American women living in New York City, compared with the rest of New York State56; racial differences in stage distribution also may be greater in New York City.18
The recent data used in this study are important with regard to population screening. Although other studies examining stage distribution have shown a consistent trend with regard to Black women presenting at more advanced stages of the disease, the past 15 years showed a trend of diagnoses at earlier stages.9 It has been suggested that this is because of an increase in mammography use among Black women. Whereas much of the literature examines trends in previous years, mostly between the 1960s and 1980s,16,17,27,29,36,48,57 recent data are needed to inform policy.
Despite the study's strengths, some of its limitations deserve comment. First, reporting problems involving individuals at lower area socioeconomic levels may exist. The highest proportions of cancers with unknown stage were reported among patients living in areas with lower education and income levels. That the highest percentages of Black cases were found in those same lower socioeconomic levels may have biased the results of the analysis and could have led to an underestimation of the area SES effect in Blacks. Moreover, the 7 zip code areas with incomplete reporting that were excluded from the analyses were mostly low-SES areas and contained a high proportion of Black women (35%, compared with 22% in the sample analyzed). The analyses were, however, repeated including the cases from the 7 zip codes, and the results were unchanged.
Another potential reporting problem relates to varying hospital practices. Hospitals throughout New York City vary with regard to methods of record abstraction; some hospitals employ a certified tumor registrar, but in others, health information management staff abstract the information.35 Until 1995, some hospitals sent electronic reports, and others used paper forms.35 Varying procedures may have thus led to some misclassification error. A differential misclassification would occur, however, only if racial distributions differed by hospital. Hospitals in New York City differ in the racial distribution of their patients. Of the “voluntary-distressed” and public hospitals in New York City, 86% hospitalize a majority of Black patients, whereas 77% of the private and voluntary hospitals hospitalize a majority of White patients. (Data were obtained by personal written communication with the New York City Health and Hospital Corporation, Office of Corporate Planning and HIV Services, on April 7, 1999. The information is based on SPARCS data from the New York State Department of Health. The analysis reported does not include Jacobi Medical Center, because Jacobi does not delineate race in its reporting to the SPARCS bureau).
Second, the variables used in the analyses may not have accurately or sufficiently described the associations hypothesized in this study. Specifically, the categories describing racial groups may be problematic. The US Census Bureau claims that most Hispanic individuals are included in the “White” race category,58 but it is not clear to what extent that applies in New York City. The Hispanic cases could have caused a bias in the analysis, because the literature suggests that Hispanic women experience increased breast cancer mortality and more rapidly increasing mortality rates than do non-Hispanic White women59,60 and that Hispanic women receive screening less frequently than do nonHispanic women in general.34 If most Hispanic patients were included in the White category, then the stage distribution differences between Black and White cases may have been diluted. Furthermore, census undercount is greater for African Americans than for Whites28 and may have led to an underrepresentation of the Black population.
Group-level socioeconomic variables traditionally have been associated with methodological problems. Many researchers have addressed the issue of ecologic fallacy in this regard,50–53 and some have proposed that to suggest appropriate interventions at a community level, it is important to rely on community-level assessments to determine need and efficacy.20,49,51,53 The group-level variables that represent socioeconomic levels of an area may be, however, confounded by individual-level information. That is, a low-SES area may confer risk because the individuals that happen to be living in that area have had little education or have low income levels and not because of the area effects.54 Because we were unable to obtain individual-level education or income information for each cancer case, this information can potentially confound the group-level socioeconomic variables used in the analysis.
This study has implications regarding health policy that involve implementing and promoting screening practices shown to advance early breast cancer detection and improve survival rates.5,8–10,61,62 Racial and SES differences in screening practices exist and may explain our results. Studies show that Black women are less likely than White women to be screened or to present with asymptomatic disease.10,63–66 In this study, proportions of local and in situ cases, often increasing as a result of increased mammography use,67–69 were lowest among Black patients. Moreover, the multivariate analyses showed decreasing risk of advanced-stage diagnosis with time only among White patients, suggesting that the Black population has not experienced the same increase in mammography use as the White population.
This study also found that women living in low-SES areas present with lower proportions of in situ and local cancers and greater proportions of advanced-stage cancer. Economically disadvantaged areas have been found to use mammography screening less than wealthier areas9,32,70 for a variety of practical and cultural reasons and should be targets for future intervention. More research must be done, however, to ascertain whether these differences can be attributed to mammography use or mammography effectiveness.
In summary, this study found that decreasing community SES is a significant predictor of advanced-stage breast cancer, regardless of race, age, and year at diagnosis. The area socioeconomic risk factors are not all directly related to income or educational levels and can manifest themselves in other ways. These potential manifestations include health care access, use, and treatment53,71–73 and daily behaviors such as dietary habits15 that can lead to obesity, which has been shown to be a potential risk factor for advanced-stage disease.74 A complex integration of all these factors appears to influence health.25,59,74
These results, and those of other studies, have shown that racial differences in advanced-stage disease persist as well, regardless of SES9,12,14,15,29,57 or other factors such as patient and system treatment delay and health care access.59,64,75 However, these differences can be partially explained by socially mediated factors,6 such as cultural systems and values,12 social networks,45 and racial discrimination and segregation.28
To effectively close the racial and socioeconomic gap with regard to advanced-stage breast cancer and other cancers with similar racial disparities in morbidity,76 a variety of socioeconomic and racial issues must be addressed to improve screening practices and clinical treatment and, eventually, lower breast cancer mortality rates in these high-risk groups.
Acknowledgments
We would like to acknowledge the New York State Cancer Registry for providing the data. We also would like to thank Pat Wolfgang at the New York State Cancer Registry for reviewing the manuscript, Margrit Kaminsky at the New York City Department of Health for her assistance in obtaining and organizing the data, and Drs Ana Diez-Roux, Kathy Helzlsouer, and Susan Wilt for helpful comments on earlier versions of the paper.
S. S. Merkin planned and designed the study, analyzed the data, and wrote the paper. L. Stevenson helped organize the data, participated in data analysis, and reviewed various drafts of the paper. N. Powe assisted with study design, contributed to and supervised data analysis, and contributed to the writing of the paper.
Peer Reviewed
References
- 1.American Cancer Society. Cancer Facts and Figures, 1999–2000. New York, NY: American Cancer Society; 2000.
- 2.McCredie MRE, Dite GS, Giles GG, Hopper JL. Breast cancer in Australian women under the age of 40. Cancer Causes Control. 1998;9:189–198. [DOI] [PubMed] [Google Scholar]
- 3.Swanson GM, Lin CS. Survival patterns among younger women with breast cancer: the effects of age, race, stage, and treatment. J Natl Cancer Inst Monogr. 1994;16:69–77. [PubMed] [Google Scholar]
- 4.Velentgas P, Daling JR. Risk factors for breast cancer in younger women. J Natl Cancer Inst Monogr. 1994;16:15–22. [PubMed] [Google Scholar]
- 5.Broeders MJM, Verbeek ALM. Breast cancer epidemiology and risk factors. Q J Nucl Med. 1997;41:179–188. [PubMed] [Google Scholar]
- 6.Krieger N. Exposure, susceptibility, and breast cancer risk: a hypothesis regarding exogenous carcinogens, breast tissue development, and social gradients, including black/white differences in breast cancer incidence. Breast Cancer Res Treat. 1989;13:205–223. [DOI] [PubMed] [Google Scholar]
- 7.Seidman H, Stellman SD, Mushinski MH. A different perspective on breast cancer risk factors: some implications of the nonattributable risk. CA Cancer J Clin. 1982;32:301–313. [DOI] [PubMed] [Google Scholar]
- 8.Public Health Service. Public health focus: mammography. MMWR Morb Mortal Wkly Rep. 1992;41:454–459. [PubMed] [Google Scholar]
- 9.Moormeier J. Breast cancer in black women. Ann Intern Med. 1996;124:897–905. [DOI] [PubMed] [Google Scholar]
- 10.McCarthy AP, Burns RB, Coughlin SS, et al. Mammography use helps to explain differences in breast cancer stage at diagnosis between older black and white women. Ann Intern Med. 1998;128:729–736. [DOI] [PubMed] [Google Scholar]
- 11.Ries LAG, Kosary CL, Hankey BF, Miller BA, Edwards BK, eds. Surveillance, Epidemiology and End Results (SEER) Cancer Statistics Review 1973–1995. Bethesda, Md: National Cancer Institute; 1996.
- 12.Lannin DR, Mathews HF, Mitchell J, Swanson MS, Swanson FH, Edwards MS. Influence of socioeconomic and cultural factors on racial differences in late-stage presentation of breast cancer. JAMA. 1998;279:1801–1807. [DOI] [PubMed] [Google Scholar]
- 13.Public Health Service. Breast cancer incidence and mortality, United States, 1992. MMWR Morb Mortal Wkly Rep. 1996;45:833–837. [PubMed] [Google Scholar]
- 14.Newman LA, Alfonso AE. Age-related differences in breast cancer stage at diagnosis between black and white patients in an urban community hospital. J Surg Oncol. 1997;4:655–662. [DOI] [PubMed] [Google Scholar]
- 15.Simon MS, Severson RK. Racial differences in breast cancer survival: the interaction of socioeconomic status and tumor biology. Am J Obstet Gynecol. 1997;176:S233–S239. [DOI] [PubMed] [Google Scholar]
- 16.Eley JW, Hill HA, Chen VW, et al. Racial differences in survival from breast cancer. JAMA. 1994;272:947–954. [DOI] [PubMed] [Google Scholar]
- 17.Farley TA, Flannery JT. Late-stage diagnosis of breast cancer in women of lower socioeconomic status: public health implications. Am J Public Health. 1989;79:1508–1512. [DOI] [PMC free article] [PubMed] [Google Scholar]
- 18.Polednak AP. Breast cancer in black and white women in New York State: case distribution and incidence rates by clinical stage at diagnosis. Cancer. 1986;58:807–815. [DOI] [PubMed] [Google Scholar]
- 19.Davis DL, Axelrod D, Osborne M, Telang N, Bradlow HL, Sittner E. Avoidable causes of breast cancer: the known, unknown, and the suspected. Ann N Y Acad Sci. 1997;883:112–128. [DOI] [PubMed] [Google Scholar]
- 20.Andres TL, Baron AE, Wright RA, Marine WM. Tracking community sentinel events: breast cancer mortality and neighborhood risk for advanced-stage tumors in Denver. Am J Public Health. 1996;86:717–722. [DOI] [PMC free article] [PubMed] [Google Scholar]
- 21.Lynch J, Kaplan GA, Salonen R, Cohen RD, Salonen JT. Socioeconomic status and carotid atherosclerosis. Circulation. 1995;92:1786–1792. [DOI] [PubMed] [Google Scholar]
- 22.Haan M, Kaplan GA, Camacho T. Poverty and health: prospective evidence from the Alameda County Study. Am J Epidemiol. 1987;125:989–998. [DOI] [PubMed] [Google Scholar]
- 23.Gordon NH, Crowe JP, Brumberg J, Berger NA. Socioeconomic factors and race in breast cancer recurrence and survival. Am J Epidemiol. 1992;135:609–618. [DOI] [PubMed] [Google Scholar]
- 24.Link B, Phelan J. Social conditions as fundamental causes of disease. J Health Soc Behav. 1995;Spec No:80–94. [PubMed]
- 25.Haan MN, Kaplan GA, Syme SL. Socioeconomic status and health: old observations and new thoughts. In: Bunker JP, Gomby DS, Kehrer BH, eds. Pathways to Health: The Role of Social Factors. Menlo Park, Calif: The Henry J. Kaiser Foundation; 1989:76–117.
- 26.Cohart EM. Socioeconomic distribution of cancer of the female sex organs in New Haven. Cancer. 1955;8:34–41. [DOI] [PubMed] [Google Scholar]
- 27.Dayal HH, Power RN, Chiu C. Race and socio-economic status in survival from breast cancer. J Chronic Dis. 1982;35:675–683. [DOI] [PubMed] [Google Scholar]
- 28.Williams DR. Race/ethnicity and socioeconomic status: measurement and methodological issues. Int J Health Serv. 1996;26:483–505. [DOI] [PubMed] [Google Scholar]
- 29.Perkins P, Cooksley CD, Cox JD. Breast cancer: is ethnicity an independent prognostic factor for survival? Cancer. 1996;78:1241–1247. [DOI] [PubMed] [Google Scholar]
- 30.Kessler RC, Neighbors HW. A new perspective on the relationships among race, social class, and psychological distress. J Health Soc Behav. 1986;27:107–115. [PubMed] [Google Scholar]
- 31.Pettigrew TF. Race and class in the 1980s: an interactive view. Daedalus. 1981;110:233–255. [Google Scholar]
- 32.Wells BL, Horm JW. Stage at diagnosis in breast cancer: race and socioeconomic factors. Am J Public Health. 1992;82:1383–1385. [DOI] [PMC free article] [PubMed] [Google Scholar]
- 33.Wun LM, Feuer EJ, Miller BA. Are increases in mammographic screening still a valid explanation for trends in breast cancer incidence in the United States? Cancer Causes Control. 1995;6:135–144. [DOI] [PubMed] [Google Scholar]
- 34.Anderson LM, May DS. Has the use of cervical, breast and colorectal cancer screening increased in the United States? Am J Public Health. 1995;85:840–842. [DOI] [PMC free article] [PubMed] [Google Scholar]
- 35.Cancer Incidence and Mortality in New York State. Vol 1. New York: New York State Cancer Registry, New York State Department of Health; May 1998.
- 36.Satariano WA, Belle SH, Swanson GM. The severity of breast cancer at diagnosis: a comparison of age and extent of disease in black and white women. Am J Public Health. 1986;76:779–782. [DOI] [PMC free article] [PubMed] [Google Scholar]
- 37.The New York State Cancer Registry Operations Manual. New York: New York State Department of Health; 1998.
- 38.Chung M, Chang HR, Bland KI, Wanebo HJ. Younger women with breast carcinoma have a poorer prognosis than older women. Cancer. 1996;77:97–103. [DOI] [PubMed] [Google Scholar]
- 39.Albain KS, Allred C, Clark GM. Breast cancer outcome and predictors of outcome: are there age differentials? J Natl Cancer Inst Monogr. 1994;16:35–42. [PubMed] [Google Scholar]
- 40.1990 CensusCD, Version 1.1. East Brunswick, NJ: Geolytics Inc; 1996.
- 41.Devesa S, Diamond EL. Association of breast cancer and cervical cancer incidences with income and education among whites and blacks. J Natl Cancer Inst. 1980;65:515–520. [PubMed] [Google Scholar]
- 42.US Bureau of the Census. Appendix B: definitions of subject characteristics: population characteristics. Available at: http://www.census.gov/td/stf3/append_b.html#POP. Accessed October 5, 2001.
- 43.Bauer TW. Breast pathology and prognosis. In: Grundfest-Broniatowski S, Esselstyn CB, eds. Controversies in Breast Disease: Diagnosis and Management. New York, NY: Marcel Dekker; 1988:124–149.
- 44.Fullilove MT. Comment: abandoning “race” as a variable in public health research—an idea whose time has come. Am J Public Health. 1998;88:1297–1298. [DOI] [PMC free article] [PubMed] [Google Scholar]
- 45.Liu ET. The uncoupling of race and cancer genetics. Cancer. 1998;83(suppl):1765–1769. [Google Scholar]
- 46.Kaplan GA. People and places: contrasting perspectives on the association between social class and health. Int J Health Serv. 1996;26:507–519. [DOI] [PubMed] [Google Scholar]
- 47.O'Campo P, Xue X, Wang MC, Caughy MO. Neighborhood risk factors for low birthweight in Baltimore: a multilevel analysis. Am J Public Health. 1997;87:1113–1118. [DOI] [PMC free article] [PubMed] [Google Scholar]
- 48.Wells BL, Horm JW. Targeting the underserved for breast and cervical cancer screening: the utility of ecological analysis using the National Health Interview Survey. Am J Public Health. 1998;88:1484–1489. [DOI] [PMC free article] [PubMed] [Google Scholar]
- 49.Feinleib M. A new twist in ecological studies. Am J Public Health. 1998;88:1445–1446. [DOI] [PMC free article] [PubMed] [Google Scholar]
- 50.Diez-Roux AV. Bringing context back into epidemiology. Am J Public Health. 1998;88:216–222. [DOI] [PMC free article] [PubMed] [Google Scholar]
- 51.Schwartz S. The fallacy of the ecological fallacy: the potential misuse of a concept and the consequences. Am J Public Health. 1994;84:819–824. [DOI] [PMC free article] [PubMed] [Google Scholar]
- 52.Susser M. The logic in ecological, I: the logic of analysis. Am J Public Health. 1994;84:825–829. [DOI] [PMC free article] [PubMed] [Google Scholar]
- 53.Susser M. The logic in ecological, II: the logic of design. Am J Public Health. 1994;84:830–835. [DOI] [PMC free article] [PubMed] [Google Scholar]
- 54.Jargowsky PA. Poverty and Place: Ghettos, Barrios and the American City. New York, NY: Russel Sage Foundation; 1997.
- 55.Kaplan GA, Pamuk ER, Lynch JW, Cohen RD, Balfour JL. Inequality in income and mortality in the United States: analysis of mortality and potential pathways. BMJ. 1996;312:999–1003. [DOI] [PMC free article] [PubMed] [Google Scholar]
- 56.Cancer Data Profile. New York: New York State Department of Health; 1990.
- 57.Bain RP, Greenberg RS, Whitaker JP. Racial differences in survival of women with breast cancer. J Chronic Dis. 1986;39:631–642. [DOI] [PubMed] [Google Scholar]
- 58.US Bureau of the Census. Estimates of the population of counties by age, sex, and race/Hispanic origin: 1990–1997. Available at: http://www.census.gov/population/estimates/rho.txt. Accessed October 5, 2001.
- 59.Vernon SW, Tilley BC, Neale AV, Steinfeldt L. Ethnicity, survival, and delay in seeking treatment for symptoms of breast cancer. Cancer. 1985;55:1563–1571. [DOI] [PubMed] [Google Scholar]
- 60.Gilliland FD, Hunt WC, Baumgartner KB, et al. Reproductive risk factors for breast cancer in Hispanic and non-Hispanic white women: the New Mexico Women's Health Study. Am J Epidemiol. 1998;148:683–692. [DOI] [PubMed] [Google Scholar]
- 61.Taplin SH, Mandelson MT, Anderman C, et al. Mammography diffusion and trends in late-stage breast cancer: evaluating outcomes in a population. Cancer Epidemiol Biomarkers Prev. 1997;6:625–631. [PubMed] [Google Scholar]
- 62.Wingo PA, Ries LAG, Rosenberg HM, Miller DS, Edwards BK. Cancer incidence and mortality 1973–1995. Cancer. 1998;82:1197–1207. [DOI] [PubMed] [Google Scholar]
- 63.Lee JRJ, Vogel VG. Who uses screening mammography regularly? Cancer Epidemiol Biomarkers Prev. 1995;4:901–906. [PubMed] [Google Scholar]
- 64.Caplan LS, Helzlsouer KJ, Shapiro S, Freedman LS, Coates RJ, Edwards BK. System delay in breast cancer in whites and blacks. Am J Epidemiol. 1995;142:804–810. [DOI] [PubMed] [Google Scholar]
- 65.Taylor VM, Thompson B, Montano DE, Mahloch J, Johnson K, Li S. Mammography use among women attending an inner-city clinic. J Cancer Educ. 1998;13:96–101. [DOI] [PubMed] [Google Scholar]
- 66.Burns RS, McCarthy EP, Freund KP, et al. Black women receive less mammography even with similar use of primary care. Ann Intern Med. 1996;125:173–182. [DOI] [PubMed] [Google Scholar]
- 67.Day NE. Quantitative approaches to the evaluation of screening programs. World J Surg. 1989;13:3–8. [DOI] [PubMed] [Google Scholar]
- 68.Schnitt SJ, Silen W, Sadowsky NL, Connolly JL, Harris JR. Ductal carcinoma in situ (intraductal carcinoma of the breast). N Engl J Med. 1988;318:898–903. [DOI] [PubMed] [Google Scholar]
- 69.Eraster VL. Epidemiology and natural history of ductal carcinoma in situ. In: Silverstein MJ, ed. Ductal Carcinoma In Situ of the Breast. Baltimore, Md: Williams & Wilkins; 1997:23–33.
- 70.Link BG, Northridge ME, Phelan JC, Ganz ML. Social epidemiology and the fundamental cause concept: on the structuring of effective cancer screens by socioeconomic status. Milbank Q. 1998;76:375–401. [DOI] [PMC free article] [PubMed] [Google Scholar]
- 71.Sterling T, Rosenbaum W, Weinkam J. Income, race and mortality. J Natl Med Assoc. 1993;85:906–911. [PMC free article] [PubMed] [Google Scholar]
- 72.Freeman H. Race, poverty, and cancer. J Natl Cancer Inst. 1991;83:526–527. [DOI] [PubMed] [Google Scholar]
- 73.Simon MS, Severson RK. Racial differences in survival of female breast cancer in the Detroit metropolitan area. Cancer. 1996;77:308–314. [DOI] [PubMed] [Google Scholar]
- 74.Jones BA, Kasl SV, Curnen MGM, Owens PH, Dubrow R. Severe obesity as an explanatory factor for the black/white difference in stage at diagnosis of breast cancer. Am J Epidemiol. 1997;146:394–404. [DOI] [PubMed] [Google Scholar]
- 75.Wojcik BE, Spinks MK, Optenberg SA. Breast carcinoma survival analysis for African-American and white women in an equal-access health care system. Cancer. 1998;82:1310–1318. [DOI] [PubMed] [Google Scholar]
- 76.Madison T, Schottenfeld D, Baker V. Cancer of the corpus uteri in white and black women in Michigan, 1985–1994. Cancer. 1998;83:1546–1554. [DOI] [PubMed] [Google Scholar]