Abstract
Chromatic adaptation (CA) in cyanobacteria has provided a model system for the study of the environmental control of photophysiology for several decades. All forms of CA that have been examined so far (types II and III) involve changes in the relative contents of phycoerythrin (PE) and/or phycocyanin when cells are shifted from red to green light and vice versa. However, the chromophore compositions of these polypeptides are not altered. Some marine Synechococcus species strains, which possess two PE forms (PEI and PEII), carry out another type of CA (type IV), occurring during shifts from blue to green or white light. Two chromatically adapting strains of marine Synechococcus recently isolated from the Gulf of Mexico were utilized to elucidate the mechanism of type IV CA. During this process, no change in the relative contents of PEI and PEII was observed. Instead, the ratio of the two chromophores bound to PEII, phycourobilin and phycoerythrobilin, is high under blue light and low under white light. Mass spectroscopy analyses of isolated PEII α- and β-subunits show that there is a single PEII protein type under all light climates. The CA process seems to specifically affect the chromophorylation of the PEII (and possibly PEI) α chain. We propose a likely process for type IV CA, which involves the enzymatic activity of one or several phycobilin lyases and/or lyase-isomerases differentially controlled by the ambient light quality. Phylogenetic analyses based on the 16S rRNA gene confirm that type IV CA is not limited to a single clade of marine Synechococcus.
Members of the genus Synechococcus are ubiquitous and ecologically important in marine ecosystems (19, 24, 28). This form genus, which includes freshwater, obligatory marine, and halotolerant strains, is clearly polyphyletic. However, based on 16S rRNA gene sequence analysis, most obligatory marine representatives fall into a single monophyletic group called “subcluster 5.1,” previously termed “marine cluster A” (8, 14). Like most other cyanobacteria, all members of Synechococcus subcluster 5.1 (hereinafter referred to as “marine Synechococcus”) utilize phycobilisomes (PBSs) as their major light-harvesting antenna system. PBSs are large macromolecular complexes that consist of a core in direct contact with the stromal surface of the thylakoid membrane, and this core is surrounded by six radiating rods. The major constituents of PBSs are several classes of chromophore-binding proteins called phycobiliproteins (PBPs). In all PBS-containing cyanobacteria, the PBP components of the core and proximal parts of the rods are allophycocyanin (AP) and phycocyanin (PC), respectively. The PBP components constituting the distal parts of rods are more varied. All marine Synechococcus sp. strains but those belonging to clades VI and VIII (8) are thought to possess two different phycoerythrin (PE) forms, termed PEI and PEII. The latter is specific to this cyanobacterial group and is located at a distal position within the rods. Each PBP binds one or two types of chromophores (phycobilins) via covalent thioether bonds to cysteinyl residues. In marine Synechococcus species strains, the blue chromophore phycocyanobilin (PCB; wavelength of maximal absorbance [Aλmax], ∼620 nm) is bound to AP and PC, the red chromophore phycoerythrobilin (PEB; Aλmax, ∼550 nm) to PC and to both PEs, and the orange chromophore phycourobilin (PUB; Aλmax, ∼495 nm) either to PEII only or to both PEI and PEII (25, 26, 33). More specifically, in the strains examined to date, PEI contains five attachment sites binding PUB and/or PEB chromophores at a PUB/PEB ratio of either 0:5 or 2:3, whereas PEII contains six chromophore attachment sites and binds PUB and PEB at a PUB/PEB ratio of 2:4 or 4:2, depending on the strain (9, 25).
Whole-cell fluorescence excitation spectra with emission at the chlorophyll emission peak (680 nm) show that only wavelengths absorbed by the PBSs, and mostly by the PE-associated chromophores PUB and PEB, are photosynthetically active in photosystem II (44, 46). This suggests that there is a strong selective pressure on the absorption properties of these PBPs to match wavelengths of light available in the marine environment. The wavelengths of maximal transmittance of light in blue, oligotrophic waters (∼475 nm) (17) and green, mesotrophic waters (525 to 550 nm) (17) are close to the wavelengths of maximal absorption for PUB and PEB chromophores, respectively. Thus, the predominance of PEs with high PUB/PEB ratios in oligotrophic waters and PEs with no or low PUB in mesotrophic waters has been proposed to reflect adaptation to differences in the spectral composition of the natural light field (4, 24, 45, 47). The whole-cell PUB/PEB ratio, which is frequently assessed as the in vivo ratio of the PUB fluorescence excitation maximum of PE emission to that of PEB (ExPUB/ExPEB), differs tremendously (from ca. 0.4 up to 2.3) over a range of PE-containing marine Synechococcus strains and naturally occurring PEs in bulk seawater (8). However, in most marine Synechococcus strains studied to date, this ratio appears fairly constant within a given strain, regardless of the growth light spectral quality (1, 32, 46). Recently, several strains of marine Synechococcus that are capable of chromatic adaptation (CA) were described (27). These strains adjust their ExPUB/ExPEB ratios in response to changing light quality, increasing these ratios from about 0.8 when grown in white or green light to about 1.6 in blue light and vice versa.
CA has been extensively studied in cyanobacteria that do not belong to marine Synechococcus subcluster 5.1. In these strains, CA occurs when cells are shifted from red to green light or vice versa and involves changes in the amounts of different PBPs whose individual chromophore compositions always remain the same (11, 37). Two major mechanisms of CA, referred to as type II and type III (the latter is also called complementary chromatic adaptation), have been described previously (36). In type II CA, as occurs in Synechocystis sp. strain PCC 6701 (2), PC synthesis is not affected by a shift from red to green light fields, but the amount of PE relative to that of PC may change dramatically. The organisms performing type III CA, such as Fremyella diplosiphon, have at least two types of PC (5, 21). One of them (PC1) is constitutive and is always located at the bases of the PBS rods. A shift from green to red light induces strong inverse variation in the synthesis rates of PE and of another, inducible form of PC, called PC2. At the genetic level, type III CA rests on variation in the transcription levels of the cpeBA and cpcB2A2 operons, which code for the α- and β-subunits of PE and PC2, respectively, as well as of the genes encoding the corresponding linker polypeptides (for a review, see, e.g., reference 10).
In contrast, the biological mechanisms involved in the specific type of chromatic adaptation occurring in marine Synechococcus (type IV CA) have remained unknown. By analogy with type II or III CA, type IV CA in marine Synechococcus could involve a modulation of the PEI/PEII ratio, either through changes in the synthesis of just one PBP relative to the others (analogous to type II CA but involving changes in PEII relative to PEI instead of PE relative to PC) or through changes in the relative synthesis rates of two PBPs in different light fields (analogous to type III CA but involving PEI and PEII instead of PE and PC2). Alternatively, the ratio of PEI/PEII could remain the same in blue and green (or white) light, and the observed shift to higher PUB/PEB ratios in blue light could reflect a change in the chromophorylation state of the α- and/or β-subunits of one or both of these PBPs.
Here, we test these hypotheses on two chromatically adapting strains of marine Synechococcus species recently isolated from the Gulf of Mexico. We examine the variation of the optical properties of isolated PEI and PEII complexes and subunits in response to spectral light quality and determine the phylogenetic positions of the strains within the 5.1 cluster of marine Synechococcus. We conclude by proposing a novel mechanism for CA in cyanobacteria.
MATERIALS AND METHODS
Isolation and maintenance of strains used in this study.
The two chromatically adapting marine Synechococcus species strains used in this study (M16.17 and M11.1) have been deposited at the University of Oregon Culture Collection of Microorganisms from Extreme Environments (http://cultures.uoregon.edu) and the Roscoff Culture Collection (http://www.sb-roscoff.fr/Phyto/RCC/index.php). These strains were isolated from water collected on 9 February 2003 at 275 m in the Gulf of Mexico (27°43′N, 91°15′W) with a 10-liter Niskin bottle, using the conductivity-temperature-depth rosette of the R/V Seward Johnson. A 50-ml aliquot of the water sample was enriched with nutrients to f/50 levels and with Si omitted (12) and incubated under low white light at 24°C in a 50-ml polypropylene centrifuge tube (Corning, Corning, NY). Upon visible growth of the enrichment, an aliquot was transferred to sterile seawater (prefiltered with a 0.2-μm filter), and spiked with f/2 lacking Si (f/2−Si) stock solutions in a 50-mm Pyrex (Corning, Corning, NY) culture tube. f/2−Si medium containing 0.3% (wt/vol) washed Difco Bacto agar was then used to plate strains (3, 41). Individual colonies were picked from these plates and rendered clonal, but not axenic, by two rounds of growth in f/2−Si liquid medium followed by replating and picking of colonies. Each purified strain conformed to the description of the form genus Synechococcus (14) based on light microscopic analysis of size, gross morphology, and division pattern. All isolates were routinely maintained in f/2−Si at 24°C and with 25 μmol photons · m−2 · s−1 cool white light under a 14-h-light-10-h-dark cycle. However, for the kinetics and biochemical studies reported here, the isolates were grown in seawater-based PCR-S11 medium (29) supplemented with 5 mM NaNO3 under 10 μmol photons m−2 s−1 continuous white light, provided by Sylvania daylight 58W/154 fluorescent tubes, or colored light obtained by wrapping the cultures with colored filter sheets (either no. 183 for blue or no. 139 for green; Lee Filters, Andover, England).
DNA isolation, amplification, and sequencing.
For each strain identified as a chromatic adapter, cells were harvested by centrifugation of 25 to 50 ml of culture at 27,000 × g for 15 min. Genomic DNA was purified using the Chelex 100 method (6) with 15% (wt/wt) Chelex 100 in sterile, nanopure water. The resulting DNA solutions were stored at −20°C until used for PCR.
All PCR amplifications were processed in a final volume of 50 μl, with 2.5 μl dimethyl sulfoxide, a 5-μl mixture of deoxynucleoside triphosphates at 6.6 mM, 5 μl of incubation mixture with MgCl2 (Q-Biogen, Carlsbad, CA), 0.3 μl of each primer at 50 mM, 0.3 μl of Q-BioTaq (Q-Biogen), 2 μl of template DNA solution, and 34.6 μl sterile, nanopure water. A fragment of the 16S rRNA gene was amplified using the primers CYA106F, CYA359F, CYA783R (23), and PLG2.3 (22). PCR conditions for 16S rRNA gene amplifications were the following: an initial denaturation step of 94°C for 3 min, followed by 35 cycles of 94°C for 1 min, 60°C for 1 min, and 72°C for 1 min, with one final 5-min elongation step at 72°C.
An aliquot of 5 μl of each PCR product was sampled to verify the successful amplification of the appropriate amplicon using gel electrophoresis with a 100-base-pair-ladder molecular weight marker (Amersham Biosciences, Piscataway, NJ) on a 1.5% agarose gel stained with ethidium bromide. PCR products were then purified on a 1.5% agarose gel using a QIAquick gel extraction kit (QIAGEN, Valencia, CA). Purified PCR products were directly sequenced in both directions using the original PCR primers and internal primers with a CEQ sequencer (Beckman-Coulter, Fullerton, CA) at the sequencing facility of the University of Oregon (Eugene).
Nucleotide sequence editing, alignment, and phylogenetic reconstruction.
Sequence data were assembled and edited using BioEdit Sequence Alignment Editor v. 5.0.9 (13). An alignment of the assembled 16S rRNA gene nucleotide sequences was obtained and visually verified using CLUSTALX (38), with default settings used for gap penalties. The alignment was made with 33 taxa, including representatives of all 10 clades of marine Synechococcus subcluster 5.1 (sensu Fuller et al.; see reference 8) and subcluster 5.2 (14) as well as of the closely related genera Prochlorococcus and Cyanobium. For all subsequent phylogenetic analyses, Synechococcus sp. strain PCC 7002 was used as the outgroup. Gapped and ambiguous positions were excluded, and missing data were coded as missing.
A neighbor-joining topology was generated using PAUP (Sinauer Associates, Sunderland, MA) with Jukes-Cantor correction. The neighbor-joining analysis was bootstrap pseudoreplicated 1,000 times. A maximum parsimony analysis was performed with PAUP using a heuristic search with the tree-bisection-reconnection branch-swapping algorithm, with starting trees obtained by stepwise addition and 1,000 replications of random sequence addition. This analysis was bootstrap pseudoreplicated 1,000 times. Bayesian analysis was computed with MrBayes v3.0B4 (15). The general-time-reversible model (30) with gamma distribution and proportion of invariable sites was used, with default priors set for the model parameters. Four Metropolis-coupled Markov chain Monte Carlo chains (one cold) of 5 × 10⁶ generations were run, with trees sampled every 100 generations. Of these 5,000 sample trees, 2,000 were discarded as burn-in. Posterior probabilities were determined from a majority rule consensus tree calculated from the remaining 3,000 trees.
Kinetics of chromatic adaptation.
Triplicate sets of Synechococcus species strains M16.17 and M11.1 cultures were maintained independently under continuous white or blue light at photon fluxes of 10 μmol photons m−2 s−1. Each set was first acclimated for at least 20 generations (i.e., 3 weeks) to its respective light environment and kept in exponential growth by daily dilutions of media (45). For kinetics studies, an aliquot of each culture was sampled at time zero, and the ratio of fluorescence excitation maxima of PUB and PEB (Ex495 nm/Ex545 nm) was measured using a Perkin Elmer LS-50B spectrofluorometer as previously described (32). Cultures were then moved to the novel light environment (from white to blue light and vice versa), and measurements were made every 12 h until the Ex495 nm/Ex545 nm ratio was stabilized at the new value.
Growth rate and flow cytometric parameters.
Growth rates (μ) were assessed on long-term acclimated cultures, while cytometric parameters were followed upon a light shift from blue to white light and conversely. The procedure was the same as that described by Six and coworkers (32). Flow cytometry samples were fixed in 0.2% glutaraldehyde (grade II; Sigma) and stored at −80°C until analysis. Cell concentrations were determined in triplicates using a FACSort flow cytometer (Becton Dickinson, San Jose, CA) after appropriate dilution in 0.2-μm-filtered seawater. Data were collected as list mode files and analyzed using the Cytowin 4.1 software (40; the software is available at http://www.sb-roscoff.fr/Phyto/index.php?option=com_docman&task=cat_view&gid=118&Itemid=112). Growth rates (day−1) were computed as the slope of the ln(Nt) versus the time plot, where Nt is the cell number at time t. Changes in forward-angle light scatter (FALS) and orange fluorescence (585 ± 21 nm) upon light shift were determined in duplicates. All data were normalized with 0.95-μm calibrated YG beads (Polysciences, Warrington, PA).
Liposoluble-pigment analyses.
The chlorophyll and carotenoid contents of Synechococcus species strains M16.17 and M11.1 cells were assessed by high-performance liquid chromatography (HPLC) with the separation method as described by Six and coworkers (34). Briefly, a 30-ml aliquot of culture was filtered on a GF/F filter (Whatman, Florham Park, NJ) and submitted to methanolic extraction at −20°C in dark. The extract was then cleared of filter debris and injected into an HP1100 HPLC system (Agilent Technologies, Palo Alto, CA). Pigments were identified according to their retention times and absorbance properties compared to those of reference pigments (16).
Biochemical analysis of intact phycobilisomes.
Extraction of intact PBSs was carried out with 0.75 M phosphate buffer on a sucrose gradient by the classical procedure (33). Purified PBSs were characterized by their absorption spectra using a double-wavelength DW2 spectrophotometer (Aminco Chance, Bogart, GA). PBSs were then precipitated by 10% trichloroacetate, denatured, and loaded on the basis of equal PCB quantities (i.e., similar optical density at 640 nm) on a 10-to-20% acrylamide, continuous-gradient lithium dodecyl sulfate (LiDS)-polyacrylamide gel electrophoresis (PAGE) gel as previously described (33). The chromophorylation state of linker polypeptides was visualized under UV excitation after soaking the gel in 20 mM zinc acetate and by Coomassie blue staining.
Biochemical analysis of isolated phycobiliprotein complexes.
The procedure for PBS dissociation and purification of PBPs on isoelectric focusing (IEF) mini-gels was as previously described (33), except that the soluble proteins were suspended in 10 mM phosphate buffer instead of TES [N-tris(hydroxymethyl)-methyl-2-aminoethanesulfonic acid] buffer. After dissociation of the soluble proteome on a continuous sucrose gradient, the PBS dissociation products were loaded on a 6% acrylamide IEF gel containing ampholytes (pH 4 to 6.5; Amersham Biosciences, Orsay, France). Voltage was gradually increased from 50 to 350 V by 50-V steps every 10 min during the 2-h run. The resulting bands were crushed into a 10 mM Tricine buffer (pH 7.8) using an electric grinder. The purified complexes were characterized by their absorption and fluorescence properties. For visual comparison of the relative quantities of PBPs, soluble proteins of the M16.17 and M11.1 strains grown in light of both colors were also loaded on the IEF gel, on the basis of equal PCB quantities, i.e., similar optical densities at 620 nm.
Biochemical and mass spectrometry analyses of isolated phycobiliprotein subunits.
Intact PBSs were obtained as detailed above. They were then concentrated by ultracentrifugation and resuspended in the denaturation medium (9 M urea containing 5 mM β-mercaptoethanol). Samples were loaded on 4.5% acrylamide (30% acrylamide, 1.6% bisacrylamide) tube gels containing 8 M urea and a convenient mixture of ampholytes (Servalyt 4 to 6, 4%; Servalyt 3 to 7, 1%) to achieve isoelectric focusing in the pH 4 to 6 range. NaOH (0.02 M) was used as the cathode buffer and phosphoric acid (0.045%) as the anode buffer. The PBP subunits were allowed to focus for 6 h (1 h at 200 V, 1 h at 300 V, and 4 h at 400 V). Colored bands were mapped at the end of the electrophoresis and carefully cut. Samples for the study of absorption properties were soaked for 20 min in acidic (pH 3) 8 M urea, and the spectra were recorded in situ with an Aminco DW2 spectrophotometer.
For the second dimension, bands of interest were cut into small pieces and denatured with 6% LiDS denaturation buffer and then loaded on LiDS-PAGE plate gels (33). The Coomassie blue G 250-stained bands of PBP subunits were cut and analyzed by mass spectrometry using the facilities of the Unité de Phytopharmacie et Médiateurs Chimiques, LSMR-INRA Versailles, France.
(i) In-gel trypsin digestion.
Bands were excised and in-gel digestion was performed manually using a standard trypsin protocol. Briefly, after a washing step, gel particles were reduced, alkylated, and finally digested overnight with modified trypsin (Promega).
(ii) Matrix-assisted laser desorption ionization-time of flight analyses.
The matrix used was a solution containing 0.3 g · liter−1 of 4-hydroxy-α-cyanocinnamic acid in ethanol-acetone (2:1, vol/vol). The solution of digested peptides was loaded onto an AnchorChip target plate (Bruker) by mixing 0.5 μl of each solution with 1.5 μl of the matrix solution and was left to dry at room temperature. An on-target washing procedure was applied to remove water-soluble contaminants: 2 μl of 0.2% trifluoroacetic acid was applied to the target and removed after a few seconds. Mass spectra were acquired on a Bruker Reflex III matrix-assisted laser desorption ionization-time of flight instrument equipped with a nitrogen laser with an emission wavelength of 337 nm. Spectra were obtained in the reflectron mode at an accelerating voltage of 19 kV. Deflection of the low-mass ions was used to enhance the target peptide signal. Internal calibration was performed with autolysis trypsin peptides (842.5100, 2211.1046) for each measurement.
Nucleotide sequence accession numbers.
The partial (1.1-kb) 16S rRNA gene sequences of Synechococcus species strains M11.1 and M16.17 have been deposited in GenBank under accession numbers DQ224204 and DQ224203, respectively.
RESULTS
Phylogenetic analysis.
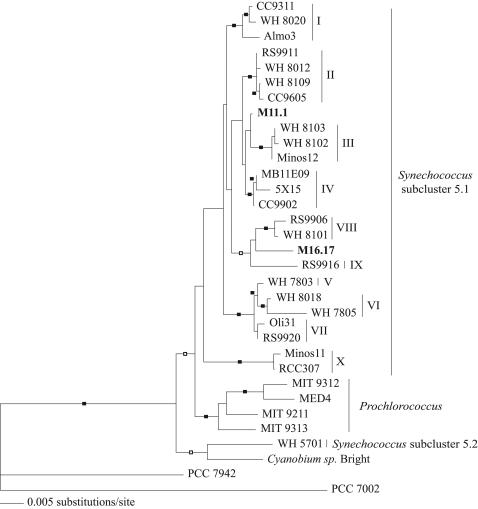
After gapped and ambiguously aligned positions were omitted, a total of 1,378 (126 parsimony-informative) characters were used for phylogenetic analysis. The neighbor-joining topology is shown in Fig. 1, with support for nodes as determined by the neighbor-joining and maximum parsimony bootstrap analyses, and Bayesian posterior probabilities are also shown. The tree topology obtained was very similar to the one presented by Fuller and coworkers (8), who found 10 major clades within marine Synechococcus subcluster 5.1. Both strain M16.17 and strain M11.1 are members of this subcluster but are phylogenetically distinct from one another, and they do not affiliate strongly with any of the previously described clades. Indeed, Synechococcus sp. strain M16.17 is a unique lineage that clusters with clades IX and VIII, the latter being represented by PC-rich strains devoid of PE (8), whereas Synechococcus sp. strain M11.1 is in a separate lineage. Interestingly, neither of these strains appears to be a sister taxon to the previously described chromatic adapters, including Synechococcus species strains CC9311 and WH 8020 (27), both members of clade I.
FIG. 1.
Neighbor-joining phylogeny inferred from partial 16S rRNA gene sequences rooted with Synechococcus strain PCC 7002 as the outgroup. Closed boxes indicate bootstrap values of >70 for both neighbor-joining and maximum parsimony analyses and a Bayesian posterior probability of >0.85. Open boxes designate support as described above but only for neighbor-joining and Bayesian analyses. Roman numerals indicate the 10 clades of Synechococcus subcluster 5.1 identified by Fuller and coworkers (8). Strains M11.1 and M16.17 are in bold.
Liposoluble-pigment content.
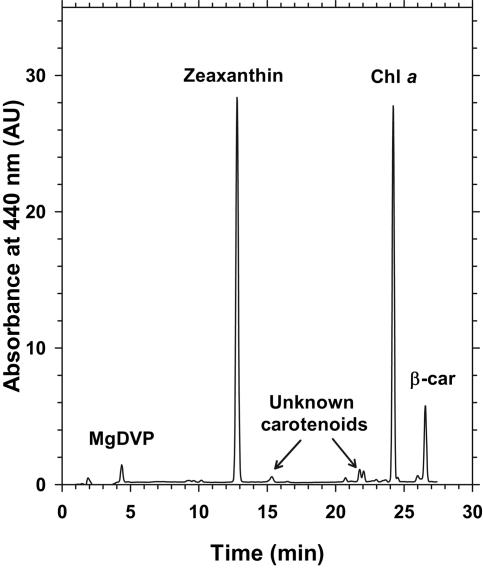
HPLC analysis of Synechococcus species strains M16.17 and M11.1 pigment contents revealed the presence of chlorophyll a, zeaxanthin, and β-carotene as the major liposoluble pigments (Fig. 2), as typically observed in marine Synechococcus spp. Interestingly, both isolates exhibited an additional pigment in a significant amount having optical characteristics and a retention time identical to that of Mg-divinyl-phaeoporphyrin a5, a chlorophyll c-like pigment. Although firm identification of this pigment would require mass spectrometry analysis, this is the first time that such a pigment has been observed in a PBS-containing cyanobacterium. M16.17 cultures grown in white light gave a chromatogram identical to that shown for blue light in Fig. 2 (same for M11.1 [not shown]), suggesting that there is no variation in the ratios of the different membrane pigments during the type IV CA process.
FIG. 2.
HPLC pigment analysis (absorbance at 440 nm) of Synechococcus sp. strain M16.17 acclimated to blue light. β-car, β-carotene; Chl a, chlorophyll a; MgDVP, Mg-divinyl-phaeoporphyrin a5.
Room temperature fluorescence spectra and kinetics of chromatic adaptation.
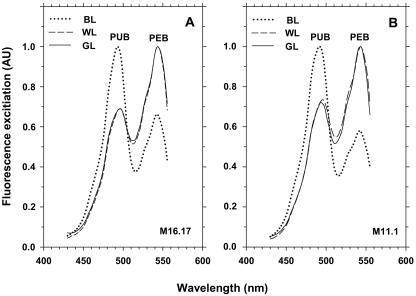
Figure 3 shows the excitation spectra from cells grown under white, blue, and green light for both Synechococcus strains. When acclimated for over 20 generations under blue light, strains M16.17 and M11.1 exhibited Ex495 nm/Ex545 nm ratios in the ranges of 1.72 to 1.85 and 1.51 to 1.82, respectively, whereas under white light, these ranges were 0.73 to 0.82 and 0.66 to 0.70, respectively. In contrast, there was no obvious variation in the room temperature fluorescence emission spectra, whatever the strain and light conditions (not shown).
FIG. 3.
Fluorescence excitation spectra (with emission at 580 nm) of Synechococcus species strains M16.17 (A) and M11.1 (B) acclimated to white light (WL), green light (GL), and blue light (BL).
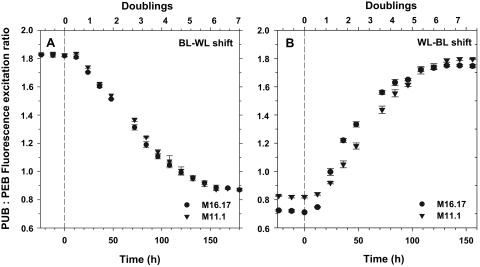
The Ex495 nm/Ex545 nm ratio changed quickly when Synechococcus species strains M16.17 and M11.1 were shifted from blue to white light and vice versa (Fig. 4). For both strains, there were few detectable changes in the Ex495 nm/Ex545 nm ratio during the first 12 h in the novel light environment, but after this initial lag period, there were dramatic variations of this ratio until the strains were fully acclimated to their new light environment. Due to small differences in growth rates between the two conditions, the kinetics of acclimation was slightly faster during the white-to-blue shift (132 h) than during the reverse shift (156 h). However, for both strains, it took 6.1 ± 0.3 generations to acclimate to the former shift and 6.4 ± 0.3 generations to acclimate to the latter shift. These differences were not significantly different according to Student's t test (t = 1.49; P = 0.167; degrees of freedom, 10).
FIG. 4.
Acclimation kinetics of the Ex495 nm/Ex545 nm ratio after a shift (at time zero) from blue to white light (BL-WL) (A) and white to blue light (WL-BL) (B) in Synechococcus species strains M16.17 and M11.1.
Growth rate and cytometric analyses.
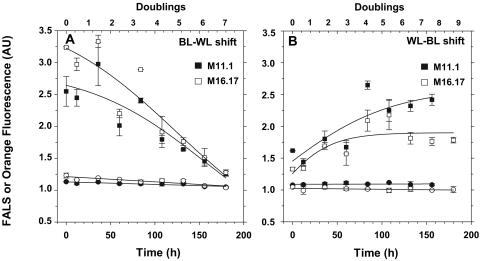
The acclimated growth rates for both cultures grown at 10 μmol photons m−2 s−1 were not significantly lower (one-way analysis of variance, F3, 8 = 0.06, P = 0.97) under constant blue light (μ, 0.45 ± 0.01 day−1 for strain M11.1 and 0.43 ± 0.15 day−1 for strain M16.17; n = 3) than under white light (μ, 0.45 ± 0.07 day−1 for strain M11.1 and 0.47 ± 0.12 day−1 for strain M16.17; n = 3). FALS did not change during the acclimation process (Fig. 5), indicating that cell size likely remained constant. The average rate of orange (PE) fluorescence per cell detected by flow cytometry globally increased after a shift from white light to blue light and decreased during the reverse shift, although for some unclear reason, these variations were not quite symmetrical between the two shifts (Fig. 5). These changes reflected the fact that the PUB chromophore, which is more abundant in blue-light-grown cells (see above), is better excited by the 488-nm laser band of the flow cytometer than is PEB.
FIG. 5.
Acclimation kinetics of flow cytometric parameters for Synechococcus species strains M16.17 (white symbols) and M11.1 (black symbols) after a shift (at time zero) from blue to white light (BL-WL) (A) and white to blue light (WL-BL) (B). FALS (circles) is a proxy for cell size, and orange fluorescence (squares) is a proxy for the PUB/PEB ratio.
Analysis of intact phycobilisomes.
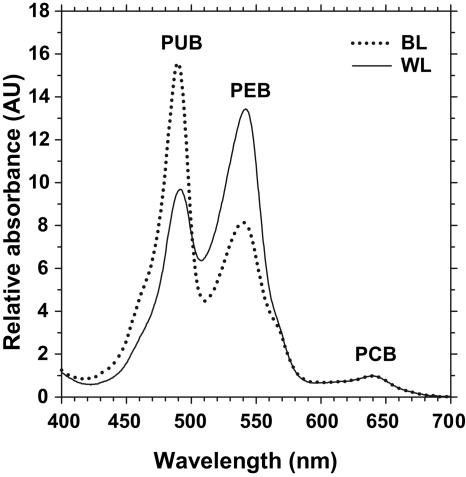
All PBS fractions from the different strains and treatments (white or blue light) migrated at the same position of the sucrose gradient (not shown), suggesting that there was no major PBS size difference between strains and culture conditions. Absorption properties of intact PBSs (Fig. 6) exhibited huge variations during type IV CA, confirming our previous observations based on whole-cell fluorescence excitation spectra (Fig. 3). Indeed, under blue light, the major absorption peak was at ∼492 nm (due to PUB) for both strain M11.1 and strain M16.17 (PUB/PEB ratios of 1.97 and 1.90, respectively), whereas under white light, PEB (Amax, ∼543 nm) was the main chromophore (PUB/PEB ratios of 0.79 and 0.70, respectively) (Fig. 6). As previously observed by Six and coworkers (33) for marine Synechococcus species strains WH 8102 and WH 7803, our study strains possessed PBSs with few blue pigments (i.e., a PCB Amax of ∼640 nm in intact PBSs).
FIG. 6.
Absorption spectra of intact PBSs from Synechococcus sp. strain M16.17 grown in blue light (BL) and white light (WL).
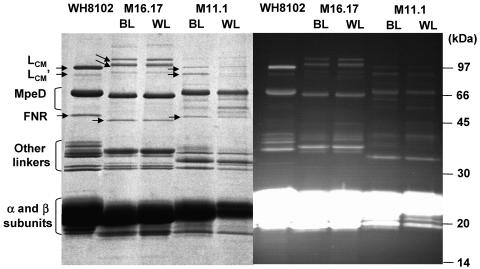
Analyses of the PBS linker polypeptide composition (Fig. 7) revealed a number of differences between the two novel, chromatically adapting strains, M11.1 and M16.17, as well as between these two strains and the well-characterized WH 8102 strain (33), shown for comparison. In Synechococcus sp. strain M11.1, the blue-chromophorylated, large-sized core-membrane linker (LCM) and its degradation product (LCM′) bands were in small amounts, especially under white light. The anchor linker polypeptide LCM from Synechococcus sp. strain M11.1 exhibited an apparent molecular mass similar to the one in WH 8102 (∼97 kDa). In contrast, Synechococcus sp. strain M16.17 seems to possess a larger LCM, with an apparent molecular mass higher than 100 kDa. In both strains, the presence of an abundant green-fluorescing linker with an apparent mass of ∼65 kDa was observed. It is very likely a homolog of MpeD, a chimeric, PE-associated, PUB-binding linker in Synechococcus sp. strain WH 8102, recently characterized and suggested to connect the distal PEI disk to the proximal PEII disk (33). In the M11.1 profile, the faint green-fluorescing protein bands located between MpeD and the 45-kDa band likely due to ferredoxin:NADPH oxidoreductase (FNR) were most likely some MpeD degradation products. Other green-fluorescing linkers (i.e., binding PUB) were observed in the two chromatically adapting strains, in particular, one at ∼35 kDa in M16.17 and another at ∼33 kDa in M11.1. The precise identification of those bands would require further molecular and biochemical analyses which were beyond the scope of the present paper. It is likely, though, that they are PEII-associated linker polypeptides homologous to MpeC and/or MpeE (33, 43). The most important finding in the context of understanding the mechanism of CA was that, in both strains, there was no variation of the linker polypeptide composition with the light quality, suggesting that in contrast to what happens in other CA types, there was no major change in the PBS composition resulting from type IV CA.
FIG. 7.
Coomassie blue-stained (left) and UV-visualized (right) LiDS-PAGE gels showing the linker composition of intact PBSs from Synechococcus species strains M11.1 and M16.17 grown in blue (BL) and white light (WL). The corresponding profile obtained for the chromatically nonadapting Synechococcus sp. strain WH 8102, in which all the linkers have been firmly identified (33), are shown for comparison. Note that the latter profile differs from the previously published one by an artifactual doubling of the MpeE band at ca. 38 kDa. Double arrows indicate the positions of LCM and LCM′ linker polypeptides (both of which fluoresce blue under UV light), and the single arrow indicates the likely position of FNR in each strain. Minor bands located between the FNR and MpeD in M11.1 are likely proteolytic fragments of MpeD.
Comparative analysis of isolated phycobiliprotein complexes and subunits from white- and blue-light-grown cultures.
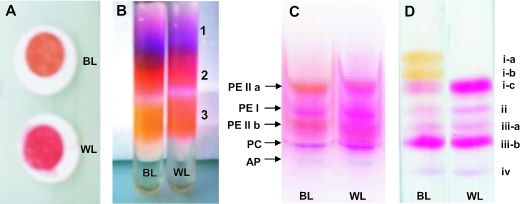
Figure 8 shows the key purification steps of individual PBP complexes and of subunits from Synechococcus sp. strain M16.17. Both purification methods started from white- and blue-light-grown cultures showing clear-cut pinkish and orange colors, respectively (Fig. 8A). After extraction of soluble proteins and dissociation of PBSs using a low-strength ionic buffer (10 mM phosphate, pH 7), samples from the two light conditions were either directly loaded on an IEF mini-gel on a same-PCB-amount basis (Fig. 8C) or loaded first on a continuous sucrose gradient (Fig. 8B) for a preliminary separation of PBP complexes before being purified on an IEF mini-gel.
FIG. 8.
Different purification steps of phycobilisome components from Synechococcus sp. strain M16.17 cells grown in blue light (BL) and white light (WL). Filtered whole cells (A); dissociation of soluble proteins on continuous sucrose gradient showing the different fractions 1, 2, and 3 (B); native IEF gel of soluble proteins showing separated PBP complexes, including two PEII fractions (a and b) (C); and denaturing IEF showing separated PBP polypeptides (D). See the text for details.
The direct separation of the M16.17 strain PBPs on IEF led to five PBP bands with similar relative intensities under blue- and white-light conditions (Fig. 8C). Comparable profiles obtained for strain M11.1 were highly similar to those for M16.17 (not shown). For both strains, the general pattern obtained under blue light was similar to that described previously for the chromatically nonadapting strain Synechococcus sp. strain WH 8102 (33). As confirmed by its optical properties (not shown), the blue band at the bottom of the gel is AP. The band just above it, which owes its violet color to the presence of both PCB and PEB chromophores, is R-PC II (26). The three other bands on the IEF gel corresponded to PE complexes. Under both light conditions, the second band from the top of the pH gradient, which was identified spectrally as PEI (see below), was pinkish. In contrast, the remaining two bands on the IEF gel, both corresponding to PEII (see below), were orange in blue light but pinkish in white light (Fig. 8C).
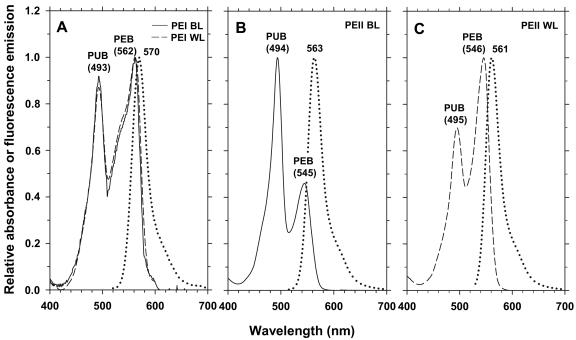
In order to characterize these different PBPs optically, we first separated them on a sucrose gradient before purifying them on IEF gels. The sucrose gradient shown in Fig. 8B exhibits three-colored and highly fluorescent fractions. The purple fraction (Fig. 8C, fraction 1) was enriched in AP and PC, as evidenced by the large relative concentration of PCB in the absorption spectrum obtained from this fraction (not shown). The pinkish fraction (fraction 2) was enriched in both PEI and PEII. The orange fraction (fraction 3), totally devoid of blue pigments, contained nearly pure PEII complexes. Accordingly, IEF gels loaded with these fractions displayed the corresponding PBP bands, i.e., a subset of those observed in Fig. 8C. Optical measurements of IEF-purified PBPs confirmed these observations (Fig. 9). PEI complexes exhibited similar properties under both light conditions (Fig. 9A), with a typical shouldered PEB peak slightly higher than the PUB peak and a fluorescence emission maximum at ca. 570 nm (APUB max/APEB max ≈ 0.90). These properties are comparable to those of PEI complexes isolated from WH 8103 (25) and WH 8102 (33). Both PEII bands (Fig. 8C, bands PEII a and PEII b) from blue-light-grown Synechococcus sp. strain M16.17 exhibited an APUB max/APEB max ratio of 2.2 compared to 0.70 for cells grown under white light (Fig. 9B and C). However, the fluorescence emission maxima of these PEII complexes were similar under both light conditions, with peaks around 562 nm. Very similar results were obtained with the M11.1 strain (not shown).
FIG. 9.
Optical properties of Synechococcus sp. strain M16.17 phycoerythrin complexes. PEI absorption spectra in blue light (BL; continuous line) and white light (WL; dashed line) and corresponding fluorescence emission spectra (identical for both light qualities; dotted line) (A); PEII absorption and fluorescence emission spectra in blue light (B) and white light (C). Note that profiles obtained for the PEII a and PEII b bands (Fig. 8C) were identical.
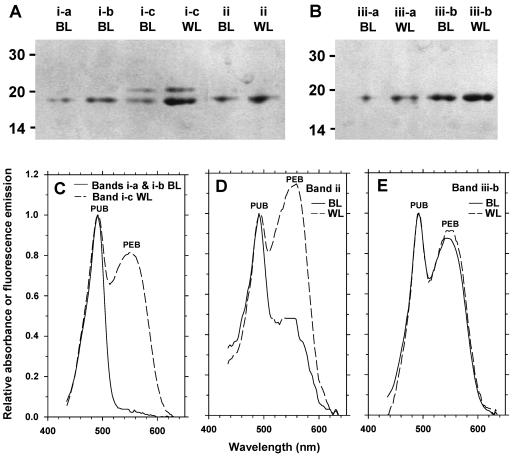
Figure 8D shows the separation of individual PBP subunits on a denaturing IEF gel, starting from intact PBSs of Synechococcus sp. strain M16.17 cells grown under blue and white light. The most striking difference between the profiles in blue and white light was the occurrence, only under the former conditions, of two orange bands (Fig. 8D, bands i-a and i-b) in the upper, more basic part of the pH gradient. This was at the expense of the third pink band (band i-c), which under white light became the major band together with band iii-b.
In order to better characterize these colored bands, they were excised from the IEF gel and their absorption spectra were measured (Fig. 10C to E). They were then run on a LiDS-PAGE gel (Fig. 10A and B) prior to mass spectrometry analyses (not shown). The two orange bands (i-a and i-b) in Fig. 8D were identified as being pure MpeA, i.e., the PEII α-subunit. The absorption spectra of these two bands were identical and displayed only PUB (Fig. 10C). Given that MpeA is known to have three chromophore-binding sites (25), the molar PUB/PEB ratio of the blue-light-grown form of MpeA must therefore be 3:0. A pink band (band i-c) corresponds to the white light form of MpeA. It has an APUB max/APEB max of ≈1.22, and using Klotz and Glazer's coefficients (18), we estimated a PUB/PEB molar ratio of 1:2. The latter ratio should, however, be taken with caution since CpeB, the PEI β-subunit, comigrated to the same position (band i-c) in the IEF profile, as shown by the presence of two bands in the corresponding LiDS-PAGE gel (Fig. 10A, lanes 3 and 4) and as confirmed by mass spectrometry analyses.
FIG. 10.
LiDS-PAGE (A and B) and absorption spectra (C, D, and E) of the main bands from the denaturing IEF gel shown in Fig. 8D, obtained from Synechococcus sp. strain M16.17 cells grown in blue light (BL) and white light (WL). The absorption spectra of bands i-a and i-b (present only in BL) were identical and very different from that of band i-c (C). The LiDS-PAGE analysis of band i-c (A) revealed that it was made up of two proteins, a minor (∼20-kDa) protein, CpeB, and a major (∼18-kDa) protein, MpeA, also found (pure) in bands i-a and i-b. Bands iii-a and iii-b contained a sole ∼19-kDa protein, MpeB (B).
The second major band on the IEF gel, band iii-b, proved to be pure MpeB, i.e., the PEII β-subunit. In contrast to that of the MpeA bands, its absorption spectrum did not significantly vary with light quality (Fig. 10E). Consequently, the PUB/PEB molar ratio of MpeB was invariant and was assessed to be 1:2. The peptide composition of the minor band iii-a also proved to be dominated by MpeB. The peptide masses of the MpeB tryptic peptides from bands iii-a and iii-b were identical, as were the peptides identified as MpeA from fractions i-a through i-c. This clearly indicated that there was only one type of PEII apoprotein, whatever the light conditions. Thus, the only difference between PEII molecules from blue- and white-light-grown cells was the chromophorylation of the α-subunit.
Band ii was also interesting, as its absorption spectrum varied with light quality (Fig. 10D), confirming a color change visible on the IEF gel (Fig. 8D). Mass spectrometry analysis showed that this was dominated by CpeA, the PEI α-subunit, but that it also contained some MpeA. Thus, the drastic change in the absorption properties of this fraction (Fig. 10D) suggests that the chromophorylation of CpeA may change with light quality. However, this needs further investigation since it is not consistent with the optical properties of isolated PEI complexes (Fig. 9A), and the spectra in Fig. 10D are probably influenced by the presence of MpeA. Although it was not formally characterized, the violet band (Fig. 8D, band iv) was likely the PCII β-subunit (RpcB), as it is known to bear a single molecule each of PEB and PCB (26). Thin blue bands corresponding to the phycocyanin α-subunit and the allophycocyanin α- and β-subunits could also be observed at a more acidic position in the pH gradient but are not shown in Fig. 8D.
DISCUSSION
A likely mechanism for CA type IV.
Biochemical analyses of isolated PBP complexes of Synechococcus species strains M16.17 and M11.1 allowed us to better understand the mechanism involved in the process of type IV CA. Overall, the data suggest that this mechanism involves differential chromophorylation, not differential synthesis, of PBPs; thus, type IV CA differs dramatically from both type II and type III CA. Shifting Synechococcus sp. strain M16.17 or M11.1 cells from white to blue light did not provoke any change in the relative abundances of PEI and PEII with regard to one another and to other PBPs (Fig. 8C), excluding a mechanism based on a modulation of the relative stoichiometries of PEI and PEII. Moreover, because of the different emission properties of PEI and PEII (compare Fig. 9A with B and C) (25), an increase in the PEI/PEII ratio should induce a shift in the in vivo fluorescence emission maximum of PE (with excitation at the PUB maximum) from ∼565 to ∼574 nm (32, 33). The absence of such a shift between the PE emission maximum of blue-light- and white-light-adapted strains (not shown) therefore tends to confirm that the PEI/PEII ratio remains constant during the process of type IV CA.
The optical properties, particularly the APUB max/APEB max ratio, of isolated PEI complexes are the same, regardless of whether they were isolated from cells grown in white or blue light (Fig. 9A). This suggests that PEI is not involved in the type IV CA process, although contradicting evidence was seen in the change of the color and absorption spectrum of a band dominated by CpeA during denaturing IEF (Fig. 8D and 10D).
For PEII, Synechococcus sp. strain M16.17 (and M11.1 [data not shown]) clearly synthesizes a PEB-rich PEII form when grown under white or green light (Fig. 9B) and a PUB-rich form when grown under blue light (Fig. 9C). Interestingly, the white-light-grown PEII form shows optical properties identical to those of the PEII described for Synechococcus sp. strain WH 8020 (25), whereas the blue-light-grown PEII form is optically identical to the high-PUB-containing PEII form described for strains WH 8103 (25) and WH 8102 (33). In WH 8103, the PEII protein carries four PUB and two PEB chromophores per αβ heterodimer, whereas the PEII described for WH 8020 binds two PUB and four PEB molecules (25). The chromophore attachment sites of these PEs have been precisely characterized, showing that WH 8020 and WH 8103 PEIIs differ only by the chromophorylation of α-83 and α-140 cysteinyl residues, which bind both PEB for the former strain and PUB for the latter (25). By analogy, we hypothesize that similar differences exist between the white- and blue-light-grown forms of PEII in the chromatic adapters M16.17 and M11.1.
In order to confirm this, we purified and characterized the PEII α- and β-subunits of M16.17 grown under white and blue light. The PUB/PEB molar ratio of MpeB was found to be 1:2 under both light conditions, i.e., identical to that described for WH 8020 and WH 8103 when grown in white light (25). The comigration of MpeA and some CpeB in the major pink fraction from M16.17 grown in white light (Fig. 8D) rendered the assessment of the PUB/PEB molar ratios in MpeA more delicate. However, we think that this chromophore molar ratio changes from 1:2 in white light to 3:0 in blue light (as found in the MpeA of white-light-grown cells from WH 8020 and WH 8103, respectively [25]). Thus, the similarity of the PEIIs from blue- and white-light-grown cells of M16.17 to forms of PEII which have already been described seems confirmed. WH 8020 appears to be capable of chromatic adaptation, but WH 8103 does not (27). It will be interesting to see whether the PEII produced by WH 8020 grown in blue light shows the same similarity to the constitutively produced PEII of WH 8103 as the blue-light-grown form of PEII from M16.17.
To our knowledge, this is the first report of environmentally determined variation in the chromophorylation of a PBP, and it reflects a completely different mechanism of CA than previously reported for other cyanobacteria. Several scenarios can be evoked to explain this modification. First, a process involving two copies of mpeBA and associated linker polypeptide genes could be postulated, with one set being specifically induced under blue and the other under green light. However, the absence of a light quality-induced variation in the linker polypeptide composition as seen by LiDS-PAGE (Fig. 7) and the evidence from mass spectrometry analysis of isolated PEII α- and β-subunits that there is only one PEII type, whatever the light climate (i.e., probably only one mpeBA operon), make this hypothesis fairly unlikely. In addition, a preliminary analysis of PE apoprotein genes in strain M16.17 using PE-specific primers and denaturing gradient gel electrophoresis revealed only one copy of mpeBA in addition to cpeBA (C. Everroad, unpublished).
The most likely explanation is the differential chromophorylation, according to the ambient light quality, of a single set of PEII apoproteins. Although the enzymes involved in the biosynthesis of PUB in marine Synechococcus spp. have never been formally characterized, this chromophore likely results from the attachment and subsequent isomerization of PEB in a way similar to that documented for the chromophore couple phycocyanobin/phycoviolibilin in Mastigocladus laminosus (35). It can therefore be hypothesized that the type IV CA process requires at least two types of lyases: (i) under white or green light conditions, one (or two) simple lyase(s) would specifically bind PEB molecules to the α-83 and/or α-140 cysteinyl residues of MpeA, and (ii) under blue light conditions, one (or two) lyase/isomerase(s) would specifically bind PEB molecules to the same residues and then isomerize them into PUB (Fig. 10).
It is unlikely that the light quality-induced exchange of PUB and PEB chromophores occurs directly within the PBSs already assembled because the accessibility of chromophores to the enzyme would be too limited. More likely, once the cells have perceived a change in the ambient light quality via a signal transduced from a blue-light photoreceptor, they must start synthesizing new PBSs with the most convenient chromophorylation. The latter hypothesis is more consistent with the time lapse (i.e., 1 week or about six doublings in our experiments) necessary for the cells to fully adapt to new light conditions (Fig. 4).
Further molecular analyses as well as the examination of the whole genome of a chromatic adapter, such as that of Synechococcus sp. strain CC9311, which should be released in the near future, are needed to confirm our hypotheses about the mechanism of type IV CA. In particular, this would confirm the presence of a single set of PEII genes. It could also reveal whether chromatic adapters have specific and/or additional lyases or lyase-isomerases compared to nonadapters or if this ability relies on specific light-regulated motifs upstream from lyase or lyase-isomerase gene sequences. Finally, it remains to be determined whether chromatic adapters possess specific blue photoreceptors since it appears that they are required for type IV CA to proceed.
Phylogenetic considerations.
We show here that type IV CA occurs in two novel Synechococcus sp. strains, M16.17 and M11.1, which are phylogenetically distinct from each other and from those previously characterized as chromatically adapting strains (CC9311, CC9617, WH 8020, and WH 8113) by Palenik (27). Therefore, contrary to some characteristics, such as motility (39), which is found only in clade III sensu Fuller and coworkers (8), CA type IV is not restricted to a group of related strains but may have appeared (or been conserved) during evolution within different lineages of marine Synechococcus species strains. The amplitudes of the changes in Ex495 nm/Ex545 nm ratios observed in strains M16.17 and M11.1 following light quality shifts are comparable between one another and also consistent with the ranges of variations reported previously for other strains (27), i.e., 1.6 to 1.8 under blue light and 0.6 to 0.8 under white light. Despite their phylogenetic distance, it is possible that all these strains use the same or a closely related mechanism of chromatic adaptation. However, there also might have been convergent evolutionary processes that have led to apparently similar type IV CAs in phylogenetically distinct strains. Future analyses of PBS genomic regions of type IV chromatic adapters will help determine whether or not these strains share the same CA process or whether there are different kinds of type IV CA.
Ecological considerations.
Strains studied in this report seemingly acclimated over a broader range of PUB/PEB ratios than the chromatically adapting strain CC9311, isolated from the California Current (PUB/PEB ratio range of ∼0.9 in about six doublings versus a range of ∼0.25 in about four doublings for CC9311; compare Fig. 4 with Fig. 2 in the work of Palenik [27]). Whether this is due to intrinsic differences or to other factors, including irradiance quality, irradiance quantity, and nutrient status, remains to be studied. However, at the growth rates reported here, a cell could have largely modified its PUB/PEB ratio (e.g., from ∼1.8 down to ∼1.3) in only 72 h. In clear oligotrophic waters where the concentration of chlorophyll is less than 0.07 mg m−3, wavelengths absorbed by PUB are approximately six times more available than wavelengths absorbed by PEB (20, 31). Nonetheless, when chlorophyll concentration increases to about 0.6 mg m−3, as occurs in about 2 weeks at the onset of the upwelling of the Arabian Sea (7), the strong absorption of blue light by chlorophyll leads to roughly equal availabilities of wavelengths absorbed by the two chromophores. At chlorophyll concentrations of >1.5 mg m−3, the strong Soret absorption from chlorophyll leads to a preponderance of green light, even in otherwise very clear water. Thus, it appears that the rate of chromatic adaptation displayed by our strains would likely be fast enough to track changes in the relative availabilities of blue and green light that occur as phytoplankton respond to an upwelling or mixing event in the open ocean. When PUB/PEB ratios are genetically fixed, as is the case for most marine Synechococcus species strains characterized to date (8, 32, 42), then the community's ability to track changing light conditions would by necessity occur at the population genetic level. The discovery of more and more chromatic adapters in these communities now means that observed changes in the PUB/PEB ratio of PE in bulk water may also in part be due to physiological adaptation by extant organisms. Although still fairly rare in culture collections, which often provide a biased view of the representativeness of genotypes in the field, chromatic adapters appear to be particularly well adapted to out-compete chromatically nonadapting strains in oligotrophic regions subject to periodic or intermittent nutrient enrichment. This clearly raises questions about the relative abundances and distributions of these chromatic adapters in different oceanic waters and in particular those influenced by different nutrient sources such as upwelling or near coastal areas.
Acknowledgments
This work was supported by ONR grant N00149910177 (to A.M.W.), the Doherty Endowment of the Sea Education Association (Woods Hole, MA), and an NSF IGERT Evolution, Development, and Genomics training grant to the University of Oregon. Fieldwork in the Gulf of Mexico for C.E. was also supported by NSF grant OCE-0118733 and NOAA/NURP UNCW grant NA96RU0260 (both to C. M. Young). C.S. was supported by a grant from the Ministère de la Recherche et des Nouvelles Technologies (France). Benchwork by C.E. while in France and by F.P., C.S., and J.H. was supported by the European Community program MARGENES (QLRT 2001-01226), the national programs PROOF-UVECO and ANR-PHYCOSYN, and the regional program IMPALA (Région Bretagne).
We thank Dave Scanlan for providing us an alignment of 16S rRNA gene sequences, Christian Malosse for mass spectrometry analyses, Thibaut Desquilbet for help with data formatting, Keiko Minami and Julie Toplin for technical assistance, and Brian Palenik, Brian Matthews, and Andy Berglund for useful discussion.
REFERENCES
- 1.Alberte, R. S., A. M. Wood, T. A. Kursar, and R. R. L. Guillard. 1984. Novel phycoerythrins in marine Synechococcus spp. Plant Physiol. 75:732-739. [DOI] [PMC free article] [PubMed] [Google Scholar]
- 2.Anderson, L. K., M. C. Rayner, and F. A. Eiserling. 1984. Ultra-violet mutagenesis of Synechocystis sp. 6701: mutations in chromatic adaptation and phycobilisome assembly. Arch. Microbiol. 138:237-243. [Google Scholar]
- 3.Brahamsha, B. 1996. A genetic manipulation system for oceanic cyanobacteria of the genus Synechococcus. Appl. Environ. Microbiol. 62:1747-1751. [DOI] [PMC free article] [PubMed] [Google Scholar]
- 4.Campbell, L., and R. Iturriaga. 1988. Identification of Synechococcus spp. in the Sargasso Sea by immunofluorescence and fluorescence excitation spectroscopy performed on individual cells. Limnol. Oceanogr. 33:1196-1201. [Google Scholar]
- 5.Conley, P. B., P. G. Lemaux, and A. Grossman. 1988. Molecular characterization and evolution of sequences encoding light-harvesting components in the chromatically adapting cyanobacterium Fremyella diplosiphon. J. Mol. Biol. 199:447-465. [DOI] [PubMed] [Google Scholar]
- 6.de Lamballerie, X., C. Zandotti, C. Vignoli, C. Bollet, and P. de Micco. 1992. A one-step microbial DNA extraction method using “Chelex 100” suitable for gene amplification. Res. Microbiol. 143:785-790. [DOI] [PubMed] [Google Scholar]
- 7.Dickey, T., J. Marra, D. E. Sigurdson, R. A. Weller, C. S. Kinkade, E. S. Zedler, J. D. Wiggert, and C. Langdon. 1998. Seasonal variability of bio-optical and physical properties in the Arabian Sea: October 1994-October 1995. Deep-Sea Res. Part II 45:2001-2025. [Google Scholar]
- 8.Fuller, N. J., D. Marie, F. Partensky, D. Vaulot, A. F. Post, and D. J. Scanlan. 2003. Clade-specific 16S ribosomal DNA oligonucleotides reveal the predominance of a single marine Synechococcus clade throughout a stratified water column in the Red Sea. Appl. Environ. Microbiol. 69:2430-2443. [DOI] [PMC free article] [PubMed] [Google Scholar]
- 9.Glazer, A. N. 1999. Cyanobacterial photosynthetic apparatus: an overview. Bull. Inst. Oceanogr. Monaco 19:419-434. [Google Scholar]
- 10.Grossman, A. R. 2003. A molecular understanding of complementary chromatic adaptation. Photosynth. Res. 76:207-215. [DOI] [PubMed] [Google Scholar]
- 11.Grossman, A. R., D. Bhaya, and Q. F. He. 2001. Tracking the light environment by cyanobacteria and the dynamic nature of light harvesting. J. Biol. Chem. 276:11449-11452. [DOI] [PubMed] [Google Scholar]
- 12.Guillard, R. R., and J. H. Ryther. 1962. Studies of marine diatoms. I. Cyclotella nana Hustedt and Detonula confervacea (cleve) Gran. Can. J. Microbiol. 8:229-239. [DOI] [PubMed] [Google Scholar]
- 13.Hall, T. A. 1999. BioEdit: a user-friendly biological sequence alignment editor and analysis program for Windows 95/98/NT. Nucleic Acids Symp. Ser. 41:95-98. [Google Scholar]
- 14.Herdman, M., R. W. Castenholz, J. B. Waterbury, and R. Rippka. 2001. Form-genus XIII. Synechococcus, p. 508-512. In D. R. Boone and R. W. Castenholz (ed.), Bergey's manual of systematic bacteriology, 2nd ed., vol. 1. Springer-Verlag, New York, N.Y. [Google Scholar]
- 15.Huelsenbeck, J. P., and F. Ronquist. 2001. MRBAYES: Bayesian inference of phylogenetic trees. Bioinformatics 17:754-755. [DOI] [PubMed] [Google Scholar]
- 16.Jeffrey, S. W., R. F. C. Mantoura, and S. W. Wright. 1997. Phytoplankton pigments in oceanography. Unesco Publishing, Paris, France.
- 17.Jerlov, N. 1976. Marine optics. Elsevier, Amsterdam, The Netherlands.
- 18.Klotz, A. V., and A. N. Glazer. 1985. Characterization of the bilin attachment sites in R-phycoerythrin. J. Biol. Chem. 260:4856-4863. [PubMed] [Google Scholar]
- 19.Li, W. K. W. 1994. Primary productivity of prochlorophytes, cyanobacteria, and eucaryotic ultraphytoplankton: measurements from flow cytometric sorting. Limnol. Oceanogr. 39:169-175. [Google Scholar]
- 20.Martin, S. A. 2004. An introduction to ocean remote sensing. Cambridge University Press, Cambridge, United Kingdom.
- 21.Mazel, D., J. Houmard, and N. Tandeau de Marsac. 1988. A multigene family in Calothrix sp. PCC 7601 encodes phycocyanin, the major component of the cyanobacterial light harvesting antenna. Mol. Gen. Genet. 211:296-304. [DOI] [PubMed] [Google Scholar]
- 22.Miller, S. R., and R. W. Castenholz. 2000. Evolution of thermotolerance in hot spring cyanobacteria of the genus Synechococcus. Appl. Environ. Microbiol. 66:4222-4229. [DOI] [PMC free article] [PubMed] [Google Scholar]
- 23.Nübel, U., F. Garcia-Pichel, and G. Muyzer. 1997. PCR primers to amplify 16S rRNA genes from cyanobacteria. Appl. Environ. Microbiol. 63:3327-3332. [DOI] [PMC free article] [PubMed] [Google Scholar]
- 24.Olson, R. J., E. R. Zettler, E. V. Armbrust, and S. W. Chisholm. 1990. Pigment, size and distribution of Synechococcus in the North Atlantic and Pacific oceans. Limnol. Oceanogr. 35:45-58. [Google Scholar]
- 25.Ong, L. J., and A. N. Glazer. 1991. Phycoerythrins of marine unicellular cyanobacteria. I. Bilin types and locations and energy transfer pathways in Synechococcus spp. phycoerythrins. J. Biol. Chem. 266:9515-9527. [PubMed] [Google Scholar]
- 26.Ong, L. J., and A. N. Glazer. 1987. R-phycocyanin II, a new phycocyanin occurring in marine Synechococcus species. J. Biol. Chem. 262:6323-6327. [PubMed] [Google Scholar]
- 27.Palenik, B. 2001. Chromatic adaptation in marine Synechococcus strains. Appl. Environ. Microbiol. 67:991-994. [DOI] [PMC free article] [PubMed] [Google Scholar]
- 28.Partensky, F., J. Blanchot, and D. Vaulot. 1999. Differential distribution and ecology of Prochlorococcus and Synechococcus in oceanic waters: a review. Bull. Inst. Oceanogr. Monaco 19:457-475. [Google Scholar]
- 29.Rippka, R., T. Coursin, W. Hess, C. Lichtlé, D. J. Scanlan, K. A. Palinska, I. Iteman, F. Partensky, J. Houmard, and M. Herdman. 2000. Prochlorococcus marinus Chisholm et al. 1992 subsp. pastoris subsp. nov. strain PCC 9511, the first axenic chlorophyll a2/b2-containing cyanobacterium (oxyphotobacteria). Int. J. Syst. Evol. Microbiol. 50:1833-1847. [DOI] [PubMed] [Google Scholar]
- 30.Rodriguez, F., J. F. Oliver, A. Marin, and J. R. Medina. 1990. The general stochastic model of nucleotide substitution. J. Theor. Biol. 142:485-501. [DOI] [PubMed] [Google Scholar]
- 31.Roessler, C. S., and M. J. Perry. 1995. In situ phytoplankton absorption, fluorescence emission, and particulate backscattering spectra determined from reflectance. J. Geophys. Res. 100:13279-13294. [Google Scholar]
- 32.Six, C., J. C. Thomas, B. Brahamsha, Y. Lemoine, and F. Partensky. 2004. Photophysiology of the marine cyanobacterium Synechococcus sp. WH8102, a new model organism. Aquat. Microb. Ecol. 35:17-29. [Google Scholar]
- 33.Six, C., J.-C. Thomas, L. Thion, Y. Lemoine, F. Zal, and F. Partensky. 2005. Two novel phycoerythrin-associated linker proteins in the marine cyanobacterium Synechococcus sp. strain WH8102. J. Bacteriol. 187:1685-1694. [DOI] [PMC free article] [PubMed] [Google Scholar]
- 34.Six, C., A. Z. Worden, F. Rodriguez, H. Moreau, and F. Partensky. 2005. New insights into the nature and phylogeny of prasinophyte antenna proteins: Ostreococcus tauri, a case study. Mol. Biol. Evol. 22:2217-2230. [DOI] [PubMed] [Google Scholar]
- 35.Storf, M., A. Parbel, M. Meyer, B. Strohmann, H. Scheer, M. G. Deng, M. Zheng, M. Zhou, and K. H. Zhao. 2001. Chromophore attachment to biliproteins: specificity of PecE/PecF, a lyase-isomerase for the photoactive 3(1)-Cys-alpha 84-phycoviolobilin chromophore of phycoerythrocyanin. Biochemistry 40:12444-12456. [DOI] [PubMed] [Google Scholar]
- 36.Tandeau de Marsac, N. 1977. Occurrence and nature of chromatic adaptation in cyanobacteria. J. Bacteriol. 130:82-91. [DOI] [PMC free article] [PubMed] [Google Scholar]
- 37.Tandeau de Marsac, N., and J. Houmard. 1988. Complementary chromatic adaptation: physiological conditions and action spectra. Methods Enzymol. 167:318-328. [Google Scholar]
- 38.Thompson, J. D., T. J. Gibson, F. Plewniak, F. Jeanmougin, and D. G. Higgins. 1997. The CLUSTAL_X windows interface: flexible strategies for multiple sequence alignment aided by quality analysis tools. Nucleic Acids Res. 25:4876-4882. [DOI] [PMC free article] [PubMed] [Google Scholar]
- 39.Toledo, G., B. Palenik, and B. Brahamsha. 1999. Swimming marine Synechococcus strains with widely different photosynthetic pigment ratios form a monophyletic group. Appl. Environ. Microbiol. 65:5247-5251. [DOI] [PMC free article] [PubMed] [Google Scholar]
- 40.Vaulot, D. 1989. CYTOPC: processing software for flow cytometric data. Signal Noise 2:8. [Google Scholar]
- 41.Waterbury, J., and J. M. Willey. 1988. Isolation and growth of marine planktonic cyanobacteria. Methods Enzymol. 167:105-112. [Google Scholar]
- 42.Waterbury, J. B., S. W. Watson, F. W. Valois, and D. G. Franks. 1986. Biological and ecological characterization of the marine unicellular cyanobacterium Synechococcus. Can. Bull. Fish. Aquat. Sci. 472:71-120. [Google Scholar]
- 43.Wilbanks, S. M., and A. N. Glazer. 1993. Rod structure of a phycoerythrin II-containing phycobilisome. II. Complete sequence and bilin attachment site of a phycoerythrin γ subunit. J. Biol. Chem. 268:1236-1241. [PubMed] [Google Scholar]
- 44.Wood, A. M. 1985. Adaptation of photosynthetic apparatus of marine ultraphytoplankton to natural light fields. Nature 316:253-255. [Google Scholar]
- 45.Wood, A. M., R. C. Everroad, and L. M. Wingard. 2005. Measuring growth rates in microalgal cultures, p. 269-286. In R. A. Anderson (ed.), Algal culturing techniques. Elsevier Academic Press, Burlington, Mass.
- 46.Wood, A. M., P. K. Horan, K. Muirhead, D. A. Phinney, C. M. Yentsch, and J. M. Waterbury. 1985. Discrimination between types of pigments in marine Synechococcus spp. by scanning spectroscopy, epifluorescence microscopy, and flow cytometry. Limnol. Oceanogr. 30:1303-1315. [Google Scholar]
- 47.Wood, A. M., D. A. Phinney, and C. S. Yentsch. 1998. Water column transparency and the distribution of spectrally distinct forms of phycoerythrin-containing organisms. Mar. Ecol. Prog. Ser. 162:25-31. [Google Scholar]


