Abstract
A method for pharmacokinetic studies using cassette dosing associated with serial bleeding in mice is described. PK profiles of four soluble epoxide hydrolase inhibitors were determined following oral, subcutaneous or intraperitoneal administration individually or in cassette dosing. Parent analyses were performed on only 5 μL of whole blood from serial bleeds (up to 10 per animal), by LC/MS/MS. An accuracy (88-100%) and precision (<10% RSD) were observed, leading to reliable datum points for PK calculation. PK profiles, Tmax, Cmax and half-life values after cassette dosing were similar to the individual PK results. This method dramatically increases speed of data collection while dramatically reducing cost and animal usage. The results presented here clearly indicate that this proposed method could be applicable to high-throughput PK studies.
Keywords: Pharmacokinetics, Serial bleeding, Cassette dosing, LC/MS/MS, High-throughput
1. Introduction
The development of new therapeutic drugs is a long and costly process. With the introduction of combinatorial chemistry, high throughput screening, and other technologies, the speed of lead generation has increased [1,2]. However, prioritization of leads with regard to drug metabolism and pharmacokinetics (DMPK) in animals appears crucial in the selection of viable targets from millions of compounds [3,4].
Due to in vivo constraints, classical DMPK methods are not high throughput and have often impeded the quick development of new drug candidates. To overcome this problem, cassette dosing has become widely applied to PK screening using LC/MS/MS [5,6]. This technology has proven to be an effective method to improve the throughput of PK screening[7-9]. Cassette dosing has the advantage of testing more compounds in a shorter time using fewer animals; on the other hand, misleading PK results may be obtained due to problems such as drug-drug interactions [10,11]. Therefore, the error potentially incurred with cassette dosing for any single compound may be well within the variability encountered in discrete PK studies with relative few animals. Mice and rats are classically used for in vivo PK studies. Because of the size of the blood sample taken for analysis, different animals are generally used for each time point (mice) and even rats are limited to few bleeds. This leads to high animal usage. Furthermore, inter-individual variation is often high; e.g. plasma concentrations could range two-fold between animals resulting in high variation in the data and difficulties in interpretation due to the differences in the expression of drug metabolism enzymes and genetic polymorphism [12,13]. Therefore, a new method using blood samples from the same animal for all the time points (serial bleeding) will not only dramatically reduce the number of animals used but also increased the quality of the kinetic data for compounds compared in that animal. Furthermore, one could imagine that an analytical method using a minimal blood volume could also be used for therapeutic drug monitoring in humans. To our knowledge, two methods have been reported for PK analysis from serial bleeding of mice using LC/MS/MS. The first method is based on the analysis of 20 μL of whole blood using capillary LC/MS/MS [14]. The second method described the analysis of 10 μL of whole blood using a workstation [15]. Both methods demonstrate the feasibility of performing pharmacokinetic studies using a murine model but they did not validate accuracy and precision and the methods were applied to only one compound. Furthermore, these two methods could be problematic when applied to numerous samples. The relative short lifetime and low robustness of the capillary column reduces the accuracy of the analysis [14], and the workstation method requires precise collections of 10 μL [15].
Herein, we describe an LC/MS/MS analytical method for cassette dosing pharmacokinetic studies in mice from 5 μL samples of blood from successive bleeding of the tail vein (up to 10 per animal). The proposed method is statistically evaluated for use in high-throughput PK studies. Furthermore, this method is applied to determine PK parameters following intraperitoneal, oral or subcutaneous administrations of four soluble epoxide hydrolase (sEH) inhibitors [16]. These model chemicals, which have low nM Ki values with the recombinant enzyme [16], were recently implicated in the regulation of blood pressure and inflammation [17].
2. Experimental
2.1. Reagents and chemicals
Substituted urea epoxide hydrolase inhibitors (1-cyclohexyl-3-dodecyl urea, CDU; 12-(3-cyclohexyl-ureido)-dodecanoic acid, CUDA; 1-adamantyl-3-dodecyl urea, ADU; 12-(3-adamantyl-ureido)-dodecanoic acid, AUDA) and internal standard (1-cyclohexyl-3-tetradecyl urea, CTU) were synthesized previously in our laboratory [16]. HPLC-grade methanol, acetonitrile and ethyl acetate were purchased from EMD Chemicals Inc. (Gibbstown, NJ). Formic acid was obtained from Sigma-Aldrich (St. Louis, MO). Water (>18.0 M ) used was purified by NANO pure II system (Barnstead, Newton, MA).
2.2. Animals and dosing
All in vivo experiments were done following protocols approved by the U.C.D. Animal Use and Care Committee. Male Swiss Webster mice, 7 weeks old, were obtained from Charles River. The animals were used for pharmacokinetic studies based on a body-weight (range 28-36 g) using a stratified randomization procedure after a 1-2 week acclimation period. A 5 mg/kg dosing of these inhibitors (5 mM: dissolved in 4:96 DMSO:corn oil mixture) were orally, intraperitoneally or subcutaneously administered to mice. These routes of administration were selected to support a variety of biological models for cardiovascular and inflammatory indications. For cassette dosing, four inhibitors were dissolved at 5 mM in a 4:96 DMSO:corn oil mixture.
2.3. Blood sample preparation
After administration, serial tail bled blood samples (∼ 5 μL) were collected using heparinized tip at various time points (5 min to 24 h). The samples were transferred to a 1.5 mL microcentrifuge tube, weighed with an analytical balance and vortexed with 100 μL of purified water and 25 μL of internal standard (500 ng/mL CTU). The samples were then extracted with 500 μL of ethyl acetate. The organic layer was transferred to a 1.5 mL microcentrifuge tube, and dried under nitrogen. The residues were reconstituted in 25 μL of methanol. Aliquots (5 μL) were injected onto LC/MS/MS system.
2.4. Instrument
The LC/MS/MS analysis was performed using a Micromass Quattro Ultima triple quadrupole tandem mass spectrometer (Micromass, Manchester, UK) equipped with atmospheric pressure ionization source [atmospheric z-spray pressure chemical ionization (APcI) or electrospray ionization (ESI) interface]. The mass spectrometer was coupled to an HPLC system consisting of a Waters-2790 separations module (Waters Corporation, Milford, MA) including an auto-sampler with refrigerated sample compartment and inline vacuum degasser, and a Waters-2487 dual γ absorbance detector. For optimization of tandem MS conditions, samples were directly and continuously infused into the mass spectrometer. Data were analyzed with MassLynx software (Ver. 3.5).
2.5. LC/MS/MS conditions
The ESI mass spectrometer was operated in the positive ion mode with a capillary voltage at 1.0 kV. Cone gas (N2) and desolvation gas (N2) were maintained at flow rates of 130 and 630 L/h, respectively. The source and the desolvation temperature were set at 100 and 300°C, respectively. Optimum cone voltages were set at 80 V for ADU, AUDA and CDU, 85 V for CUDA and 100 V for CTU (internal standard). Mass spectra of the precursor ions were obtained by syringe pump infusions at the flow rate of 10 μL/min, while scanning over the range of 50-500 m/z at 3 s/scan. Data were acquired in the multi channel analysis (MCA) mode and continuum mode. Quantitative analysis was performed in the multiple reaction monitoring (MRM) mode with a dwell time of 600 ms. Ultra pure argon (99.9999%) was used as a collision gas at a pressure of 2.5 mt for collision-induced dissociation (CID). An XTerra™ MS C18 column (30 mm × 2.1 mm I.D., 3.5 μm; Waters Corporation) was used with a flow rate of 0.3 mL/min at ambient temperature. Chromatographic separation was performed using a two-solvent linear gradient system. Solvents A (water) and B (acetonitrile) contained both 0.1% formic acid. Solvents were filtered through 0.45 μm membrane and degassed before use. Mobile phases were mixed with a linear gradient from 40% B to 100% B in 5 min, and then isocratic for 8 min with 100% B. The column was equilibrated back to the initial conditions for 1 min before the next run. Five microliters of standard and the extracted blood samples were injected onto the column.
2.6. Standard solutions
Stock solutions (30-200 μg/mL) of ADU, AUDA, CDU, CUDA and CTU were prepared in methanol. Standard solutions were stored at 4°C in the dark. These solutions were further diluted with methanol to give a series of standards with concentrations ranging from 0.98 to 1000 ng/mL. An amount of 1 μg/mL standard solutions were prepared for MS optimization study. A stock solution of CTU to use as an internal standard was also prepared at 500 ng/mL. The quality control (QC) samples and calibration samples were prepared by adding 5 μL of standard solutions to 5 μL of mice drug free blank blood, followed by the addition of 25 μL of internal standard.
2.7. Method validation
The precision and accuracy of the method were determined by replicate analyses (n = 5) of murine blood containing the analytes at blood concentrations of 15.6, 62.5 and 250 ng/mL for all inhibitors in the calibration range. The calibration curves were calculated by weight (1/x) least-square linear regression analysis of the peak area ratio of analytes to internal standard versus the concentrations. The precision and the accuracy of the method were expressed as the relative standard deviations (RSD) and the percentage of the theoretically determined concentration occurring within (intra-) and between (inter-) run analysis, respectively. The limit of quantification (LOQ) of the method was determined by spiking an aliquot of blank mouse blood with sEH inhibitors at the concentration of the lowest calibrator with acceptable precision (<20%) and accuracy (± 20%). The limit of detection (LOD) was defined as the concentration which gave blank signal + 3S.D. on the calibration curve.
2.8. Pharmacokinetics analysis
The pharmacokinetic parameters were obtained by fitting the blood concentration-time data to a noncompartmental model with the WinNonlin software (Pharsight, Mountain View, CA). Parameters estimated included elimination rate constant (γz), the time of maximum concentration (Tmax), the maximum concentration (Cmax), elimination half-life (T½), area under the concentration-time curve to terminal time (AUCt), area under the concentration-time curve to infinite time (AUC ∞) and the mean residence time (MRT). AUCt was calculated by the linear/log trapezoidal rule. The comparison of PK parameters was performed with AUC value and/or maximum concentration of compounds. The means and variances of each parameter (n = 3-5) were statistically analyzed by the Student’s T-test and F-test, respectively. The average analysis (T-test) was done assuming unequal variances. Both tests were performed with p < 0.05 using Microsoft Excel.
3. Results and discussion
3.1. Optimization of LC/MS/MS method
1-Cyclohexyl-3-dodecyl urea (CDU), 12-(3-cyclohexylureido)-dodecanoic acid (CUDA) and 1-cyclohexyl-3-tetradecyl urea (CTU, internal standard) tandem mass conditions were optimized previously [16,17]. 1-Adamantyl-3-dodecyl urea (ADU) and 12-(3-adamantyl-ureido)-dodecanoic acid (AUDA) analysis conditions were optimized in positive mode for the both compounds and in negative mode for AUDA; abundances of precursor were similar in both mode. For all compounds, the precursor ion [M +H]+ was the most abundant ion as base peak.Table 1 shows the optimum tandem mass conditions for sEH inhibitors in positive mode. Daughter ions were first optimized under various collision voltages (from 10 to 35 eV). The dominant daughter ions from all analytes, which were formed by a bond cleavage between a nitrogen atom and a carbon atom, were used for the MRM scan. In negative mode, the dominant daughter ion from AUDA was 10-fold less abundant than in the positive mode. Total ion chromatogram and MRM profiles of sEH inhibitor standards under ESI tandem mass conditions are shown in Fig. 1. All analytes were separated within 7 min under these HPLC conditions (see Section 2).
Table 1.
Optimum tandem mass conditions and chemical structures of the sEH inhibitors
| Compounds | Precursor ions, m/z [M + H]+ | Product ions, m/z (relative abundance, %) | Structure and transition | |
|---|---|---|---|---|
| CDU | 311 | -27 | 311 (4), 229 (100), 186 (41) | 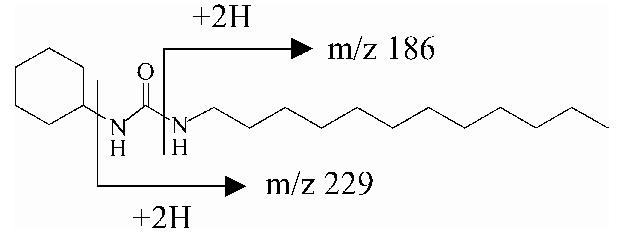 |
| CUBA | 341 | -25 | 341 (6), 216 (32), 198 (100) | 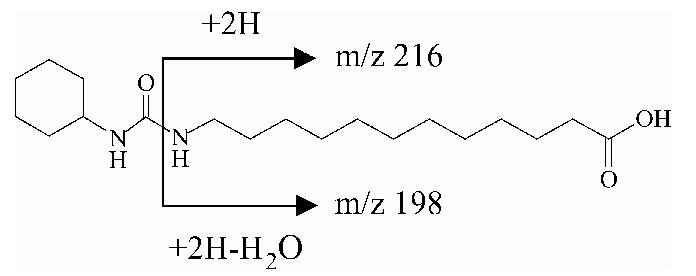 |
| ADU | 363 | -25 | 363 (9), 186 (3), 135 (100) |  |
| AUDA | 393 | -27 | 393 (1), 216 (32), 198 (29), 135 (100) |  |
Fig. 1.
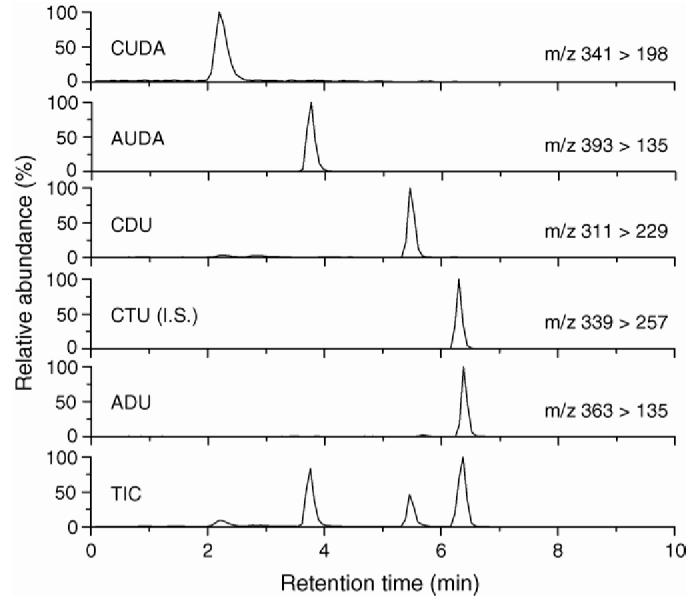
. Total ion chromatogram (TIC) and MRM profiles of sEH inhibitors. CUDA, AUDA, CDU and ADU refer to the compounds used. CTU is the internal standard (IS).
3.2. Analysis of blood samples
Mice were used in this study to evaluate the technology because most transgenic models are murine. However, the technology can be applied to a number of species. In developing a high throughput pharmacokinetic method, we came across several technical problems. In classical pharmacokinetic studies, plasma, isolated from whole blood is commonly used for analyte concentration determination leading to a relatively large sample volume. With blood samples from the tail vein of less than 5 μL, we were obliged to work directly with the whole blood, although subsequently we devised micro methods to obtain plasma. In separate experiments (data not shown) we found a dose correlation between data from whole blood and plasma with a small increase in signal to noise when plasma was used for analysis. Our main problem was accuracy in collecting the small volume of blood in due to its high viscosity and clotting. To overcome the clotting problem, blood samples were collected into anticoagulant buffer [15]. This method is useful to prevent coagulation, however, the collection volume must be known precisely. Instead of trying to collect a fixed volume, we precisely weighed the quantity of blood taken. Because the density of the blood is 1.05, the volume analyzed could be easily calculated. This manual weighing step did not significantly delay the sample preparation procedure. To further prevent coagulation, heparinized tips were used to collect the blood. The preparation steps of these samples can affect sensitivity, specificity, precision and accuracy of the analytical method used. LC/MS/MS methods are particularly sensitive to co-eluting matrix components [20,21]. There are three commonly used approaches for off-line sample preparation for PK studies: solid-phase extraction (SPE) [22], liquid-liquid extraction [23] and protein precipitation [24]. A liquid-liquid extraction method was used for sample preparation from whole blood because it can be designed to be highly selective. This yields clean sample extracts. Analysis of spiked blood samples after ethyl acetate extraction showed that each of the analyte peaks were clearly observed in MRM profiles without interfering background peaks. Furthermore, good recoveries (Table 2) were obtained, even if a small final volume (<25 μL) was used to reconstitute the samples.
Table 2.
Precision and accuracy data for and sEH inhibitors in whole blood from mice
| sEH inhibitors | Nominal concentration (ng/mL | Interday 1 |
Interday 2 |
Interday 3 |
Interday accuracy mean recoverya (%) | |||
|---|---|---|---|---|---|---|---|---|
| Mean accuracyb (%) | Precisionb (RSD, %) | Mean accuracyb (%) | Precisionb (RSD, %) | Mean accuracyb (%) | Precisionb (RSD, %) | |||
| ADU | 15.6 | 97.7 | 3.0 | 109.0 | 1.8 | 91.6 | 1.1 | 99.4 |
| 62.5 | 98.6 | 3.2 | 100.1 | 1.2 | 87.8 | 4.0 | 95.5 | |
| 250.0 | 97.7 | 1.3 | 98.6 | 0.9 | 94.1 | 1.8 | 96.8 | |
| AUDA | 15.6 | 96.7 | 4.4 | 100.6 | 6.3 | 98.9 | 5.1 | 98.7 |
| 62.5 | 97.3 | 1.9 | 94.1 | 5.5 | 92.4 | 1.4 | 94.6 | |
| 250.0 | 95.5 | 5.4 | 96.7 | 4.9 | 94.8 | 3.1 | 95.7 | |
| CDU | 15.6 | 97.1 | 2.4 | 97.8 | 4.8 | 100.4 | 2.9 | 98.4 |
| 62.5 | 99.1 | 2.2 | 94.7 | 1.2 | 95.5 | 3.0 | 96.4 | |
| 250.0 | 97.0 | 3.2 | 97.9 | 3.1 | 96.1 | 3 0 | 97.0 | |
| CUBA | 15.6 | 99.4 | 6.9 | 101.8 | 6.6 | 100.0 | 3 9 | 100.4 |
| 62.5 | 95.9 | 4.5 | 91.8 | 5.1 | 95.5 | 37 | 94.4 | |
| 250.0 | 93.3 | 8.5 | 95.1 | 5.6 | 95.8 | 7 1 | 94.7 | |
Intraday, n = 15.
Intraday, n = 5.
3.3. Calibration, precision and accuracy
Calibration curves were constructed on three different days over a 0.98-1000 ng/mL range using spiked blank murine blood samples. For all analytes, good linearity was obtained in the specified concentration range. The correlation coefficients for the calibration regression lines were over 0.998. LODs were calculated using calibration curves for all analytes, and were as follows: 0.1 ng/mL for ADU and AUDA, 0.5 ng/mL for CDU and 0.8 ng/mL for CUDA. For ADU and AUDA, the dominant product ion is derived from adamantyl (m/z 135). It is highly abundant and stable in the positive mode [18], leading to the 10-fold higher sensitivity difference observed compared to CDU and CUDA. The high sensitivity and the unique fragmentation derived from the adamantyl moiety facilitate the drug discovery process, such as the PK screening of drug candidates. Furthermore, this fragmentation pattern could facilitate the identification of metabolites without the use of radioisotopes [19].
The intra-assay precision and accuracy for the assay method were determined by analyzing five replicates at 15.6, 62.5 and 250 ng/mL for all analytes. Table 2 summarizes individual and mean accuracy values for all analytes and corresponding RSDs for all QC samples. The intraday mean accuracy values for all analytes ranged from 87.8 to 100.4%, and the intraday precision for all analytes was less than 10% RSD. These values are acceptable for PK study demonstrating the strength of the analytical method used.
3.4. Pharmacokinetic from individual and cassette dosings
Using the optimized LC/MS/MS method, individual pharmacokinetic studies were performed on the four sEH inhibitors from serial bleeding of mice after intraperitoneal (i.p.), oral gavage (o.g.) or subcutaneous (s.c.) dosing. Solubility of the tested compounds in the carrier is critical regardless of the method of delivery. The four structurally similar inhibitors used in this study are known for their low solubility in many solvents [25]. For compounds such as these with high melting points and high log P, crystalline materials have low oral availability. We found that a 4:96 DMSO:corn oil mixture maintained the compounds in solution indefinitively.
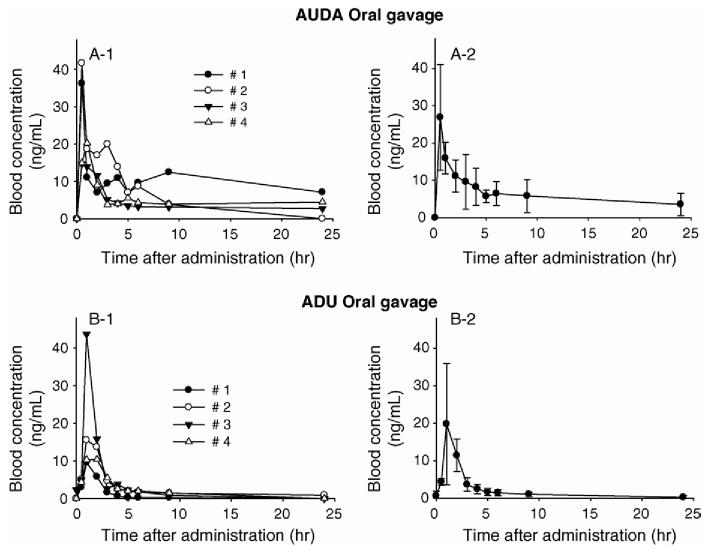
We first determined the blood time profiles of two sEH inhibitors with individual dosing following oral gavage (Fig. 2). As one could expect, at any time point huge variations (up to 200%) were observed between individuals (Panels A-1 and B-1), which underlines the difficulties in obtaining reliable pharmacokinetic data from individual animals for each time point. However, for all the mice used, we obtained similar time profiles of sEH inhibitor blood concentrations (Fig. 2) illustrating the advantage of using results from a same animal over the whole time course for PK calculation. Pharmacokinetic parameters given in Table 3 were calculated from the average of the four mice used at each time point (Panels A-2 and B-2 on Fig. 2). Interestingly, we were not able to determine PK parameters for CDU and CUDA following oral gavage. The blood concentrations obtained for these two compounds (data not shown) were too close to the LOD to accurately calculate any PK parameters, reflecting a lower oral bioavailability of the two cyclohexyl derivatives (CDU and CUDA) compared to the corresponding adamantyl compounds (ADU and AUDA).
Fig. 2.
Blood concentration-time profiles of sEH inhibitors after individual oral gavage of 5 mg/kg. (A) AUDA; 1, individual mice; 2, average and S.D. of four mice. (B) ADU; 1, individual mice; 2, average and S.D. of four mice.
Table 3.
Pharmacokinetic parameters in mice following intraperitoneal, oral and subcutaneous closes of 5 mg/kg sEH inhibitors
| AUDA |
ADU |
CUBA | CDU | |||||
|---|---|---|---|---|---|---|---|---|
| IPa | SCb | OGc | IPa | SCb | OGc | IPa | IPa | |
| γz(h -1)d | 0.06 | 0.12 | 0.10 | 0.08 | 0.01 | 0.11 | 0.50 | 0.05 |
| Tmax (h)e | 0.1 | 0.1 | 0.5 | 1.0 | 2.0 | 1.0 | 0.1 | 2.7 |
| Cmax (ng/mL)f | 1225 | 369 | 27 | 17 | 4 | 20 | 871 | 21 |
| T½ (h)g | 12.3 | 6.0 | 7.3 | 8.2 | 53.3 | 6.4 | 1.4 | 14.2 |
| AUCt (ng/mL h)i | 451 | 1076 | 151 | 112 | 77 | 47 | 262 | 250 |
| AUC8 (ng/mL h)j | 533 | 1163 | 188 | 131 | 293 | 48 | 269 | 381 |
| MRT (h)h | 4.9 | 6.4 | 9.2 | 8.1 | 11.6 | 4.4 | 0.9 | 10.2 |
Results were calculated from averaged analytical measurement of four mice.
Intraperitoneal.
Subcutaneous.
Oral gavage.
Elimination rate constant.
Time of maximum concentration.
Maximum concentration.
Elimination half-life.
Area under the concentration (0-t).
Area under the concentration (0-8).
Mean residence time.
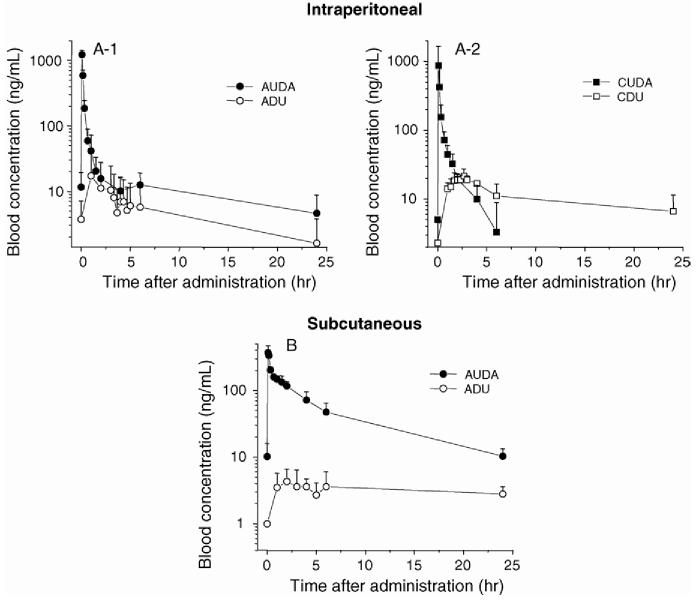
Fig. 3 illustrates blood concentration-time profiles of four sEH inhibitors with individual dosing following i.p. and s.c. administration. In mice given an i.p. dose of CUDA and AUDA, the maximum blood concentrations (800-1200 ng/mL) were observed at 5 min following dosing. On the other hand, the maximum blood concentrations of ADU and CDU were very low. Using a noncompartmental model with the WinNonlin software, we determined PK parameters for the four studied compounds individually (Table 3). AUDA and CUDA were designed to improve solubility over ADU and CDU, respectively [16]. As shown in Table 3, compared to ADU, the PK parameters of AUDA were improved with all the dosing methods used. How-ever, no improvement of PK parameters for CUDA was observed compared to CDU, except for the maximum concentration. This is an interesting observation since cyclohexyl and adamantly moieties have very similar linear free energy descriptors. However, adamantine does contribute some intriguing physical properties. For example, AUDA is significantly more water soluble than CUDA [16]. From these results, it was demonstrated that the proposed method can be used for PK studies.
Fig. 3.
. Blood concentration-time profiles of sEH inhibitors in male mice. (A) A 5 mg/kg dosing of AUDA, ADU, CUDA or CDU was intraperitoneally administered. (B) A 5 mg/kg dosing of AUDA or ADU was subcutaneously administered. Datum points represent the mean ±S.D. ( n = 3).
We then tested the effect of cassette dosing on the pharmacokinetic parameters. Fig. 4 illustrates PK profiles of inhibitors after cassette dosing and individual dosing of oral administration. As obtained for the individual dosing, the blood concentrations of CDU and CUDA in the cassette dosing experiment were too low to be accurately determined. Therefore, we were able to calculate PK parameters only for ADU and AUDA. Pharmacokinetic parameters determined from cassette dosing versus individual dosing are summarized in Table 4. The PK profiles of ADU and AUDA after cassette dosing were similar to the profiles of individual dosing, except for the AUC of AUDA. It is suggested that the AUC value is considerably affected by the 24 h blood concentration, and the concentration of AUDA at this time point included some error since concentrations were close to the limit of quantification. However, the AUC values within 9 h were similar to each other, as shown in Table 4. Overall, similar results were obtained for the four compounds tested following both individual and cassette oral dosing. From these results, we confirm that the proposed method is applicable to high-throughput PK studies for this series of compounds.
Fig. 4.
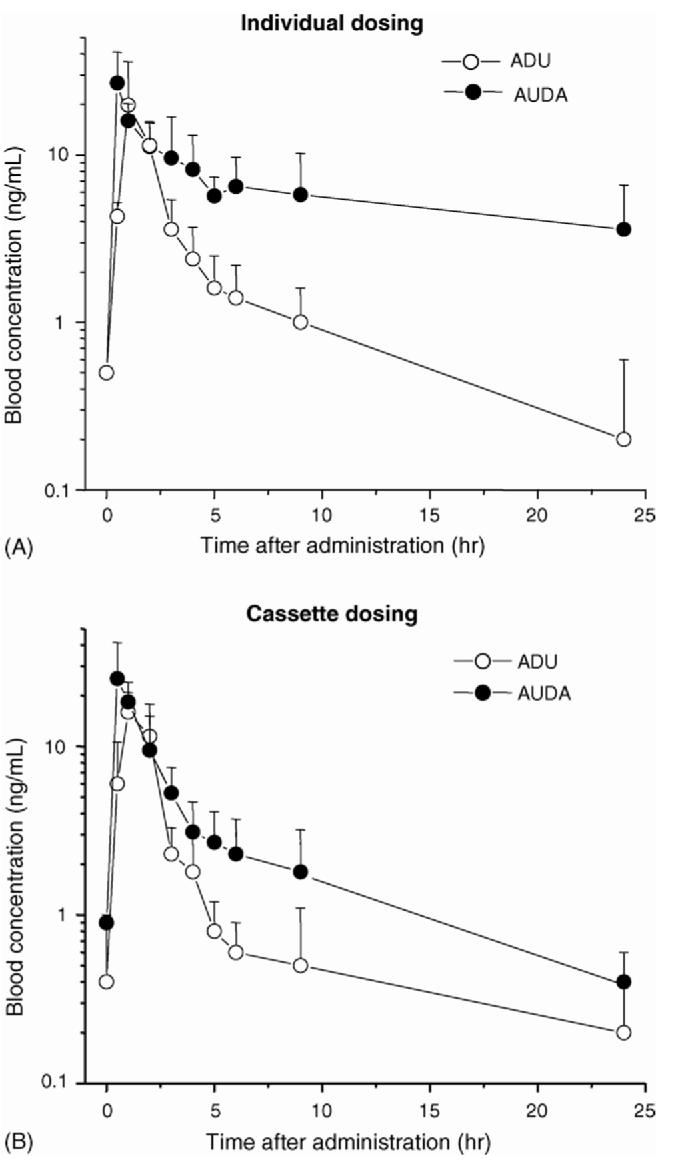
Blood concentration-time profiles of sEH inhibitors after cassette dosing and individual dosing 5 mg/kg of AUDA or ADU by oral administration. (A) Individual dosing; (B) Cassette dosing. For both dosing method, at least four mice were used for each datum points.
Table 4.
Pharmacokinetic parameters of cassette vs. individual dosing following oral gavage in mice at a 5 mg/kg close of sEH inhibitors
| AUDA |
ADU |
|||
|---|---|---|---|---|
| Individual | Cassette | Individual | Cassette | |
| γz(h-1)a | 0.17 ± 0.05 | 0.15 ± 0.05 | 0.13 ± 0.05 | 0.08 ± 0.005† |
| Tmax (h)b | 0.7 ± 0.2 | 0.7 ± 0.3 | 1.0 ± 0.0 | 1.3 ± 0.6 |
| Cmax (ng/mL)c | 26 ± 12 | 29 ± 11 | 21 ± 19 | 17 ± 7 |
| T ½ (h)d | 4.4 ± 1.3 | 48 ± 1.3 | 6.2 ± 3.3 | 8.7 ± 0.6 |
| AUC9 (ng/mL h)e | 75 ± 7 | 53 ± 8 | 38 ± 2 | 32 ± 9 |
| AUCt (ng/mL h)f | 115 ± 14 | 66 ± 12* | 43 ±23 | 37 ± 5 |
| AUC8 (ng/mL h)g | 133 ± 18 | 69 ± 12* | 44 ± 22 | 40 ± 4 |
| MRT (h)h | 7.9 ± 2.6 | 4.9 ± 0.4 | 3.9 ± 0.9 | 4.2 ± 2.1 |
Results are means S.D. from four animals.
Elimination rate constant.
Time of maximum concentration.
Maximum concentration.
Elimination half-life.
Area under the concentration (0-9).
Area under the concentration (0-t).
Area under the concentration (0-m).
Mean residence time.
Significantly different from individual using F-test (p < 0.05).
Significantly different from individual by T-test (p < 0.05).
In drug discovery using classical PK methods, large numbers of animals are needed, e.g. for four compounds and 10 time points 40 animals are required, leading to high cost and slow turn over. Furthermore, because of high inter-individual variability a large number of repeats (n = 5-10) are needed, multiplying the above number to 200-400 mice. The serial method proposed allows the use of only one mouse for all time points, which reduces animal usage. In our example, only four mice were needed to test four compounds. Furthermore, because the same animal is used, the variability in the data is greatly reduced. This justifies a decrease in the number of replicates, leading to the use of only 12-20 animals for the same quality of data. This method allows one to compare compounds with each other in a single animal and allows the scientist to distinguish interindividual variation from other factors. Finally, the number of animals used could be further reduced using cassette dosing. In this laboratory we screen compounds for pharmacokinetics in cassettes of four, leading to the use of only 3-5 animals to obtain the PK parameters of four compounds.
The data in Table 4 and Fig. 4 indicate that with these compounds the blood profiles and the pharmacokinetic parameters determined after cassette and individual dosing were very similar. Certainly the data from the two techniques support the same relative ranking of compounds, which is the basis for screening large number of potential drugs. Trauma to animals was reduced dramatically because a child’s lancet could be used to obtain sufficient blood for an assay. However, there are many considerations before applying these techniques to any compound. For example, applicability of the method clearly depends upon superb analytical technology, and even with excellent technology, the difficulty of searching for metabolites is increased. Even with minimal animal trauma, serial bleeding may alter the physiological state of the animal. For example, microsampling will increase the amount of inflammatory eicosanoids in blood and may decrease the proportion of cellular components in a sample. These and other potential problems were easily addressed in the case of these novel anti-hypertensive compounds, but this will not always be the situation. However, the positive correlations between the data obtained with cassette and conventional dosing suggest that cassette technology should be given consideration when planning early stage pharmacokinetic experiments.
4. Conclusions
These results indicate that this method may offer advantages for high-throughput PK studies. Furthermore, the very high sensitivity of LC/MS/MS technology has also allowed us to use very small blood samples to monitor human pharmaceuticals with reduced trauma to the patient (data not shown). When using such technology one must be aware of possible drug-drug interactions, analytical complications resulting from multiple target analytes, and the limitations of working with a small sample size. In our hands, we have found these potential problems simple to address. We should take care to minimize the misleading PK parameters derived from drug-drug interactions in cassette dosing, and should limit the total number of compounds in cassette to five or less as shown in this paper.
Acknowledgments
This work was supported in part by NIEHS Grant R37 ES02710, NIEHS Superfund Basic Research Program Grant P42 ES04699 and NIEHS Center for Environmental Health Sciences Grant P30 ES05705 and NIH/NHLBI Grant HL59699-06A1.
References
- [1].Merlot C, Domine D, Cleva C, Church DJ. Drug Discov. Today. 2003;8:594. doi: 10.1016/s1359-6446(03)02740-5. [DOI] [PubMed] [Google Scholar]
- [2].Hogan JC. Nat. Biotechnol. 1997;15:328. doi: 10.1038/nbt0497-328. [DOI] [PubMed] [Google Scholar]
- [3].Bleicher KH, Böhm H-J, Müller K, Alanine AI. Nature Rev. Drug Discov. 2003;2:369. doi: 10.1038/nrd1086. [DOI] [PubMed] [Google Scholar]
- [4].Kuhlmann J. Arzneimittelforschung. 2004;54:251. [Google Scholar]
- [5].Ohkawa T, Ishida Y, Kanaoka E, Takahashi K, Okabe H, Matsumoto T, Nakamoto S, Tamada J, Koike M, Yoshikawa T. J. Pharm. Biomed. Anal. 2003;31:1089. doi: 10.1016/s0731-7085(02)00649-0. [DOI] [PubMed] [Google Scholar]
- [6].Zeng H, Wu JT, Unger SE. J. Pharm. Biomed. Anal. 2002;27:967. doi: 10.1016/s0731-7085(01)00541-6. [DOI] [PubMed] [Google Scholar]
- [7].Hop C, Wang Z, Chen Q, Kwei G. J. Pharm. Res. 1998;15:901. doi: 10.1021/js970486q. [DOI] [PubMed] [Google Scholar]
- [8].Bryant M, Korfmacher W, Wang S, Nardo S, Nomeir A, Lin C. J. Chromatogr. 1997;777:61. doi: 10.1016/s0021-9673(97)00561-x. [DOI] [PubMed] [Google Scholar]
- [9].Olah T, McLoughlin D. J. Rapid Commun. Mass Spectrom. 1997;11:17. doi: 10.1002/(SICI)1097-0231(19970115)11:1<17::AID-RCM812>3.0.CO;2-N. [DOI] [PubMed] [Google Scholar]
- [10].Allen MC, Shah TS, Day WW. Pharm. Res. 1998;15:93. doi: 10.1023/a:1011909022226. [DOI] [PubMed] [Google Scholar]
- [11].Manitpisitkul P, White RE. Drug Discov. Today. 2004;15:625. doi: 10.1016/S1359-6446(04)03137-X. [DOI] [PubMed] [Google Scholar]
- [12].Kitteringham NR, Davis C, Howard N, Pirmohamed M, Park BK. J. Pharmacol. Exp. Ther. 1996;278:1018. [PubMed] [Google Scholar]
- [13].Liggett SB. Nat. Rev. Genet. 2004;5:657. doi: 10.1038/nrg1429. [DOI] [PubMed] [Google Scholar]
- [14].Fraser IJ, Dear GJ, Plumb R, L’Affineur M, Fraser D, Skippen AJ. J. Rapid Commun. Mass Spectrom. 1999;13:2366. doi: 10.1002/(SICI)1097-0231(19991215)13:23<2366::AID-RCM800>3.0.CO;2-D. [DOI] [PubMed] [Google Scholar]
- [15].Bateman KP, Castonguay G, Xu L, Rowland S, Nicoll-Griffith DA, Kelly N, Chan Chi-C. J. Chromatogr. B. 2001;754:245. doi: 10.1016/s0378-4347(00)00612-5. [DOI] [PubMed] [Google Scholar]
- [16].Morisseau C, Goodrow MH, Newman JW, Wheelock CE, Dowdy DL, Hammock BD. Biochem. Pharmacol. 2002;63:1599. doi: 10.1016/s0006-2952(02)00952-8. [DOI] [PubMed] [Google Scholar]
- [17].Morisseau C, Hammock BD. Annu. Rev. Pharmacol. Toxicol. 2005;45:311. doi: 10.1146/annurev.pharmtox.45.120403.095920. [DOI] [PubMed] [Google Scholar]
- [18].Watanabe T, Hammock BD. Anal. Biochem. 2001;229:227. doi: 10.1006/abio.2001.5423. [DOI] [PubMed] [Google Scholar]
- [19].Watanabe T, Morisseau C, Newman JW, Hammock BD. Drug Metab. Dispos. 2003;31:846. doi: 10.1124/dmd.31.7.846. [DOI] [PubMed] [Google Scholar]
- [20].Matsuzewski BK, Constanzer ML, Chavez-Eng CM. Anal. Chem. 1998;70:882. doi: 10.1021/ac971078+. [DOI] [PubMed] [Google Scholar]
- [21].King R, Bonfiglio R, Fernandez-Metzler C, Miller-Stein C, Olah T. J. Am. Soc. Mass Spectrom. 2000;11:942. doi: 10.1016/S1044-0305(00)00163-X. [DOI] [PubMed] [Google Scholar]
- [22].Tessier E, Neirinck L, Zhu Z. J. Chromatogr. B. 2003;798:295. doi: 10.1016/j.jchromb.2003.09.054. [DOI] [PubMed] [Google Scholar]
- [23].Chen X, Zhong D, Liu D, Wang Y, Han Y, Gu J. J. Rapid Commun. Mass Spectrom. 2003;17:2459. doi: 10.1002/rcm.1189. [DOI] [PubMed] [Google Scholar]
- [24].Lin CC, Yeh LT, Lau JY. J. Chromatogr. B. 2002;779:241. doi: 10.1016/s1570-0232(02)00379-3. [DOI] [PubMed] [Google Scholar]
- [25].Kim I, Morisseau C, Watanabe T, Hammock BD. J. Med. Chem. 2004;47:2110. doi: 10.1021/jm030514j. [DOI] [PubMed] [Google Scholar]


