

Abstract
Individual variation in gene expression is important for evolutionary adaptation1,2 and susceptibility to diseases and pathologies3,4. In this study, we address the functional importance of this variation by comparing cardiac metabolism to patterns of mRNA expression using microarrays. There is extensive variation in both cardiac metabolism and the expression of metabolic genes among individuals of the teleost fish Fundulus heteroclitus from natural outbred populations raised in a common environment: metabolism differed among individuals by a factor of more than 2, and expression levels of 94% of genes were significantly different (P < 0.01) between individuals in a population. This unexpectedly high variation in metabolic gene expression explains much of the variation in metabolism, suggesting that it is biologically relevant. The patterns of gene expression that are most important in explaining cardiac metabolism differ between groups of individuals. Apparently, the variation in metabolism seems to be related to different patterns of gene expression in the different groups of individuals. The magnitude of differences in gene expression in these groups is not important; large changes in expression have no greater predictive value than small changes. These data suggest that variation in physiological performance is related to the subtle variation in gene expression and that this relationship differs among individuals.
Variation in gene expression among outbred natural populations can arise from genetic, environmental, developmental or random biological effects. Considerable variation in mRNA expression has been documented. Among the teleost fish Fundulus,18%of ∼1,000 cardiac genes had significantly different levels of gene expression among individuals within a population5. Similarly, ∼24% of loci differ in expression among strains of yeast6 and among fruit fly genotypes7. As many as 50% of alleles at a locus have quantitative differences in gene expression due to cis-acting factors8. Additionally, ∼20–33% of the interindividual variation in gene expression is due to heritable variation in trans-acting factors9,10. Other factors contribute to variation in gene expression: differences in immune status may explain the 3.3% difference in gene expression among genetically identical mice11.
Individual humans have substantial differences in gene expression between blood samples12,13, partly due to changes in white blood cell constituency and sampling day. Yet, even with this biological variation, consistent gene expression patterns describe differences between individuals13. Whether this natural variation in gene expression affects physiological performance or health needs to be investigated.
To investigate the functional importance of natural variation in gene expression, we compared variation in cardiac metabolism with cardiac gene expression among 16 individuals from two populations of the killifish Fundulus heteroclitus. Local populations of Fundulus are large (>10,000 individuals) and distributed along the eastern coast of North America. Migration among populations minimizes random genetic drift14 but is not frequent enough to extinguish local adaptation15,16. These population characteristics make F. heteroclitus an ideal species in which to investigate natural variation.
We first determined the rate of cardiac metabolism using three different substrates: glucose, fatty acid, and lactate, ketones and alcohol (LKA). For each substrate, we measured metabolism in triplicate from isolated heart ventricles and then isolated RNA and used it for microarray analyses. Because we raised the fish in a common environment for >9 months, differences among individuals represent genetic and other biological variation expected to be found among outbred organisms, including humans.
Cardiac metabolism (corrected for body mass) varied 2.25- to 11-fold among the 16 individuals, depending on substrate (Fig. 1 and Supplementary Table 1 online). The ability of an individual to use a substrate also varied: individuals that were good at metabolizing one substrate often were inferior at using other substrates (Fig. 1), and the correlations between substrate-specific metabolism were not significant (r < 0.4). Even with large variation within populations, there were significant differences between populations: northern populations had significantly greater metabolic rates for glucose and fatty acid (P < 0.02) and nearly significantly greater rates for LKA (P = 0.06; P values are not adjusted for multiple testing).
Figure 1.
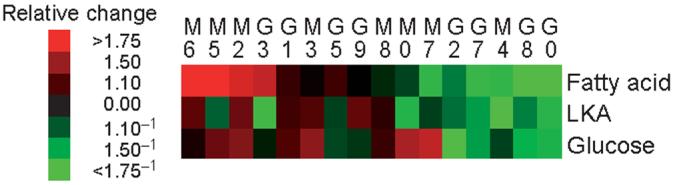
Cardiac metabolism among 16 individuals (identified by numbers) from populations from northern Maine (M) and southern Georgia (G) using three substrates: 5 mM glucose; fatty acid (1 mM palmitic acid bound to bovine serum albumin); and LKA (5 mM lactate, 5 mM each of two ketones: hydroxybutyrate and acetoacetate, and 0.1% ethanol). Two inhibitors of glucose utilization (20 mM 2-deoxyglucose and 10 mM iodoacetate) were included with fatty acid and LKA. Relative changes are based on residuals from log-regression of body mass with metabolic rates and refer to the ratio of the individual value to the overall mean. Principal component analysis among the 16 individuals for all three measures of metabolism was used to order individuals with respect to overall metabolism. The first principal component factor captures 78% of the variation in metabolism and can be thought of as a weighted average for each substrate.
To precisely measure mRNA expression for enzymes that might affect metabolism, we examined 119 metabolic genes using microarrays in a loop design with 16-fold replication17,18. The expression of 94% of genes (112 of 119) was significantly different among individuals in a population (P ≤ 0.01; Fig. 2 and Supplementary Table 2 online). We determined significance using a nested analysis of variance5 (ANOVA). An ANOVA calculates F statistics, and significant F values require variance among samples to be significantly larger than underlying variation19. Thus, the high proportion of significant differences between individuals may reflect the precision of microarray measurements (average coefficient of variation for the 16 replicate measures is 2.6%). To examine type I errors among all 119 genes, we computed 1,000 permutations of the original data across all genes and identified the maximum F value among each permuted set20. Using the multiple test–corrected F statistic (P = 2.5 × 10⁻⁴), expression of 84% of genes (100 of 119) was significantly different. Using Bonferroni's correction yielded the same result. To examine whether one or a few individuals account for this high variation in gene expression, we determined the number of genes whose expression was significantly different for all permutations of six out of eight individuals for each population. In the northern population, 112 genes, on average, had significantly different expression (P < 0.01, range 104–117). In the southern population, 94 genes had significantly different expression (P < 0.01, range 82–106). These data indicate that the statistically significant differences in gene expression were not due to one or few individuals or to experimental procedures affecting one or few individuals. These differences do not reflect obvious biological differences; all individuals were healthy, postreproductive males. Body mass (range 4.8–31.8 g) also had little effect on gene expression: only 2 of 119 genes (1.7%) correlated significantly (P < 0.05) with body mass.
Figure 2.
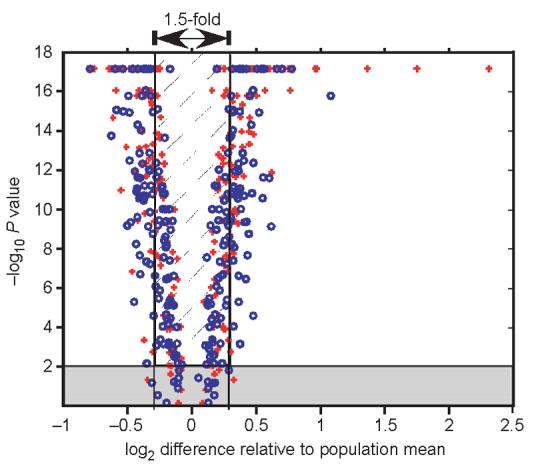
Significant differences in gene expression in a population versus difference relative to the population mean. The x axis shows log2 values for the ratio of minimum (negative log2 values) and maximum values (positive log2 values) relative to population mean. The y axis shows negative log10 values of P values for significant differences in a population (e.g., 4 is equal to a P value of 10−4. The gray horizontal box encloses genes with nonsignificant differences in a population (P > 0.01). Vertical lines enclose values where minimum and maximum values differ by a factor of <1.5. All P values less than 10−17 are truncated to equal 10−17. Blue circles indicate individuals from northern Maine; red crosses, individuals from southern Georgia.
Technical differences probably do not cause the gene expression differences among individuals in a population. All samples were collected in the morning during a 2-d period, and populations were randomly associated with days. Additionally, the large number of differences in gene expression was found in each population separately. Finally, if technical variation was large, statistically significant associations between gene expression and measures of metabolism would have been difficult to find.
Although abundant variation occurred among individuals in populations, the expression of 10% of genes (12 of 119) was significantly different between populations (Supplementary Table 3 online). After a multiple test Fmax20 correction (P < 5.9 × 10⁻⁴), 4 of the 12 differences between populations were significant. The differences between populations provide additional evidence for the substantial variation in gene expression in a species.
Hierarchical clustering of gene expression (Fig. 3) formed three groups of individuals. All three groups consisted of individuals from both populations, and gene clusters were not associated with enzymes from one particular pathway. Among groups, gene expression patterns alternated (Fig. 3b): genes upregulated in individuals from group 2 were downregulated in individuals from group 3 and vice versa. The correlations for gene expression among individuals and between these groups reflect this alternating pattern of expression: the correlation coefficient between groups 1 and 3 was −0.58 (P < 0.01), between groups 2 and 3 was −0.87 (P < 0.01) and between groups 2 and 1 was 0.11 (P > 0.05), whereas all 21 significant correlations among individuals in a group were positive (Supplementary Table 4 online). There were fewer differences in gene expression among grouped individuals (74–90) than within populations (112) and more differences between groups (50) than between populations (12). These two observations are improbable (P < 0.01) based on random permutations of the data.
Figure 3.

Hierarchical cluster of metabolic gene expression. Average level of expression for each individual (16 replicates per individual). Individuals (columns) with similar patterns of expression among genes are grouped together, and genes (rows) with similar expression among individuals are grouped together. (a) All 119 metabolic genes. Gene names are supplied in Supplementary Table 2 online. Blue gene trees (left) are shown in b. (b) Select clusters of genes emphasizing alternating patterns of up-down regulations. For a and b, colors are same as in Figure 1. Center correlation with complete linkage was used. Individuals (identified by numbers) are from populations from northern Maine (M) and southern Georgia (G).
Are these patterns (the 94% of loci that differ in expression and the alternating pattern of expression) functionally important? We observed no obvious relationship between patterns of gene expression and metabolism, by arranging individuals according to the overall level of metabolism (Fig. 4). Even among individuals with similar cardiac metabolism (e.g., individuals G8 and G0), gene expression for the three metabolic pathways was highly variable.
Figure 4.
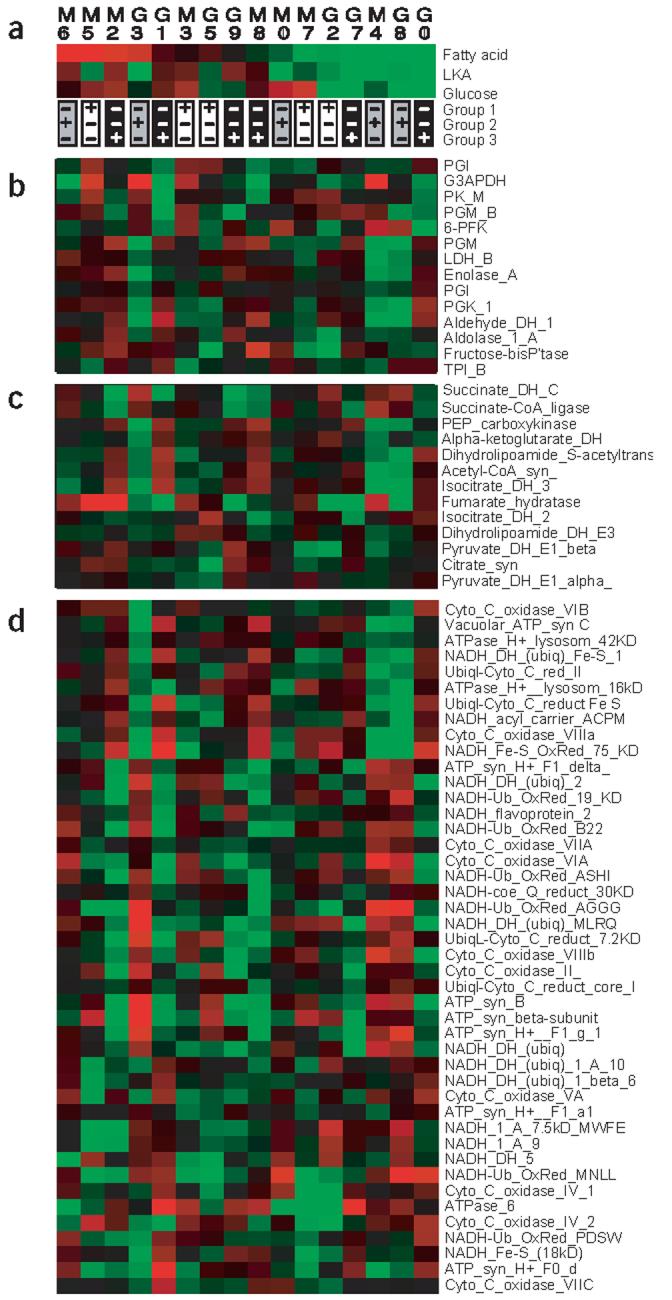
Pattern of gene expression arranged according to metabolic rates. (a) Cardiac metabolic rates for the 16 individuals (identified by numbers) from populations from northern Maine (M) and southern Georgia (G; as in Fig. 1). Groups of individuals (based on overall similarities in gene expression; Fig. 3) are indicated. (b–d) Gene expression for glucose metabolic enzymes, TCA enzymes and proteins involved in oxidative phosphorylation (Supplementary Table 5 online). Metabolic enzymes are based on the Kyoto Encyclopedia of Genes and Genomes.
To examine whether patterns of gene expression in groups are related to metabolism, we calculated two principal components (PC1 and PC2) for gene expression from each of the three metabolic pathways (glucose metabolism, tricarboxylic acid (TCA) and oxidative phosphorylation enzymes; Supplementary Table 5 online). Principal components reduce the number of variables to a few factors by calculating linear weighted combinations of the measures of gene expression (Supplementary Table 6 online). Thus, the pattern of expression for 15 glucose enzymes, 13 TCA enzymes or 45 oxidative phosphorylation enzymes is summarized by six values for each individual: one value for PC1 and PC2 for each of the three metabolic pathways.
The weighting of genes in principal components for glucose metabolism, TCA and oxidative phosphorylation supports previous analyses and suggests that expression of all enzymes is not equally important (Supplementary Table 6 online). PC1 of glucose metabolic genes weights G3PDH, PFK and PK most heavily. This supports previous work showing that variation in G3PDH and PK enzyme activities was adaptively important and affected cardiac metabolism in Fundulus21,22. Fumarate hydratase is the most important of TCA metabolic genes, and for oxidative phosphorylation genes, three of seven relatively large weighting factors are subunits of NADH dehydrogenase.
Most variation in cardiac metabolism is explained by combinations of gene expression (Fig. 5). To define which sets of genes are most informative, we used a step-wise regression analysis with substrate-specific metabolism as the dependent variable to select among the six principal components (Fig. 5 and Supplementary Table 7 online). Although we calculated principal components based on gene expression for all 16 individuals, the same principal component does not explain metabolism for all three groups of individuals (Fig. 5), nor does any principal component account for more than 34% of metabolic variation among all individuals (Supplementary Table 7 online). Instead, among the three groups, different patterns of gene expression (different principal components) explain substrate-specific metabolism. Only once does the same principal component have a similar effect on metabolism in different groups (Fig. 5b,c).
Figure 5.
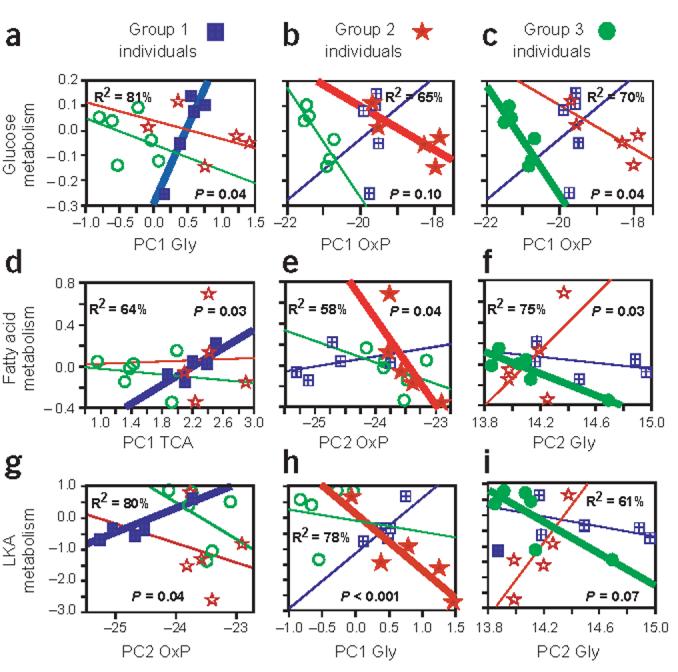
Different patterns of gene expression explain the variation in metabolism. The group-specific (group indicated at the top of each column) relationships between substrate-specific metabolism (y axis) and the most informative principal component (x axis; bold line, filled symbols) are shown. Individuals from the other groups (hollow symbols, thin lines) are included in each graph to illustrate the differences among groups. The most informative principal components (Supplementary Table 6 online) were defined by step-wise regression. The R2 value is for the relationship between the principal component listed and metabolism. The P value is given for the final step-wise regression involving one or more principal components (Supplementary Table 7 online). Groups of individuals were as in Figure 3. Blue squares, group 1; red stars, group 2; green circles, group 3. Gly, glucose metabolic enzymes; OxP, oxidative phosphorylation enzymes; TCA, Krebs cycle (TCA) enzymes.
Do the three groups represent meaningful combinations of individuals, or could they occur by chance? We found that fewer differences in gene expression occur in groups than occur randomly, more differences occur between groups than among random permutations and higher correlations in gene expression exist within groups than between them (Supplementary Table 4 online). Finally, alternate groups (formed by random permutations) that explain metabolism with equivalent significances occur with frequencies of 1.7%, 2.85% or 4.8% for glucose, fatty acid or LKA, respectively, indicating that these relationships are unlikely to occur by chance.
We suggest that associations between mRNA expression and metabolism are meaningful. First, mRNAs for these metabolic genes encode enzymes that catalyze and regulate catabolism of substrates, and the rate of catalysis affects metabolism, not the other way around. Second, the summation of gene expression in a pathway (the principal components) is experimentally independent of measures of metabolic rates. The regression analyses indicate statistically significant associations between specific principal components and substrate-specific metabolism, suggesting that they are biologically dependent. Finally, associated changes in metabolism and metabolic gene expression are expected (e.g., glucose metabolism is related to expression of either glucose enzymes or oxidative phosphorylation genes). What is unexpected are the variations: variation in how well an individual uses a substrate, variation in mRNA expression and variation among groups in which genes are associated with substrate-specific metabolism.
Many studies use arbitrary relative changes (e.g., by a factor of 2) to designate important changes in gene expression. To investigate whether genes with large changes in expression have a more significant relationship with metabolism, we plotted the correlation of gene expression with metabolism against the relative change in gene expression (Fig. 6). There was little relationship between the magnitude of the differences in gene expression among individuals and the strength of the correlation to metabolism (Fig. 6; r2 < 8%, P > 0.5). In each of the three groups of individuals, many genes were highly correlated with substrate-specific metabolism. But only in group 1 were genes whose expression changed by a factor of >2 highly correlated with all three measures of metabolism. Yet even these correlations were no greater than those for genes with relatively small changes in expression. These data suggest that small relative changes in gene expression can be as functionally important as larger ones; therefore, arbitrarily setting a relative difference as biologically important is inappropriate.
Figure 6.

Relative changes versus correlation with metabolism. Relative changes (maximum:minimum ratio; on the x axis) for group 1 (blue squares), group 2 (red circles), group 3 (green diamonds) or all 16 individuals (black triangle) are plotted against the absolute values of the correlation coefficients of gene expression with the three measures of metabolism (a, glucose; b, fatty acid; c, LKA; on the y axis). Relative changes in gene expression in a group are correlated with the variation among individuals with r > 0.91 (i.e., larger variation among individuals with larger maximum:minimum ratios). If genes with large differences in expression are more important, genes with large variation (and, therefore, large relative differences) should have larger correlations with metabolism.
Metabolism and metabolic gene expression in heart ventricles isolated from ‘common gardened’ male F. heteroclitus varied considerably (Figs. 1-3): substrate-specific metabolism varied by a factor of 2–11, and expression of 94% of genes was significantly different (P < 0.01) between individuals in a population. These differences represent variation expected among natural outbred populations and arises from genetic and other biological sources of variation. Most differences in gene expression in a population are small: expression of <16% of significant genes changed by a factor of >2. For Fundulus, the many subtle variations in gene expression account for the differences in cardiac metabolism, suggesting that the variation in gene expression is biologically meaningful. Unexpectedly, the patterns of gene expression that explain substrate-specific metabolism are different for the three groups of individuals.
Our data, and other studies5,12,13, identify abundant variation among individuals. Failure to consider this type of biological variation can result in the misidentification of genes that merely represent standing genetic or natural biological variation as ‘important’.
METHODS
Organism. We collected teleost fish F. heteroclitus at Wiscasset, Maine, and Sapelo Island, Georgia, by seine and minnow trap, kept them in controlled temperature and aeration conditions and acclimated them to common conditions (20 °C, 15 ppt salinity) in recirculating aquaria for at least nine months before experiments. We killed fish by cervical dislocation, measured heart ventricular metabolism and then stored the ventricle in RNAlater (Ambion Inc.) at −20 °C. We used only healthy male fish.
Metabolism. We determined metabolism in isolated male heart ventricles by measuring the use of oxygen in a closed, well-mixed chamber. We measured metabolic rates in triplicate for each of three different substrates: 5 mM glucose, 1 mM fatty acid (palmitic acid–bovine serum albumin) or LKA (5 mM lactate, ketones and 0.1% ethanol). We used two inhibitors of glucose metabolism (20 mM 2-deoxy-glucose and 10 mM iodoacetic acid) when measuring fatty acid and LKA metabolism. We isolated heart ventricles, expelled blood and then splayed them open to expose internal surfaces. The total time to isolate heart ventricles and measure metabolism in triplicate for all three substrates was ∼20 min. Heart metabolism is stable for >45 min for these conditions. Because all measures of metabolism are affected by body mass, we used residuals from log10 regression of body mass versus metabolism for all analyses. These measures of cardiac metabolism are uncorrelated with body mass (r < 0.14, P > 0.2).
RNA isolation. We isolated total RNA from male heart ventricles using a modified guanidinium thiocyanate buffer and then purified it using the Qiagen RNeasy Mini kit in accordance with the manufacturer's protocols. We quantified purified RNA spectrophotometrically and assessed RNA quality using the Agilent 2100 Bioanalyzer. We prepared RNA for hybridization by amplification using Ambion Amino Allyl MessageAmp aRNA Kit to form copy template RNA by T7 amplification. Amino-allyl UTP was incorporated into targets during T7 transcription, and resulting amino-allyl aRNA was coupled to Cy3 and Cy5 dyes (Amersham Biosciences).
Microarrays. We printed microarrays using 192 cDNAs from a F. heteroclitus cardiac library encoding essential proteins for cellular metabolism based on the Kyoto Encyclopedia of Genes and Genomes. These cDNAs were a subset of >40,000 expressed sequences in our database, all of which may be found at our project website23,24. These 192 cDNAs were amplified with amine-linked primers and printed on 3D Link Activated slides (Surmodics Inc.) using a SpotArray Enterprise piezoelectric microarray printer (PerkinElmer Life Sciences Inc.) at Louisiana State University. Slides were blocked in accordance with slide manufacturer protocols. We printed the suite of 192 amplified cDNAs as a group in eight spatially separated replicates. We printed four hybridization zones of these eight replicate arrays per slide, with each zone separated by a hydrophobic barrier.
Of the 192 genes, we analyzed only 119. Eight of the unanalyzed genes were negative controls: random genomic amplification or Ctenophore-specific cDNAs (gift from M. Q. Martindale, University of Hawaii). The other 65 unanalyzed genes either saturated the photomultiplier tube or had signals less than the negative controls. All measures of gene expression were normalized by sum normalization and regional lowess as implemented in R (see URLs).
The loop design was used previously5,17. This approach does not rely on hybridization to a single reference. Instead, each individual is hybridized to two slides totaling 16 arrays (each slide had eight, spatially separated, replicate arrays) and each array is hybridized with two individuals: one individual labeled with Cy3 and the other with Cy5. Each slide had different combinations of individuals. The loop formed was M6→G0→M2→G2→M5→G3→M4→G8→M0→G1→M8→G7→M3→G5→M7→G9→M6, where each arrow represents a separate hybridization with the individual at the base of the arrow labeled with Cy3 and the individual at the head of the arrow labeled with Cy5.
We carried out statistical analyses of metabolic data and step-wise regression using StatView (version 5; SAS Institute). Statistical analyses of microarray data, principal components, permutations and correlations used matrix algebra programming environment (MATLAB Version 6.5.1, Math Works). We determined significant differences in gene expression using a nested analysis of variance5. To correct for type I errors among all 119 genes, we computed 1,000 permutations of the original data across all genes and identified the maximum F value among each permuted set20. These corrected P values yielded the same results as a Bonferroni correction. Principal components analysis utilized MATLAB “princomp” subroutines that use covariance matrices to calculate principal components. Hierarchical clustering of gene expression (Fig. 3) used the Macintosh version25 of Eisen's Cluster and Treeview26. We used differences from the grand mean and clustered them by both genes and individuals using centered correlations with complete linkage. There are 4,368 possible combinations of 5 out of 16 individuals; 2,052 of these do not contain a majority of members (three or more) from the defined groups (Fig. 3). We used these 2,052 combinations of individuals to test the statistical significance in these groups. To examine whether the three defined groups are better than a random combination of individuals, we selected 1,000 random samples of the 2 × 10¹³ possible permutation of 16 individuals. We divided them into three groups (1–5 for group 1, 6–10 for group 2 and 11–16 for group 3). We applied ANOVA, with the MSerror calculated from the variance among individuals, to each group for each gene and determined the number of genes that were significantly different among groups for each of the 1,000 random permutations. To examine the robustness of the relationship between metabolism and the six principal components, we regressed the principal component for each of three groups from 1,000 random permutations against each measure of metabolism (6,000 regressions per measure of metabolism) and identified the principal component with the lowest P value for each group. We used the three principal components with the lowest P values (one per group) to define the joint probability for the three groups' relationships to each measure of metabolism. We compared these joint probabilities from the minimal P values for the random permutations (one for each measure of metabolism) with the joint probabilities from the defined three groups (Fig. 3) for the first principal component entered into the step-wise regression.
URLs. Our project website is available at http://crawford.rsmas.miami.edu. The Kyoto Encyclopedia of Genes and Genomes is available at http://www.genome.ad.jp/kegg. The FunnyBase Fundulus EST database is available at http://genomics.rsmas.Miami.edu/funnybase/super_craw4. R/MAANOVA is available at http://www.jax.org/staff/churchill/labsite/software/anova/rmaanova/index.html. The article “Normalization of cDNA microarray data” is available at http://www.stat.berkeley.edu/users/terry/zarray/Html/normspie.html. Hierarchical Clustering (Mac) is available at http://bonsai.ims.u-tokyo.ac.jp/∼mdehoon/software/cluster/software.htm#ctv. Eisen's Hierarchical Clustering is available at http://rana.lbl.gov/EisenSoftware.htm.
Supplementary Material
ACKNOWLEDGMENTS
We thank S. Hand for use of the pizeo-electric microarray printer and for critical but insightful thoughts and reading of the manuscript and G. Churchill, A. Whitehead, A. Clark and M. Q. Martindale for discussions and critical reading of the manuscript. This work was supported by the US National Science Foundation (Division of Ocean Sciences) and the US National Institutes of Health (National Heart, Lung, and Blood Institute and National Institute of Environmental Health Sciences).
Footnotes
Note: Supplementary information is available on the Nature Genetics website.
COMPETING INTERESTS STATEMENT
The authors declare that they have no competing financial interests.
References
- 1.Pierce VA, Crawford DL. Phylogenetic analysis of glycolytic enzyme expression. Science. 1997;276:256–259. doi: 10.1126/science.276.5310.256. [DOI] [PubMed] [Google Scholar]
- 2.Ferea TL, Botstein D, Brown PO, Rosenzweig RF. Systematic changes in gene expression patterns following adaptive evolution in yeast. Proc. Natl. Acad. Sci. USA. 1999;96:9721–9726. doi: 10.1073/pnas.96.17.9721. [DOI] [PMC free article] [PubMed] [Google Scholar]
- 3.Sorlie T, et al. Gene expression patterns of breast carcinomas distinguish tumor subclasses with clinical implications. Proc. Natl. Acad. Sci. USA. 2001;98:10869–10874. doi: 10.1073/pnas.191367098. [DOI] [PMC free article] [PubMed] [Google Scholar]
- 4.Alizadeh AA, et al. Distinct types of diffuse large B-cell lymphoma identified by gene expression profiling. Nature. 2000;403:503–511. doi: 10.1038/35000501. [DOI] [PubMed] [Google Scholar]
- 5.Oleksiak MF, Churchill GA, Crawford DL. Variation in gene expression within and among natural populations. Nat. Genet. 2002;32:261–266. doi: 10.1038/ng983. [DOI] [PubMed] [Google Scholar]
- 6.Brem RB, Yvert G, Clinton R, Kruglyak L. Genetic dissection of transcriptional regulation in budding yeast. Science. 2002;296:752–755. doi: 10.1126/science.1069516. [DOI] [PubMed] [Google Scholar]
- 7.Jin W, et al. The contributions of sex, genotype and age to transcriptional variance in Drosophila melanogaster. Nat. Genet. 2001;29:389–395. doi: 10.1038/ng766. [DOI] [PubMed] [Google Scholar]
- 8.Knight JC. Allele-specific gene expression uncovered. Trends Genet. 2004;20:113–116. doi: 10.1016/j.tig.2004.01.001. [DOI] [PubMed] [Google Scholar]
- 9.Bray NJ, Buckland PR, Owen MJ, O'Donovan MC. Cis-acting variation in the expression of a high proportion of genes in human brain. Hum. Genet. 2003;113:149–153. doi: 10.1007/s00439-003-0956-y. [DOI] [PubMed] [Google Scholar]
- 10.Yvert G, et al. Trans-acting regulatory variation in Saccharomyces cerevisiae and the role of transcription factors. Nat. Genet. 2003;35:57–64. doi: 10.1038/ng1222. [DOI] [PubMed] [Google Scholar]
- 11.Pritchard CC, Hsu L, Delrow J, Nelson PS. Project normal: Defining normal variance in mouse gene expression. Proc. Natl. Acad. Sci. USA. 2001;98:13266–13271. doi: 10.1073/pnas.221465998. [DOI] [PMC free article] [PubMed] [Google Scholar]
- 12.Whitney AR, et al. Individuality and variation in gene expression patterns in human blood. Proc. Natl. Acad. Sci. USA. 2003;100:1896–1901. doi: 10.1073/pnas.252784499. [DOI] [PMC free article] [PubMed] [Google Scholar]
- 13.Radich JP, et al. Individual-specific variation of gene expression in peripheral blood leukocytes. Genomics. 2004;83:980–988. doi: 10.1016/j.ygeno.2003.12.013. [DOI] [PubMed] [Google Scholar]
- 14.Brown BL, Chapman RW. Gene flow and mitochondrial DNA variation in the killifish Fundulus heteroclitus. Evolution. 1991;45:1147–1161. doi: 10.1111/j.1558-5646.1991.tb04381.x. [DOI] [PubMed] [Google Scholar]
- 15.Crawford DL, Powers DA. Molecular basis of evolutionary adaptation at the lactate dehydrogenase-B locus in the fish Fundulus heteroclitus. Proc. Natl. Acad. Sci. USA. 1989;86:9365–9369. doi: 10.1073/pnas.86.23.9365. [DOI] [PMC free article] [PubMed] [Google Scholar]
- 16.Powers DA, et al. A multidisciplinary approach to the selectionist/neutralist controversy using the model teleost, variation Fundulus heteroclitus. In: Futuyma D, Antonovics J, editors. Oxford Surveys in Evolutionary Biology. Oxford University Press; New York: 1993. pp. 43–108. [Google Scholar]
- 17.Kerr MK, et al. Statistical analysis of a gene expression microarray experiment with replication. Statistica Sinica. 2002;12:203–217. [Google Scholar]
- 18.Kerr MK, Churchill GA. Statistical design and the analysis of gene expression microarray data. Genet. Res. 2001;77:123–128. doi: 10.1017/s0016672301005055. [DOI] [PubMed] [Google Scholar]
- 19.Sokal RR, Rohlf FJ. Biometry. W.H. Freeman; New York: 1981. [Google Scholar]
- 20.Westfall PH, Young SS. Resampling-Based Multiple Testing: Examples and Methods for P-Value Adjustment. Wiley; New York: 1993. p. 340. [Google Scholar]
- 21.Pierce VA, Crawford DL. Phylogenetic analysis of glycolytic enzyme expression. Science. 2751997:256–259. doi: 10.1126/science.276.5310.256. [DOI] [PubMed] [Google Scholar]
- 22.Podrabsky JE, Javillonar C, Hand Steven C, Crawford DL. Intraspecific variation in aerobic metabolism and glycolytic enzyme expression in heart ventricles. Am. J. Physiol. 2000;279:R2344–R2348. doi: 10.1152/ajpregu.2000.279.6.R2344. [DOI] [PubMed] [Google Scholar]
- 23.Paschall JE, et al. FunnyBase: a systems level functional annotation of Fundulus ESTs for the analysis of gene expression. BMC Genomics. doi: 10.1186/1471-2164-5-96. in the press. [DOI] [PMC free article] [PubMed] [Google Scholar]
- 24.Oleksiak MF, Kolell K, Crawford DL. The utility of natural populations for microarray analyses: isolation of genes necessary for functional genomic studies. Mar. Biotechnol. 2001;3:S203–S211. doi: 10.1007/s10126-001-0043-0. [DOI] [PubMed] [Google Scholar]
- 25.de Hoon MJ, Imoto S, Nolan J, Miyano S. Open source clustering software. Bioinformatics. 2004;20:1453–1454. doi: 10.1093/bioinformatics/bth078. [DOI] [PubMed] [Google Scholar]
- 26.Eisen MB, Spellman PT, Brown PO, Botstein D. Cluster analysis and display of genome-wide expression patterns. Proc. Natl. Acad. Sci. USA. 1998;95:14863–14868. doi: 10.1073/pnas.95.25.14863. [DOI] [PMC free article] [PubMed] [Google Scholar]
Associated Data
This section collects any data citations, data availability statements, or supplementary materials included in this article.