Abstract
Objective: The use of spatially based methods and algorithms in epidemiology and surveillance presents privacy challenges for researchers and public health agencies. We describe a novel method for anonymizing individuals in public health data sets by transposing their spatial locations through a process informed by the underlying population density. Further, we measure the impact of the skew on detection of spatial clustering as measured by a spatial scanning statistic.
Design: Cases were emergency department (ED) visits for respiratory illness. Baseline ED visit data were injected with artificially created clusters ranging in magnitude, shape, and location. The geocoded locations were then transformed using a de-identification algorithm that accounts for the local underlying population density.
Measurements: A total of 12,600 separate weeks of case data with artificially created clusters were combined with control data and the impact on detection of spatial clustering identified by a spatial scan statistic was measured.
Results: The anonymization algorithm produced an expected skew of cases that resulted in high values of data set k-anonymity. De-identification that moves points an average distance of 0.25 km lowers the spatial cluster detection sensitivity by less than 4% and lowers the detection specificity less than 1%.
Conclusion: A population-density–based Gaussian spatial blurring markedly decreases the ability to identify individuals in a data set while only slightly decreasing the performance of a standardly used outbreak detection tool. These findings suggest new approaches to anonymizing data for spatial epidemiology and surveillance.
The use of spatially based methods and algorithms in epidemiology and surveillance poses privacy challenges for researchers and public health agencies. The emerging science of spatial outbreak detection1,2,3 is based on the recognition of unexpected clustering among cases. There is an inherent tension between the requirement for precise patient locations to accurately detect an outbreak and the need to protect patient privacy. Case locations that are identified using a home address or a portion of that address, such as the zip code or census tract, increase the risk of breaching patient confidentiality. While identifiable data can be shared for public health activities, the barriers to and inherent risks of such exchange could be minimized if privacy preservation were optimized with respect for the intended use of the information.
Background
Patient re-identification from purportedly de-identified data can be accomplished with surprising ease. For example, 87% of individuals in a publicly available database were re-identified using zip code, date of birth, and gender alone.4 There are well-described techniques for protecting the anonymity of individuals whose information resides in databases. Using these techniques, de-identification systems have been developed that remove personal data from database fields (for example, converting a date of birth to a year)5 or from textual notes.6
A metric for the ability to re-identify a patient in a data set is k-anonymity, where k refers to the number of people among whom a specific de-identified case cannot be reversely identified.5 Location information, whether stored as classic plain text address data or as geocoded longitude and latitude values, can potentially identify an individual. A common approach to de-identifying such data has been to use census tract or zip code rather than home address to protect anonymity. There are two main drawbacks to using location data that has been transformed to a count of points within an administrative region. First, the loss of precise location may reduce sensitivity to detect clustering. Second, the ability to detect clustering may be diminished when some of the points cross administrative boundaries.
Previous investigators have attempted to mask geographic data by spatially skewing cases using, among others, affine and randomizing transformations.7,8 We describe a spatial anonymization algorithm based on skewing precise geocoded case locations using knowledge of local population characteristics. Skewing these patient addresses directly decreases the ability to re-identify, and thus increases the k-anonymity, of a case in a data set, as it will be much more difficult to determine what the actual patient's identity is once it has been altered. Masking the identity of an individual in a densely populated urban area, for example, does not require as great a skew as one in a sparsely populated rural setting. Next, we measure the effect of anonymization intensity on outbreak detection, focusing on the sensitivity of spatial cluster detection. The goal is to provide individuals, institutions, and public health authorities a comfort level with the sharing of skewed, and hence, anonymized data, rather than using raw, fully identifiable data. Further, we aim to provide transparent information about the resulting diminution of spatial clustering detection.
Methods
Overview
Cases were emergency department (ED) visits for respiratory illness from an urban, academic, pediatric, tertiary care hospital over a five-week period from 12/30/2001 to 02/02/2002. Institutional Review Board approval at Children's Hospital Boston was granted. Home addresses of patients were cleaned to correct data entry errors using software (ZP4, Semaphore Corp., Aptos, CA) and then converted to geographic coordinates using geocoding software (ArcGIS 8.1, Environmental Systems Research Institute, Inc., Redlands, CA). Emergency department visit data were injected with artificially created clusters that varied in magnitude, shape, and location.9 The geocoded locations of all points (real addresses and artificial cluster points) were then transposed using a de-identification algorithm that skews the location based on the underlying population density. The impact on detection of spatial clustering as identified by a spatial scan statistic10 was measured.
Population Density–Based Gaussian Spatial Skew
We blurred the spatial location of patient home addresses by a distance informed by the underlying population density near the home of each patient. The patient's home address, represented by latitude/longitude coordinates, was skewed using a random offset based on a Gaussian distribution whose standard deviations are inversely correlated to the local area's population density. The use of local demographic data enables our anonymization system to transpose patients in densely populated areas by a smaller distance than patients who live in more rural areas. Hence addresses can be skewed minimally while maintaining a specified k-anonymity.
Census Block Groups
Producing de-identified data sets based on local population densities requires statewide, location-specific population density data, which are readily available from the U.S. Census Bureau. Our de-identification system identifies each patient's census block group for which the total population per square kilometer by age is available.11 Due to variability in the available Census 2000 block group data set, data were preprocessed to constrain maximum and minimum population density values and correct missing or improperly formatted values.
Gaussian Randomization
Optimally, individual points will be skewed by a minimal distance to obscure identity, while preserving spatial information. Transforming a data set using a Gaussian probability distribution function results in most cases being moved only a small distance because the Gaussian probability distribution function is strongly weighted about its mean (center) value. We have developed a bivariate Gaussian anonymization scheme that uses two randomly selected values, σx and σy, the standard deviations of normal distributions, that are used to select the distance and direction of patient displacement. Two displacement values, dx and dy, are then randomly generated according to the Gaussian distributions described above,12 to determine how far a specific point is moved. When cases are moved dx, dy, they may be moved outside the boundaries of their original census block groups. This Gaussian randomization is used in concert with population-density and age-based multipliers in the anonymization algorithm described in the following section.
Anonymization Algorithm
To achieve a similar k-anonymity between high- and low-density population areas, the amount a specific patient in a spatial data set is skewed should be inversely related to the local population density; patients in rural areas need to be moved a greater distance than those in cities. Additionally, age-based adjustments were integrated to compensate for spatial age-group population density variations, as regions may have markedly different age distribution patterns. To do this, we create multipliers reflecting the relative magnitude needed to move a specific point from its original location.
First, we calculate the average population density for all U.S. Census Blocks in the region of interest, both for Census Block Group age ranges and for the total population density. Next, we calculate multipliers for each case that vary with the inverse of the population density in the census block group below.
Anonymization Multipliers and Factors
 |
 |
These multipliers allow the anonymization system to move patients with large population multipliers farther than those with smaller multipliers on average in a data set.
Age Population Density versus Total Population Density
 |
Additionally, users may wish to control the relative importance of the age-based population density multiplier in comparison with the total population density multiplier. The age multiplier ranges from 0 to 1 where a value of 1 uses only age population density and 0 means only the total population density will be considered when choosing appropriate anonymization magnitude.
Overall Anonymization Multiplier
 |
The additional parameter c is a scaling factor that easily adjusts the magnitude of the overall skew applied to a specific latitude–longitude pair. The overall degree of anonymization is altered by changing this value, although it should be noted that the relationship between the degree of anonymization and the anonymization multiplier is nonlinear.
Test Data Sets
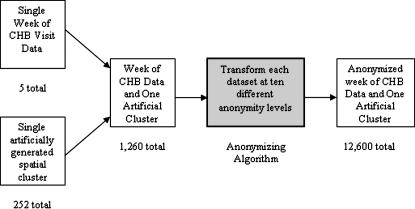
To determine whether spatial detection performance is adversely affected by transformation of a data set using this anonymization algorithm, we created a set of test data sets that varied with several parameters. Five separate weeks of ED visit data were categorized into syndrome using chief complaint and ICD-9-CM diagnosis codes, as previously described,13 to identify visits for respiratory illness. Each week of this respiratory visit data set was injected with 252 artificially generated clusters14,15 to create 1,260 data sets with one week of encounter data and one artificial cluster per data set. The 252 clusters contain 10, 25, or 40 extra points placed randomly within circles with a radius of 250, 500, 1,000, or 3,000 m. These data sets were located 8.05, 24.14, or 80.47 km (5, 15, 50 miles) away from a center point (the hospital location) at seven evenly spaced angles. Each of the 1,260 data sets was then processed using the anonymization algorithm at ten different anonymization skew levels (magnitudes of anonymization), creating a total of 12,600 test data sets (▶). Noninjected patient data are assumed to have no existing clustering; however, this is a conservative assumption. If this assumption is false, it will likely lower the number of false positives that are identified.
Figure 1.
Experiment description: five weeks of Children's Hospital Boston visit data are each individually combined with 252 different artificially generated spatial clusters. Each of the resulting 1,260 data sets was then anonymized at ten different levels for a total of 12,600 experimental data sets.
Measuring Clustering Detection Performance
The method used to measure clustering was the SaTScan Spatial Bernoulli Model scanning algorithm.3,10 After the test data sets were created, each was analyzed with 999 Monte-Carlo replications to establish a probability value for the most likely cluster identified by the SaTScan algorithm. Because these data sets each contained an artificially generated cluster of patients, we used SaTScan to determine whether at least 50% of the artificially injected cluster points were identified with a p-value ≤ 0.05. If the cluster was identified, we also recorded what proportion of the total identified cluster points were from the artificial cluster.
Estimate of κ-Anonymity
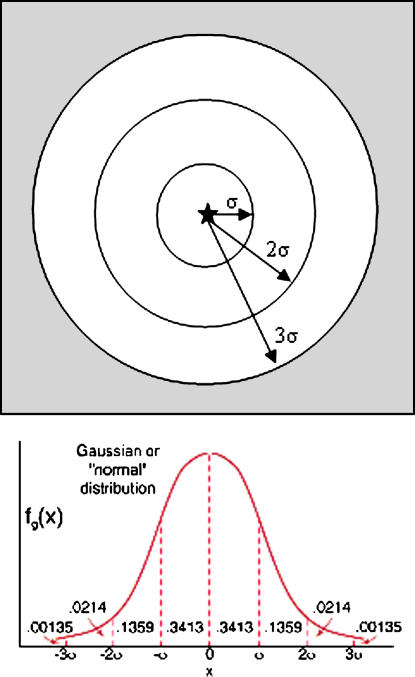
It is possible to estimate the expected level of κ-anonymity for an individual skewed case by multiplying the local population density [(population)(area−1)] by a circular ring area approximation of the Gaussian probability distribution function (▶). Since 68.26% of patients should fall, on average, within the first standard deviation, σ miles in radius from where they were originally located, we can multiply the local population density by the area, πσ2 and by the probability that the patient would have been moved into that region, 0.6826. We can add to this the next ring's population density multiplied by its area and its probability that a patient would be transplanted into that area, 0.2718. Finally, we can add the area of the last ring multiplied by its local population density by its probability density, 0.0428. The sum of these three numbers provides a computationally tractable expectation of k-anonymity achieved for a specific case in a data set.
Figure 2.
Estimating expected k-anonymity. Using the data set standard deviation of the distance each patient is moved in the anonymization, σ, an estimate of achieved k-anonymity is calculated, assuming no other external knowledge of specific patient information. The local population density (people/km2) is multiplied by each area (km2) and then multiplied by the probability that the patient would have been in that area, from the Gaussian probability distribution function.
The circular areas used in these calculations may contain several census block groups, so estimate accuracy can be increased by multiplying the fraction of area comprised by each census block by the population density of that block. The sum of those partitioned values can then be multiplied by the above probability distribution values. This estimate of k-anonymity relies on the probability density distribution of the 2D Gaussian. Sufficient numbers of patients are needed to statistically ensure that the central limit theorem has been satisfied, a reasonable assumption given the size of most public health surveillance data sets.
Outlier Assessment and Percentage of Points Meeting Anonymity Thresholds
To determine whether a subset of patients (those potentially in rural areas) might not have attained anonymity at the level specified by the user, the skew distance cumulative distribution functions for different user-specified k-anonymity values can be inspected to easily determine the quantity of cases in a large data set that have not been sufficiently individually de-identified. In aggregate form, most of these data are still sufficiently anonymized from a user with no external information; however, some rural cases may still pose risk of information disclosure. An outlier analysis allows users to determine which cases in a specific data set should be re-anonymized or excluded and what fraction of cases have been successfully anonymized.
Client Tool and Graphical User Interface (GUI) for Remote De-identification of Data
The source code and binary installation tool kits have been made available in an open source repository at http://sourceforge.net/projects/patientanon/. This stand-alone tool kit implements the de-identification algorithm explored in this article. Data sets are accepted in either a CSV or XML format, and the anonymization tool kit allows the user to specify the order of the required variables to suit almost any previously created data set. Special care was taken to make this anonymization system deployable as a stand-alone application by extracting all the necessary census block group data and storing them in a local database. In the stand-alone version, this information is stored as a set of local XML files to remove complexity from the setup of the program, so that no database software or connections are necessary to anonymize patient data. For better performance, we allow users to load their choice of state census block group data into memory. Hash tables are also used to improve lookup speed for identifying a subset of candidate census block groups for each patient record.
Results
Distribution of Location Skew
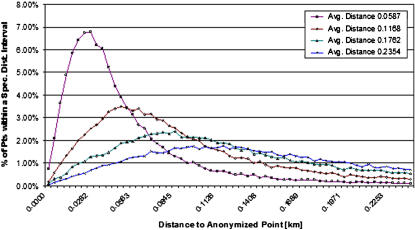
The distance from the original address to the transformed address for each patient was calculated (▶) for four sample anonymized data sets with different skew magnitudes. This illustrates empirical anonymization distributions with respect to skew level. The normal probability distribution function has the greatest density centered about the mean value, where the mean value represents no positive or negative linear skew. Nearly all cases were moved at least some distance due to the bivariate nature of this Gaussian blurring algorithm. As expected, only a small portion of patients were moved a large distance from their original addresses.
Figure 3.
Distribution of distance from original location. Each case was moved from an original home address to a new de-identified location. Each data series represents the percentage of patients who were displaced plotted against distance (km) displaced from original location. Average distances moved: 0.0587, 0.1168, 0.1762, and 0.2354 km.
Average Distance Moved versus Estimate of k-Anonymity
Using the population-density estimate of k-anonymity described above, the average k-anonymity for each anonymized data set was calculated (▶). As the magnitude of anonymization increases (as the average distance from original points in the data set increases), the k-anonymity increases quadratically. The method to estimate k-anonymity in these data sets uses the area around each patient circumscribed by a radius that is the standard deviation of distance from original address in each data set. These areas may contain multiple census block groups, each with a different population density, so we chose to use a conservative estimate, using the smallest population density in the relevant area. As these standard deviations increase linearly (as the magnitude of Gaussian blurring that is applied to each data set increases), the area enclosed by the radius around the patients increases as a second-order polynomial. An average distance value of 0.25 km corresponds to an average k-anonymity value of 250, such that in this sample data set, a patient is not reversely identifiable among a group of 250 people.
Figure 4.
Average k-anonymity achieved versus average distance moved. As the average distance (km) moved in a given data set increases, the anonymity achieved also increases in a quadratic fashion.
Sensitivity of Spatial Clustering Detection
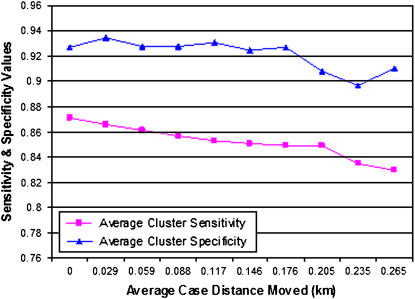
The SaTScan purely spatial Bernoulli model was used to identify whether at least 50% of artificially injected test cluster points were identified in 12,600 spatial data sets in a cluster with a p-value ≤0.05. As the magnitude of the spatial skew increased (as the average distance from original point increased), the rate of spatial detection performance decreased (▶). The average sensitivity and average specificity are graphed for each skew magnitude. The sensitivity and specificity values are defined for each cluster with artificially injected cases counted as true positives and noninjected patients counted as false positives. De-identification with a data set average distance to original point of 0.25 km lowers the spatial cluster detection sensitivity < 4% and lowers detection specificity < 1%. This result demonstrates that this approach has a minimal negative effect on spatial clustering detection sensitivity and specificity.
Figure 5.
Average cluster detection sensitivity/specificity versus average distance to original point (average distance increases as anonymization level increases). The average sensitivity and specificity of spatial detection (using SaTScan Bernoulli Spatial Model with p-value ≤0.05) of artificially injected clusters of patients is displayed with respect to the average distance that patients in a de-identified data set are moved with respect to their original home addresses. Sensitivity and specificity are calculated using cases from the cluster and control data that were or were not identified properly.
Outlier Assessment and Percentage of Points Not Meeting Anonymity Thresholds
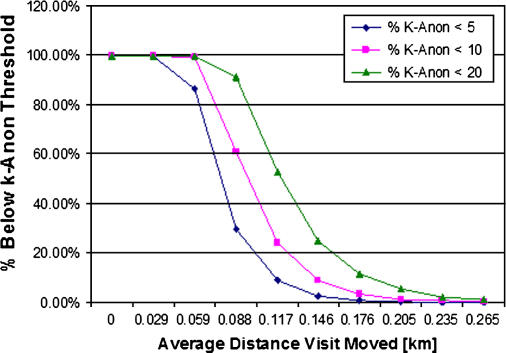
We describe the k-anonymity of results in our anonymization experiments using the average k-anonymity achieved in aggregate transformed data sets. To determine whether a subset of patients (those potentially in rural areas) might not have attained adequate anonymity, the cumulative distribution functions for user-specified k-anonymity values are presented with respect to average distance from original address (▶). As the average data set distance from original point increases, the percentage of points that do not achieve a given k-anonymity value decreases. In this example, it is possible to calculate that a k-anonymity value of 20 has been reached in 99% of all patients in this sample data set when the average distance to original point is 0.25 km. Points that do not meet a user-specified threshold can either be removed from a data set or re-anonymized. It is important to note, however, that re-anonymization of a subset of points will alter the characteristic output described above.
Figure 6.
Percentage of visits that meet specific k-anonymity thresholds. For different user-specified k-anonymity minimum thresholds, the percentage of visits in a data set with a k-anonymity value below the minimum threshold (and not sufficiently de-identified) decreases quickly as the average distance moved increases. For over 99% of the visits in all test data sets, a minimum k-anonymity value of 20 could be achieved with an average distance moved of 0.25 km.
Discussion
Population-based Gaussian skew represents a novel anonymization method that can provide a user-defined level of k-anonymity. Further, this method can readily anonymize public health surveillance data sets containing identifiable, protected health information with minimal impact on the performance of an outbreak detection system. We have explored the use of population density and age-based population density data for de-identification in this article, but we do believe the principles explored here are generally applicable to other types of patient and demographic data.
We propose a public health use case for this anonymization system. The data exchanged, for example, between a hospital and a public health authority for use in a syndromic surveillance system can contain skewed locations. As the anonymization system is completely abstracted from the spatial detection systems that use it, there is no need to align the use of this algorithm with a specific tool kit for cluster detection. If clustering is detected and an outbreak investigation is required, the fully identified data could be subsequently exchanged according to the Health Insurance Portability and Accountability Act (HIPAA) regulations as applied to public health.
One approach that might be considered is a Web-services paradigm, where a client wishing to anonymize spatial data might send a data set containing only spatial data and possible de-identification requirements, such as minimum k-anonymity or average k-anonymity, to a de-identification server. The client could then reunite a returned data set with other data that had been stored about those patients without having transferred linked spatial data over the Internet.
Moving forward, it will be necessary to determine what degree of skew will provide sufficient anonymity for distribution of a patient data set to permit different levels of data exchange. Determining what level of anonymity is required for HIPAA compliance using an anonymization system is a challenging and complex issue. A policy could be envisioned under which patients volunteering their information for use by public health agencies might be able to specify the desired k-anonymity.
The skew method described here readily achieves far higher degrees of k-anonymity than are generally considered acceptable for public health data sets. It is important to be aware, however, that k-anonymity can vary from case to case within a data set. Consider the example of a data set containing one case that is located in a rural town of 50 residents. Consider further that the desired k-anonymity is 100. It is difficult to achieve this de-identification level without increasing the magnitude of anonymization for all cases in the data set to a high level. Hence, a trade-off arises between keeping the difficult-to-anonymize cases (maintaining the integrity of the data set) versus discarding them as outliers, and thereby enabling lower intensity anonymization for the other cases. Cases may need to be removed from data sets to ensure that k-anonymity thresholds are met for every patient in a specific data set.
This algorithm randomizes the magnitude of the address skew for each patient using randomly selected seed parameters that inversely vary with the underlying population density values. Those seed values are then used to select a random x and random y offset based on a Gaussian probability distribution. Knowledge or disclosure of all the randomly selected seed and offset values could aid a nefarious agent in reversely identifying patients by lowering the data set anonymity achieved; however, the seed and offset values are calculated separately and are not stored anywhere in this de-identification process.
The main limitation of this study is that measurements were made in only one geographic area and only one approach to detecting spatial clustering was investigated. However, the urban setting is a common one for intensive public health surveillance (such as syndromic surveillance) and SaTScan is a widely employed method. Additionally, we have explored the use of population density and age-based population density data for de-identification in this article, but we do believe the principles explored here are generally applicable to other types of patient and demographic data. De-identification that attempts to accurately estimate k-anonymity is a function of all the fields contained in a data set; for anonymity to be achieved, it must be adequately achieved across all combinations of attributes in a data set. For public health surveillance data sets, this objective is tenable as the number and types of data fields contained in these data sets are limited.
Conclusion
We present experimental results demonstrating that a population-density–based Gaussian spatial blurring markedly decreases the ability to identify individuals in a data set while only slightly decreasing the performance of a standard outbreak detection tool, SaTScan. These findings suggest new approaches to anonymizing data for the real-world application of spatial epidemiology in public health practice.
The work was supported by R01LM007970-01 from the National Library of Medicine, National Institutes of Health.
The authors thank Dr. Karen Olson for input on creating semisynthetic data sets.
References
- 1.Olson KL, Bonetti M, Pagano M, Mandl KD. Real time spatial cluster detection using interpoint distances among precise patient locations. BMC Med Inform Decis Making. 2005;5:19. [DOI] [PMC free article] [PubMed] [Google Scholar]
- 2.Buckeridge DL, Burkom H, Campbell M, Hogan WR, Moore AW, Project B. Algorithms for rapid outbreak detection: a research synthesis. J Biomed Inform. 2005;38:99–113. [DOI] [PubMed] [Google Scholar]
- 3.Kulldorff M, Heffernan R, Hartman J, Assuncao R, Mostashari F. A space-time permutation scan statistic for disease outbreak detection. PloS Med. 2005;2:216–24. [DOI] [PMC free article] [PubMed] [Google Scholar]
- 4.Sweeney L. Guaranteeing anonymity when sharing medical data, the Datafly System. Proc AMIA Annu Fall Symp. 1997:51–5. [PMC free article] [PubMed]
- 5.Sweeney L. k-Anonymity: A model for protecting privacy. Int J Uncertainty Fuzziness Knowledge-Based Syst. 2002;10:557–70. [Google Scholar]
- 6.Sweeney L. Replacing personally-identifying information in medical records, the Scrub System. Proc AMIA Annu Fall Symp. 1996:333–7. [PMC free article] [PubMed]
- 7.Ohno-Machado L, Silviera SP, Vinterbo S. Protecting patient privacy by quantifiable control of disclosures in disseminated databases. Int J Med Inform. 2004;73:599–606. [DOI] [PubMed] [Google Scholar]
- 8.Armstrong MP, Ruston G, Zimmerman DL. Geographically masking health data to preserve confidentiality. Stat Med. 1999;18:497–525. [DOI] [PubMed] [Google Scholar]
- 9.Cassa CA, Olson KL, Mandl KM. System to generate semisynthetic data sets of outbreak clusters for evaluation of outbreak-detection performance. Morb Mortal Wkly Rep. 2004;53(Suppl):231. [Google Scholar]
- 10.Kulldorff M, Nagarwalla N. Spatial disease Clusters—Detection and inference. Stat Med. 1995;14:799–810. [DOI] [PubMed] [Google Scholar]
- 11.United States Census Bureau. Census Block Groups Cartographic Boundary Files Descriptions and Metadata. Washington, DC: U.S. Census Bureau, 2005.
- 12.Documentation SJ. Random Class: nextGaussian() Method Documentation, 2005. Available at http://java.sun.com/j2se/1.4.2/docs/api/java/util/Random.html#nextGaussian(), valid as of January 16, 2006.
- 13.Beitel AJ, Olson KL, Reis BY, Mandl KD. Use of emergency department chief complaint and diagnostic codes for identifying respiratory illness in a pediatric population. Pediatr Emerg Care. 2004;20:355–60. [DOI] [PubMed] [Google Scholar]
- 14.Mandl KD, Reis BY, Cassa C. Measuring outbreak-detection performance by using controlled feature set simulations. MMWR Morb Mortal Wkly Rep. 2004;53(Suppl):130–6. [PubMed] [Google Scholar]
- 15.Mandl KD, Overhage JM, Wagner MM, Lober WB, Sebastiani P, Mostashari F, et al. Implementing syndromic surveillance: a practical guide informed by the early experience. J Am Med Inform Assoc. 2004;11:141–50. [DOI] [PMC free article] [PubMed] [Google Scholar]


