Abstract
Purpose
To assess the quality of life in patients with Graves ophthalmopathy by means of a prospective questionnaire with validation.
Methods
A questionnaire containing 105 items was sent to 325 patients seen in our university-based oculoplastic clinic. Two hundred three questionnaires were returned and were suitable for analysis. Fifty-three consecutive patients with Graves disease who presented to the clinic for examination also completed the questionnaire. The questionnaire was validated by administering it to 33 healthy subjects who had no history of Graves disease or thyroid disorder. The results were compared with those of normal subjects and with national norms for visually impaired populations. The relationship of individual questionnaire items to measures of clinical severity was subsequently assessed.
Results
Patients with Graves ophthalmopathy report greater impairment in both physical (44.4 versus 51.9; P < .001) and mental (43.8 versus 51.8; P < .001) health; poorer self- image (P < .001); and significantly more disturbance in their sleep, social function, and work function (P < .001) than controls. Afflicted patients also experience significantly more diplopia, blurred vision, and dry eye symptoms than controls (P < .001). Individual questionnaire items were found to correlate with clinical disease severity scores and were used to establish a Graves ophthalmopathy quality-of-life questionnaire with disease severity validation.
Conclusions
Patients with Graves disease are significantly impaired in their social and vocational function because of the ophthalmic manifestations of the disease. A short questionnaire that correlates with clinical measures of disease severity may be a useful measure of quality of life in this disease.
INTRODUCTION
Graves ophthalmopathy is a potentially vision-threatening illness that often leads to functional disability and social impairment.1,2 The soft tissue swelling, eyelid retraction, proptosis, and strabismus associated with Graves ophthalmopathy often result in tearing and keratopathy from corneal exposure, ocular motility disturbance and diplopia from extraocular muscle involvement, reduced visual acuity from keratopathy or optic nerve compression, and physical disfigurement as a consequence of overt strabismus, proptosis, and soft tissue changes.1–5 Despite medical or surgical intervention in the treatment of the ophthalmopathy, the disease imparts permanent physical disfigurement and functional disability that negatively impact the patient's psychosocial well-being and feelings of wellness.2,6 Although the thyroid hormone dysfunction that often accompanies this disease may be treated satisfactorily, it is the ophthalmopathy that is most difficult to treat and often renders the patient functionally and socially disabled.
Although the physical signs of Graves ophthalmopathy can be measured, how each parameter impacts activities of daily living or psychosocial function is not known. Alterations in visual acuity and the severity of proptosis, strabismus, and eyelid retraction can be objectively measured, but the degree to which they affect a patient’s feelings of wellness in part, or as a whole, has not been defined. Disease severity scores based on objective clinical data have been developed that attempt to measure the clinical severity of the disease state.7 The NO SPECS classification8,9 is, perhaps, the most well known, although others have been formulated.10–15
These scales of disease severity have not been widely adopted because of the difficulty in creating a disease index score that correlate with disease activity and patient morbidity.7,16 Similar poor correlation has been encountered when comparing a measure of quality of life with measures of disease severity.17
Assessment of quality of life associated with health states has become increasingly important in health care over the past two decades. A measure unheard of 20 years ago, quality-of-life instruments are included in most clinical trials today.18 The wide acceptance of the concept of quality of life affirms the notion that the physician’s ultimate concern is the well-being of the whole person, not necessarily the improvement of a biomedical parameter. This places evaluation of therapeutic benefit in the context of a patient’s culture and value systems and in relation to the patient’s goals and expectations.19,20
Whereas most will agree that quality of life is an important outcome and benefit of treatment, the best method of measuring this concept is debatable. Quality-of-life instruments, often in the form of questionnaires or interview techniques, must be valid and reliable, easily administered and analyzed, and provide a determination of the patient’s feeling of well-being.21 Many such instruments have been developed.
Quality-of-life instruments classified as “generic” attempt to measure general health across all diseases and populations and are divided into two groups—those that attempt to measure general health22–26 and those that are disease-specific.26–38 Instruments classified as “disease targeted” assess the health concerns and psychosocial well-being known to be relevant to a specific disease; they offer more depth in measurement but are therefore more narrowly focused. Regardless of the approach, most quality-of-life measures contain multiple scales reflecting the multifaceted nature of health or well-being, with most including physical, social, and emotional measures.28,29,39
Several national collaborative studies have used general health quality-of-life instruments in the evaluation of effect of ocular disease on overall quality of life. The SF-36 was used in the Ocular Hypertension Treatment Study35 as well as the Collaborative Longitudinal Evaluation of Keratoconus Study.36 The Sickness Impact Profile (SIP) was used to assess the quality of life in the Collaborative Initial Glaucoma Treatment Study.37,38 The usefulness of general health instruments in evaluating quality of life in patients with visual disturbance has been questioned in favor of visual system–related instruments.
Several vision-specific quality-of-life instruments have been developed to assess the impact of disease on a broad spectrum of vision-dependent activities and activities of daily living. Vision-specific questionnaires target visual disabilities and their impact on activities of daily living and psychosocial function.39 The SIP, a general health questionnaire, was modified to a vision-specified instrument (SIPV) and has been used to evaluate life quality in patients with retinal disorders and cataracts.40,41 Other questionnaires were specifically designed for the evaluation of activities of daily living affected by cataract and include the Visual Function Index (VF-14) and the Activities of Daily Vision Scale (ADVS).39 Broader scales of vision-specific activities are defined by the Visual Activities Questionnaire (VAQ)42 and the National Eye Institute Visual Functioning Questionnaire (51-item NEI-VFQ and VFQ-25).43–48 The National Eye Institute visual functioning questionnaires have been validated for both anterior segment45,48 and posterior segment ocular disease.46,47,49,50 The NEI-VFQ and VFQ-25 have both been used to study quality of life in patients with glaucoma and have been shown to correlate moderately over a wide range of visual field impairment scores.51,52 The VFQ-25 places additional emphasis on the psychosocial aspects of vision loss.44
Generic health-related quality-of-life instruments and vision-specific questionnaires have been used to study Graves disease.6,17,53–56 In recent studies, general health-related quality of life (HR-QOL) in patients with Graves ophthalmopathy is markedly decreased compared with a general population and with patients with other chronic diseases.55,56 Generic instruments have been criticized because these queries are thought to be too broad to detect small but clinically important changes in disease.18,57,58 Similarly, vision-specific instruments are available but were not specifically designed to assess vision-related difficulties in patients with Graves eye disease.17 An Amsterdam group has developed a Graves disease quality-of-life instrument (GO-QOL) by assembling items from a variety of generic and vision-specific questionnaires.17, These items were selected for inclusion a priori on face validity and from the results of an open-ended questionnaire about symptoms or problems administered to patients with Graves disease. Validity of the questionnaire was supported by correlation with other generic instruments. Although the GO-QOL was regarded as valid, it had low correlation with the clinical activity of the disease. The investigators concluded that because the perception of the impact of disease is different for each patient, correlation with clinical measurements of disease severity will be attenuated and thus such a result is “the essence of HR-QOL measurements.”17 However, this is not a result to which most clinicians would categorically subscribe. In Graves ophthalmopathy, the clinical activity of disease should bear a direct and tangible relationship with patient well-being related specifically to eyesight and affecting broader health states more generally (eg, emotional well-being or distress). To dismiss the correlation between measures of clinical activity of disease and the quality-of-life instrument may suggest that the query regarding quality of life did not accurately reflect the life of the afflicted or that the measure of clinical disease activity did not accurately reflect the morbidity of the patient.
This study investigates the quality of life in a Graves disease cohort. A series of well-known, previously validated, generic and vision-specific quality-of-life instruments is used to examine the impact of Graves disease on activities of daily living, social function, and self-perception. A new questionnaire to assess quality of life in patients with Graves ophthalmopathy was developed and validated against other visually impaired groups. Subsequently, the questionnaire was correlated with four objective clinical measures of disease activity, namely, optic neuropathy, extraocular muscle dysfunction, exposure keratopathy, and cosmesis. The resulting Graves disease quality-of-life questionnaire may be useful in assessing the ongoing effect of the disease on activities of daily living and psychosocial function as well as outcomes from medical and surgical intervention.
METHODS
QUALITY-OF-LIFE QUESTIONNAIRE
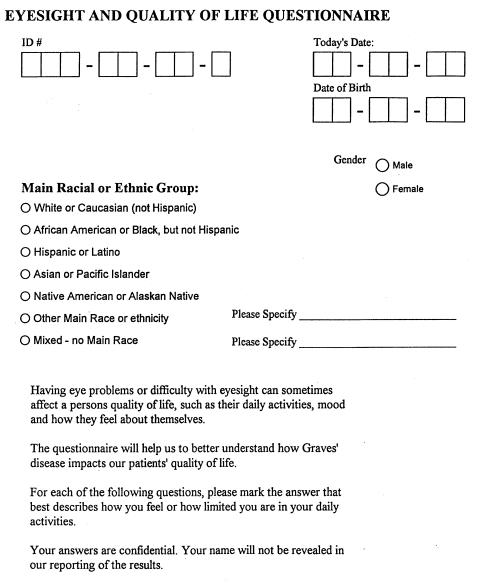
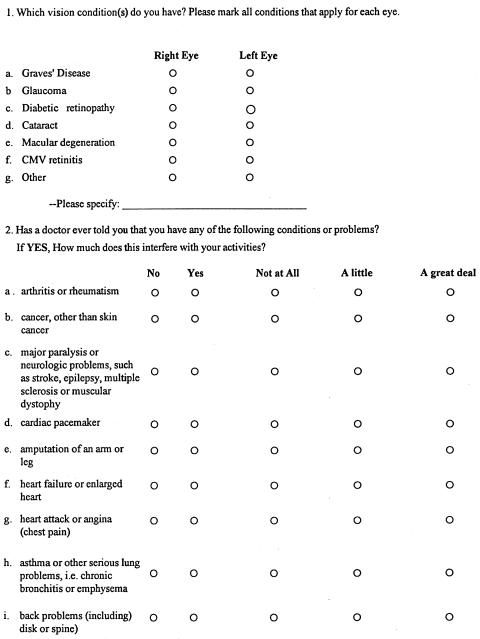
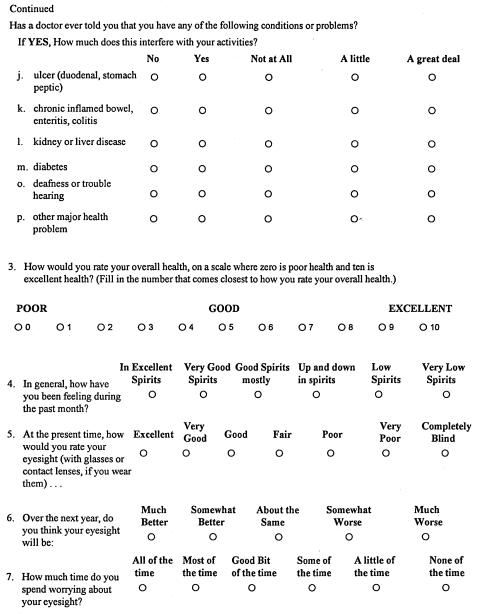
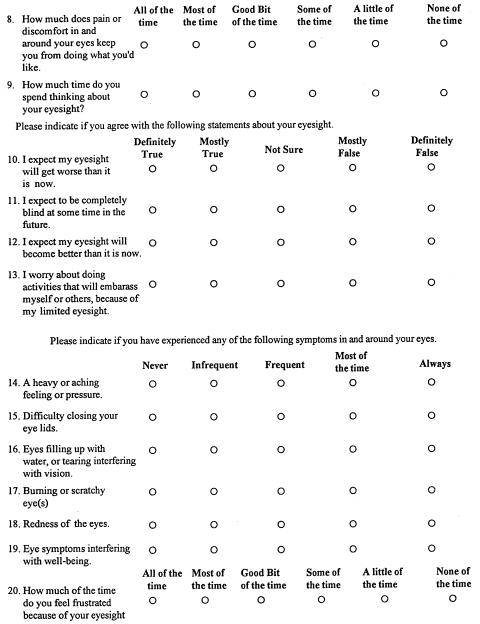
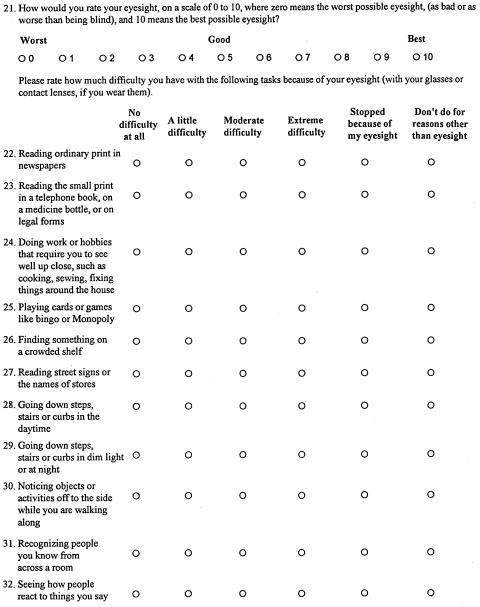
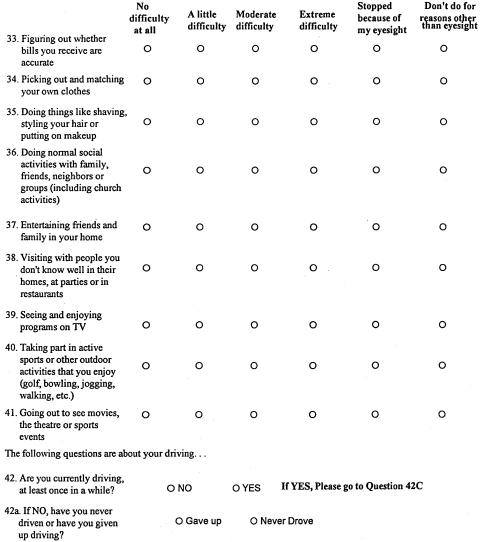
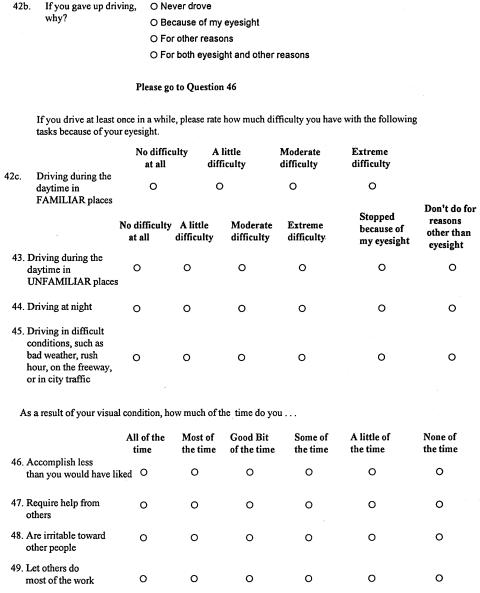
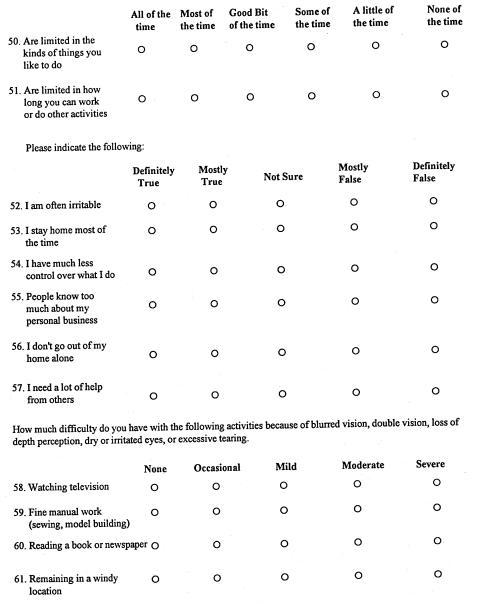
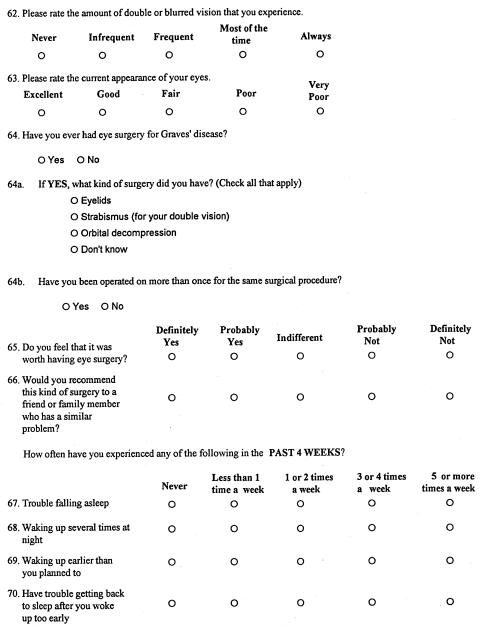
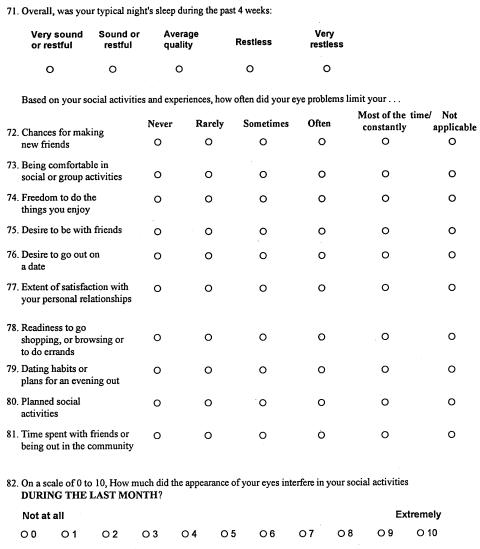
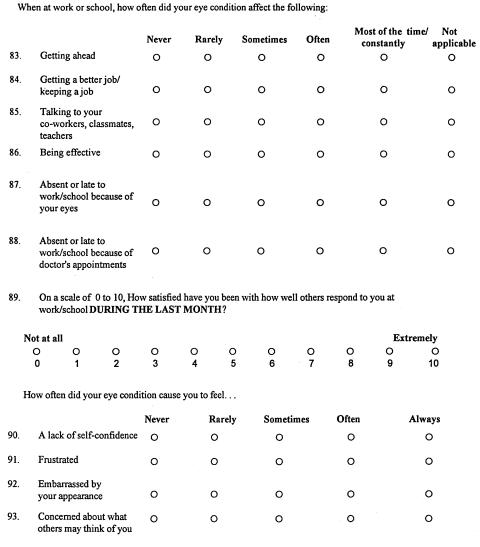
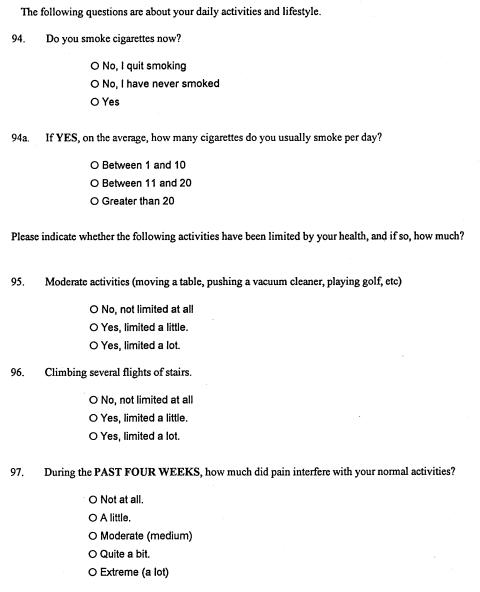
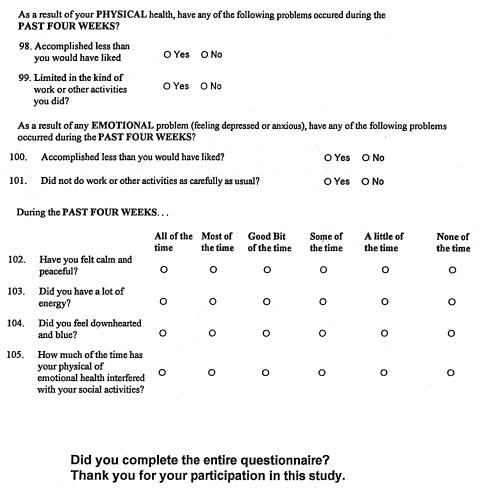
This study was approved by and performed under the auspices of the Institutional Review Board of Wake Forest University School of Medicine. A questionnaire was developed containing 105 questions regarding quality of life related to (1) general and mental health (Short Form, or SF-12); (2) self- perception and social functioning (adapted from the Dermatology-Specific Quality of Life Questionnaire, or DSQL); (3) general visual function (51-item NEI-VFQ); and (4) visual function specific to Graves ophthalmopathy (see Appendix 1 and Appendix 1 Table). The questionnaire was sent to all patients of record with a diagnosis of Graves ophthalmopathy who were greater than 18 years of age and were seen between January 1990 and April 1998 in our university-based oculoplastic clinic. Of the 325 questionnaires mailed, 203 were returned and were suitable for analysis. Twenty-one questionnaires were returned because of change of address or because the patient was deceased. For statistical analysis, this group is henceforth referred to as the convenience sample. Additionally, 53 consecutive patients who presented to the clinic for examination between October 2001 and May 2002 as new patient registrants with a diagnosis of Graves disease or Graves disease patients who had not previously completed the questionnaire were administered the questionnaire and are henceforth referred to as the case series. The convenience sample and case series were statistically compared to assess respondent bias of the convenience sample with the goal to combine the groups into a single Graves study group (n = 256) if appropriate. The case series and convenience samples were compared in regard to common demographics such as age, gender, and race, as well as patient responses, eye symptoms, and comorbidities. Chi-square tests, Fisher exact tests, and analyses of variance (ANOVAs) with multiple comparisons were conducted where appropriate.
APPENDIX 1 TABLE.
KEY TO ITEMS COMPOSING THE 105-ITEM GRAVES OPHTHALMOPATHY QUALITY-OF-LIFE QUESTIONNAIRE
| ITEM ORIGIN | ITEM NUMBER |
|---|---|
| NEI-VFQ | |
| General health | 3 |
| General vision | 5, 21 |
| Ocular pain | 8, 17 |
| Mental health | 13, 20, 52, 54 |
| Near activities | 22–26, 27, 33, 35, |
| Distance activities | 29, 31, 32, 39, 40, 41 |
| Color vision | 34 |
| Social function | 32,37, 38 |
| Driving | 42, 42a, 42b, 42c, 44, 45 |
| Role development | 46, 47, 50, 51 |
| Dependency | 53, 56, 57 |
| Peripheral vision | 30 |
| SF-12 | |
| General health | 3 |
| Physical functioning | 05, 96 |
| Bodily pain | 97 |
| Role physical | 98, 99 |
| Role emotional | 100, 101 |
| Mental health | 102, 104 |
| Vitality | 103 |
| Social functioning | 105 |
| Graves specific | 58–66 |
| DSQL | |
| Self-perception | 90–93 |
| Desirability | 72, 73, 77–79, 80, 81 |
DSQL = Dermatology-Specific Quality of Life Questionnaire; NEI-VFQ = 51-item National Eye Institute Visual Field Questionnaire; SF-12 = 12-item Short Form.
Also assessed were 33 healthy subjects greater than 18 years of age who had no history of Graves disease or thyroid disorder (control group). The control group represented the readily identified and accessible employees or volunteers of the Wake Forest University Eye Center. The results of questions related to general health, mental health, and general visual function were compared to normal subjects and to national norms for visually impaired populations. Individual health-related quality-of-life components of the NEI-VFQ were compared between the Graves study group and the control group by use of t tests. VFQ-25 scores for visually impaired groups were used when necessary to compare to data derived from the Graves disease study cohort. The VFQ-25 is a shortened questionnaire derived from the 51-item NEI-VFQ used in the study and is highly correlated with this longer survey.
Questions regarding self-perception and social functioning have been validated elsewhere34; however, these questions and questions regarding visual impairment specific to Graves ophthalmopathy were further validated against the control subjects. The pattern of HR-QOL in the Graves study group was analyzed among different gender and age-groups. The t tests were performed to compare males and females in the study group with regard to the individual components of the NEI-VFQ. ANOVAs were used to compare mean HR-QOL scores across different age-groups, and any difference found was investigated by conducting multiple comparison tests.
CORRELATION OF QUALITY OF LIFE WITH CLINICAL SEVERITY OF DISEASE MEASURES
Correlation of individual questionnaire items to measures of clinical severity was assessed in order to establish a short questionnaire with clinical disease severity correlation. Patients were assessed in regard to the presence and severity of compressive optic neuropathy, exposure keratopathy, myopathy, and cosmetic concerns. Points were assigned to each factor related to each of the four clinical components of Graves ophthalmopathy and were summated to establish a separate point score for neuropathy, myopathy, keratopathy, and cosmesis by expert raters who did not have knowledge of the patient’s quality-of-life questionnaire data (Appendix 2). Each component score was assigned to one of five categories. A score of zero indicated the absence of clinical findings related to the individual component. A sum of greater than 1 indicated the presence of clinical findings related to a component and was assigned to one of four levels of clinical severity: ie, mild, moderate, moderately severe, and severe. The higher the score, the greater severity of disease. The clinical severity scores for each of the four clinical components were subsequently correlated with scores of individual items in the Graves quality-of-life questionnaire.
ITEM DEVELOPMENT PROCESS FOR DEVELOPMENT OF A GRAVES OPHTHALMOPATHY QUALITY-OF-LIFE SCALE
To select the most appropriate items to compose a Graves quality-of-life scale, a pool of candidate items from the quality-of-life questionnaire was chosen based on appropriate response scales (five or more responses), no excessive skewness, few missing values, and face validity as to their applicability in measuring Graves disease-related quality of life. A comprehensive search was then performed to select those items that best correlated with the Graves disease severity scales and those that best discriminated between mild and moderate scorers based on the Cohen effect size with a pooled standard deviation. Optimally, items were selected that correlated best, discriminated best, and, in addition, possessed good face validity. Questionnaire items were assigned points based on (1) correlation rank (the best correlated item received 10 points, the tenth highest received 1 point); (2) discriminating rank (the best discriminator received 10 points, the tenth highest received 1 point); and (3) good face validity (3 points). Items that exceeded 10 points were selected for consideration for inclusion in the scale.
A factor analysis using the principal factor method was conducted in order to assess the unidimensionality of the remaining items as well as their loadings on the main factor. Selected items were excluded because of a high nonresponse rate, lower item-to-total correlation, and low factor loadings. The convergent validity of the final Graves disease quality-of-life scale was subsequently assessed by examining its correlations with the VFQ-25 scale and the clinical severity scores.
RESULTS
The case series and convenience sample show no statistical difference with respect to age, race, gender, ocular disease, or other health-related comorbidities (Tables 1 through 7). When evaluating across cohorts, a Fisher exact test fails to reject the hypothesis that race proportions are different. A chi-square test rejects the hypothesis that proportions are equal across gender (P = .0432) at α = .05. A t test between the proportions of case series and convenience sample is not significant at alpha = .05. The case series and the convenience sample are combined to form the Graves study group. An ANOVA for age followed by Tukey multiple comparisons shows that the mean age of the case series and convenience sample is significantly different from the mean age of the controls, P = .005. Chi-square tests and Fisher exact tests comparing prevalence of comorbidities in both groups yield no significant results at α = .05.
TABLE 1.
DEMOGRAPHIC INFORMATION OF THE CASE SERIES, CONVENIENCE SAMPLE, GRAVES STUDY GROUP, AND CONTROL COHORT*
| VARIABLE | CASE SERIES (n = 53) | CONVENIENCE SAMPLE (n = 203) | GRAVES STUDY GROUP (n = 256) | CONTROL (n = 33) |
|---|---|---|---|---|
| Gender | ||||
| Female | 41(77) | 172 (85) | 213 (83) | 20 (67) |
| Male | 12 (23) | 31 (15) | 43 (17) | 10 (33) |
| Mean age (years) ± SD | 56.3 ± 13.6 | 57.3 ± 23.7 | 57.14 ± | 48.6 ± 14.3 |
| Age range, years | 26 to 91 | 24 to 98 | 24 to 98 | 28 to 87 |
| Race | ||||
| Caucasian | 47 (89) | 180 (89) | 227 (89) | 31 (94) |
| Black | 4 (8) | 17 (8) | 21 (8) | 2 (6) |
| Asian | 4 (4) | 1 (0) | 3 (1) | 0 (0) |
| Other | 0 (0) | 1 (0) | 2 (1) | 0 (0) |
| Unknown | 0 (0) | 1 (0) | 3 (1) | 0 (0) |
Number (%) is shown.
TABLE 7.
HEALTH-RELATED COMORBIDITIES FOR THE CONTROL GROUP*
| CONDITION | NO. (%) | NOT AT ALL | A LITTLE | A GREAT DEAL |
|---|---|---|---|---|
| Arthritis or rheumatism | 6 (9) | 1 | 1 | 1 |
| Cancer, except skin cancer | 2 (6) | 2 | 0 | 0 |
| Major paralysis, neurologic problems, such as stroke | 2 (6) | 1 | 0 | 0 |
| Cardiac pacemaker | 0 (0) | 0 | 0 | 0 |
| Amputation of arm or leg | 0 (0) | 0 | 0 | 0 |
| Heart failure | 0 (0) | 0 | 0 | 0 |
| Heart attack or angina | 0 (0) | 0 | 0 | 0 |
| Asthma or other serious lung problems | 4 (12) | 0 | 2 | 2 |
| Back problems | 7 (21) | 2 | 4 | 0 |
| Ulcer | 2 (6) | 1 | 1 | 0 |
| Enteritis, colitis | 0 (0) | 0 | 1 | 0 |
| Kidney or liver disease | 1 (3) | 1 | 1 | 0 |
| Diabetes | 0 (0) | 0 | 0 | 0 |
| Deafness or trouble hearing | 5 (15) | 0 | 3 | 0 |
| Other major health problems | 3 (9) | 0 | 1 | 1 |
Fisher exact test comparing control to Graves study group was significant for arthritis and rheumatism (P = .0329) and other major health problems (P = .0429) at α = .05.
TABLE 2.
OCULAR DISEASE–RELATED COMORBIDITIES FOR THE CASE SERIES AND THE CONVENIENCE SAMPLE*
| CONDITION | CASE SERIES (n = 53) No. (%) | CONVENIENCE SAMPLE (n = 203) No. (%) |
|---|---|---|
| Glaucoma | 3 (6) | 8 (4) |
| Diabetic retinopathy | 1 (2) | 4 (2) |
| Cataract | 7 (13) | 15 (7) |
| Macular degeneration | 2 (4) | 5 (2) |
| CMV retinitis | 0 (0) | 1 (0.5) |
| Other | 1 (2) | 9 (4) |
CMV = cytomegalovirus.
No significant difference in prevalence between case series and convenience sample found using Fisher exact test at α = .05.
TABLE 3.
OCULAR DISEASE–RELATED COMORBIDITIES FOR CONTROL AND GRAVES STUDY GROUP*
| CONDITION | CONTROL GROUP (n = 33) No. (%) | GRAVES STUDY GROUP (n = 256) No. (%) |
|---|---|---|
| Glaucoma | 2 (6) | 11 (4) |
| Diabetic retinopathy | 0 (0) | 6 (2) |
| Cataract | 0 (0) | 26 (10) |
| Macular degeneration | 0 0) | 8 (3) |
| CMV retinitis | 0(0) | 1(0.4) |
| Other | 5 (15) | 14 (5) |
CMV = cytomegalovirus.
Fisher exact test comparing the control to Graves study group was significantly different at α = .05 for other eye diseases (P = .0168). Graves disease rate was not tested because the rates are clearly different.
TABLE 4.
HEALTH-RELATED COMORBIDITIES FOR THE CASE SERIES*
| CONDITION | NO. (%) | NOT AT ALL | A LITTLE | A GREAT DEAL |
|---|---|---|---|---|
| Arthritis or rheumatism | 22 (41) | 1 | 16 | 5 |
| Cancer, except skin cancer | 5 (9) | 2 | 2 | 1 |
| Paralysis, neurologic problems, such as stroke. | 4 (7) | 2 | 0 | 2 |
| Cardiac pacemaker | 1 (2) | 1 | 0 | 0 |
| Amputation of arm or leg | 0 (0) | 0 | 0 | 0 |
| Heart failure | 3 (6) | 1 | 0 | 1 |
| Heart attack or angina | 5 (9) | 0 | 4 | 1 |
| Asthma or other serious lung problems | 12 (22) | 1 | 6 | 4 |
| Back problems | 22 (41) | 3 | 8 | 7 |
| Ulcer | 14 (26) | 5 | 4 | 0 |
| Enteritis, colitis | 4 (7) | 0 | 1 | 1 |
| Kidney or liver disease | 3 (6) | 0 | 1 | 0 |
| Diabetes | 4 (7) | 0 | 1 | 1 |
| Deafness or trouble hearing | 6 (11) | 8 | 0 | 0 |
| Other major health problems | 10 (19) | 1 | 2 | 5 |
Chi-square test and Fisher exact test with convenience sample regarding prevalence of conditions yielded no significant results at α = .05.
TABLE 5.
HEALTH-RELATED COMORBIDITIES FOR THE CONVENIENCE SAMPLE*
| CONDITION | NO. (%) | NOT AT ALL | A LITTLE | A GREAT DEAL |
|---|---|---|---|---|
| Arthritis or rheumatism | 74 (36) | 9 | 48 | 18 |
| Cancer, except skin cancer | 20 (10) | 11 | 5 | 3 |
| Paralysis, neurologic problem, such as stroke | 7 (3) | 5 | 1 | 4 |
| Cardiac pacemaker | 2 (1) | 4 | 0 | 0 |
| Amputation of arm or leg | 4 (2) | 4 | 0 | 1 |
| Heart failure | 9 (4) | 6 | 0 | 3 |
| Heart attack or angina | 24 (12) | 4 | 15 | 2 |
| Asthma or other serious lung problems | 39 (19) | 7 | 28 | 5 |
| Back problems | 70 (34) | 4 | 39 | 18 |
| Ulcer | 35 (17) | 13 | 20 | 2 |
| Enteritis or colitis | 22 (11) | 5 | 8 | 11 |
| Kidney or liver disease | 10 (5) | 4 | 9 | 1 |
| Diabetes | 14 (7) | 4 | 7 | 5 |
| Deafness or trouble hearing | 32 (16) | 3 | 21 | 8 |
| Other major health problem | 54 (27) | 10 | 21 | 23 |
Chi-square test and Fisher exact test with case series sample regarding prevalence of conditions yielded no significant results at α = .05.
TABLE 6.
HEALTH-RELATED COMORBIDITIES FOR THE GRAVES STUDY GROUP*
| CONDITION | NO. (%) | NOT AT ALL | A LITTLE | A GREAT DEAL |
|---|---|---|---|---|
| Arthritis or rheumatism | 96 (37) | 10 | 64 | 23 |
| Cancer, except skin cancer | 25 (10) | 13 | 7 | 4 |
| Paralysis, neurologic problems, such as stroke | 11 (4) | 9 | 1 | 4 |
| Cardiac pacemaker | 3 (1) | 5 | 0 | 0 |
| Amputation of arm or leg | 4 (2) | 4 | 0 | 1 |
| Heart failure | 12 (5) | 7 | 0 | 4 |
| Heart attack or angina | 36 (14) | 5 | 21 | 6 |
| Asthma or other serious lung problems | 51 (20) | 8 | 34 | 9 |
| Back problems | 92 (36) | 7 | 47 | 25 |
| Ulcer | 49 (19) | 18 | 24 | 2 |
| Enteritis, colitis | 26 (10) | 5 | 9 | 12 |
| Kidney or liver disease | 13 (5) | 4 | 10 | 1 |
| Diabetes | 18 (7) | 4 | 8 | 6 |
| Deafness or trouble hearing | 38 (15) | 11 | 21 | 8 |
| Other major health problems | 64 (25) | 11 | 23 | 28 |
Fisher exact test comparing control to Graves study group was significantly different for arthritis and rheumatism (P = .0329) and other major health problems (P = .0429)
Tables 8 and 9 show descriptive statistics for the VFQ and the mean subscores for the case series and convenience sample. Comparison of the responses of the case series and the convenience sample shows no statistical difference by t test. By all measures, the case series and convenience sample are statistically indistinguishable and therefore were subsequently combined to form the Graves study group for further investigation (Table 10).
TABLES 8.
DESCRIPTIVE STATISTICS OF THE CASE SERIES VFQ SUBSCALES*
| VARIABLE | n | MEAN | SD | MINIMUM | MAXIMUM |
|---|---|---|---|---|---|
| General health | 52 | 63.46 | 20.95 | 10.00 | 100.0 |
| General vision | 52 | 58.01 | 18.81 | 16.67 | 100.0 |
| Ocular pain | 53 | 70.57 | 19.75 | 30.00 | 100.0 |
| Near activities | 53 | 68.95 | 26.27 | 8.33 | 100.0 |
| Distance activities | 53 | 71.70 | 26.08 | 12.50 | 100.0 |
| Social functioning | 53 | 86.56 | 18.96 | 25.00 | 100.0 |
| Mental health | 53 | 69.41 | 22.37 | 0.00 | 100.0 |
| Role difficulty | 53 | 72.08 | 26.84 | 10.00 | 100.0 |
| Dependency | 52 | 74.28 | 27.72 | 0.00 | 100.0 |
| Driving | 46 | 77.17 | 20.12 | 25.00 | 100.0 |
| Color vision | 50 | 91.50 | 20.58 | 25.00 | 100.0 |
| Peripheral vision | 53 | 74.06 | 27.72 | 0.00 | 100.0 |
| Total score | 53 | 72.82 | 18.30 | 28.79 | 100.0 |
t test comparisons with convenience sample are not significant at α = .05.
TABLE 9.
DESCRIPTIVE STATISTICS OF THE CONVENIENCE SAMPLE VFQ-25 SUBSCALES*
| VARIABLE | n | MEAN | SD | MINIMUM | MAXIMUM |
|---|---|---|---|---|---|
| General health | 201 | 61.29 | 25.21 | 0.00 | 100.0 |
| General vision | 202 | 60.15 | 18.14 | 16.67 | 100.0 |
| Ocular pain | 201 | 71.19 | 19.07 | 20.00 | 100.0 |
| Near activities | 202 | 71.80 | 23.93 | 8.33 | 100.0 |
| Distance | 203 | 73.77 | 22.71 | 8.33 | 100.0 |
| Social | 201 | 84.70 | 20.82 | 12.50 | 100.0 |
| Mental health | 203 | 68.39 | 24.49 | 0.00 | 100.0 |
| Role difficulty | 202 | 71.44 | 25.83 | 0.00 | 100.0 |
| Dependency | 201 | 73.82 | 28.66 | 0.00 | 100.0 |
| Driving | 185 | 73.11 | 24.48 | 0.00 | 100.0 |
| Color vision | 200 | 94.63 | 13.47 | 25.00 | 100.0 |
| Peripheral vision | 198 | 74.87 | 26.72 | 0.00 | 100.0 |
| Total score | 203 | 73.02 | 17.39 | 18.17 | 98.75 |
t test comparisons with case series are not significant at α = .05.
TABLE 10.
GRAVES STUDY GROUP DEMOGRAPHIC INFORMATION
| VARIABLE | n* |
|---|---|
| Gender | |
| Male | 43 (17) |
| Female | 213 (83) |
| Mean age (years) ± SD | 57.14 |
| Age range, years | 24 to 98 |
| Race | |
| White | 227 (89) |
| Black | 21 (8) |
| Asian | 3 (1) |
| Other | 2 (1) |
| Unknown | 3 (1) |
Numbers (%) are shown.
Tables 11 and 12 show VFQ-25 norms and compare them with the means scores of the Graves study group, control group, and other visual impairment benchmarks. Except for the general health and color vision scores, the Graves study group means for all other quality-of-life categories are significantly less than the reference group scores using the Tukey-Kramer method (P < .001). In addition, the Graves study group mean for ocular pain is significantly less than the norm for the ocular diseases (P < .001), implying a greater degree of ocular pain. The overall VFQ-QOL mean for the Graves study group is found to be significantly lower than the glaucoma norm (P < .001), the cytomegalovirus retinitis norm (P = .0126), and the reference group mean (P < .001), but significantly higher than the low-vision groups (P < .001) published for this instrument.44
TABLE 11.
COMPARISON OF CONTROL, GRAVES STUDY GROUP, AND NATIONAL VFQ REFERENCE COHORT*
| VARIABLE | GRAVES STUDY GROUP (n = 256) | GRAVES CONTROL (n = 33) | REFERENCE COHORT (n = 118) |
|---|---|---|---|
| General health | 62 (24) | 92 (15) | 69 (24) |
| General vision | 60 (18) | 86 (16) | 83 (14) |
| Ocular pain | 71 (19) | 90 (18) | 90 (15) |
| Near activities | 71 (24) | 94 (12) | 92 (12) |
| Distance | 73 (23) | 94 (11) | 94 (11) |
| Social | 85 (20) | 96 (11) | 99 (4) |
| Mental health | 69 (24) | 93 (10) | 92 (12) |
| Role difficulties | 72 (26) | 96 (13) | 93 (13) |
| Dependency | 74 (28) | 90 (16) | 99 (4) |
| Driving | 74 (24) | 86 (28) | 87 (16) |
| Color vision | 94 (15) | 94 (22) | 98 (8) |
| Peripheral vision | 75 (27) | 94 (19) | 97 (10) |
| Total score | 73 (18) | 93 9.3) | 92 (7) |
Mean (SD) is shown.
TABLE 12.
COMPARISON OF GRAVES DISEASE VISION-RELATED QUALITY OF LIFE TO OCULAR DISEASE ASSOCIATED WITH VISUAL IMPAIRMENT BENCHMARKS*
| VFQ-25 | GRAVES STUDY GROUP | DIABETIC RETINOPATHY | ARMD | GLAUCOMA | CATARACT | CMV | LOW VISION | REFERENCE | F-VALUE |
|---|---|---|---|---|---|---|---|---|---|
| n | 256 | 110 | 85 | 69 | 89 | 38 | 92 | 118 | |
| General health | 62 (24) | 45 (25)§ | 66 (25)† | 62 (24) | 56 (24) | 46 (24)‡ | 58 (27) | 69(24) | 11.9 |
| General vision | 60 (18) | 65 (19) | 56 (19) | 73 (16)§ | 61 (18) | 77 (13)§ | 39 (17)§ | 83(14)§ | 67.4 |
| Ocular pain | 71 (19) | 87 (18)§ | 88 (15)§ | 88 (15)§ | 86 (19)§ | 90 (15)§ | 86 (20)§ | 90(15)§ | 1.1 |
| Near activities | 71 (24) | 67 (29) | 58 (27)§ | 82 (19)† | 74 (20) | 85 (20)† | 36 (22)§ | 92(12)§ | 67.4 |
| Distance activities | 73 (23) | 70 (30) | 59 (29)§ | 81 (21) | 74 (20) | 84 (18) | 39 (25)§ | 94 (11)§ | 57.4 |
| Social functioning | 85 (20) | 85 (22) | 79 (26) | 92 (15) | 88 (18) | 96 (9)† | 51 (32)§ | 99 (4)§ | 54.9 |
| Mental health | 69 (24) | 68 (29) | 63 (25) | 83 (18)§ | 78 (22)† | 75 (20) | 46 (27)§ | 92 (12)§ | 41.4 |
| Dependency | 74 (28) | 79 (29) | 79 (25) | 96 (12)§ | 88 (20)§ | 89 (12)‡ | 52 (31)§ | 99 (4)§ | 47.2 |
| Driving | 74 (24) | 61 (38)§ | 46 (37)§ | 82 (22) | 66 (29) | 83 (24) | 10 (22)§ | 87 (16)§ | 61.9 |
| Color vision | 94 (15) | 92 (18) | 88 (23) | 94 (15) | 92 (18) | 98 (9) | 71 (30)§ | 97 (10)§ | 23.5 |
| VFQ-25 total score | 73 (18) | 73 (22) | 68 (20) | 84 (13)§ | 78 (13) | 83 (11)† | 49 (19)§ | 92 (7)§ | 69.5 |
Mean (SD) is shown. Overall means significantly different at α = .01. Social desirability norms for acne population = 0.93 (1.03). Self-perception norms for acne population = 1.52 (1.12).
Significantly different from Graves study groups means with adjusted Tukey-Kramer P < .05.
Significantly different from Graves study groups means with adjusted Tukey-Kramer P < .01.
Significantly different from Graves study groups means with adjusted Tukey-Kramer P < .001.
We also find differences when comparing patient gender and age-groups of the Graves study group. Tables 13 and 14 show the results for the comparison of gender groups for the Graves study group and the control. Mean total VFQ and component scores for men and women in the Graves study group are not statistically different, except when comparing color vision (P = .0076). Self-perception was lower among women than men (P = .0187).
TABLE 13.
GRAVES DISEASE QUALITY OF LIFE BY GENDER SUBGROUP*
| CATEGORY | MALE (n = 43) | FEMALE (n = 213) | TOTAL (n = 256) |
|---|---|---|---|
| VFQ | |||
| General health | 65.00 (25.24) | 60.89 (24.10) | 61.74 (24.37) |
| General vision | 62.40 (17.85) | 59.05 (18.31) | 59.71 (18.26) |
| Ocular pain | 71.63 (18.64) | 70.90 (19.36) | 71.06 (19.17) |
| Near activities | 72.22 (24.53) | 70.87 (24.41) | 71.21 (24.41) |
| Distance activities | 77.52 (21.94) | 72.37 (23.63) | 73.34 (23.40) |
| Social functioning | 84.59 (22.80) | 85.12 (19.99) | 85.09 (20.43) |
| Mental health | 69.71 (21.69) | 68.26 (24.50) | 68.61 (24.02) |
| Role difficulties | 69.53 (27.34) | 71.85 (25.74) | 71.57 (25.99) |
| Dependency | 75.29 (27.61) | 73.68 (28.69) | 73.91 (28.41) |
| Driving | 75.66 (25.16) | 73.44 (23.43) | 73.92 (23.69) |
| Color vision* | 88.13 (20.40) | 95.10 (13.75) | 94.00 (15.16) |
| Peripheral vision | 75.00 (25.00) | 74.52 (27.29) | 74.70 (26.88) |
| Overall VFQ | 73.45 (17.95) | 72.78 (17.49) | 72.97 (17.55) |
| SF-12 | |||
| PCS-12 | 46.76 (9.17) | 44.47 (10.78) | 44.90 (10.55) |
| MCS-12 | 47.01(10.98) | 43.14(12.03) | 43.84(11.93) |
| Self-perception† | 1.17 (1.08) | 1.68 (1.30) | 1.58 (1.28) |
| Social desirability | 0.87 (0.98) | 1.01 (1.09) | 0.98 (1.07) |
Mean (SD) is shown. For VFQ and SF-12, a score of 100 is best and 0 is worst.
For social perception and social desirability, a score of 0 is best and 4 worst.
Means significantly different at α = .01, P =.0076.
Means significantly different at α = .05, P = .0187.
TABLE 14.
CONTROL GROUP QUALITY OF LIFE BY GENDER*
| CATEGORY | MALE (n = 10) | FEMALE (n = 23) |
|---|---|---|
| VFQ | ||
| General health | 96.50 (8.18) | 90.22 (16.41) |
| General vision | 91.67 (16.20) | 84.06 (16.27) |
| Ocular pain | 87.78 (12.01) | 94.35 (6.62) |
| Near activities | 92.50 (18.61) | 94.93 (8.61) |
| Distance activities | 93.33 (16.10) | 94.57 (8.18) |
| Social functioning | 97.50 (7.91) | 95.11(11.76) |
| Mental health | 90.38 (10.53) | 93.79 (9.25) |
| Role difficulties | 95.00 (15.81) | 96.52 (12.65) |
| Dependency | 91.25 (18.68) | 89.67(15.38) |
| Driving | 86.25 (31.43) | 85.33(27.86) |
| Color vision | 88.89 (25.34) | 100.00 (0) |
| Peripheral vision | 94.44 (11.02) | 97.83 (7.20) |
| OVERALL VFQ | 92.26 (13.89) | 93.74 (6.80) |
| SF-12 | ||
| PCS-12 | 55.45 (6.26) | 50.30 (10.57) |
| MCS-12 | 37.84 (26.44) | 49.02 (14.18) |
| Self-perception | 0.11 (0.33) | 0.25 (0.85) |
| Social desirability | 0 | 0.06 (0.22) |
Mean (standard) is shown. For VFQ and SF-12, a score of 100 is best and 0 is worst. For social perception and social desirability, a score of 0 is best and 4 worst.
A comparison of age-groups (Table 15) using an ANOVA F-test suggests that means among several age-groups are significantly different for the VFQ-25 mental health score, the VFQ role development score, the SF-12 physical component (PCS), the SF-12 mental component (MCS) , and the self-perception scale at α = .05. Pairwise comparisons using the Tukey-Kramer method for multiple comparisons suggest that the mean VFQ mental health of the 35- to 50-year age-group and the 50- to 60-year age-group is significantly lower than the mean of the 60+ age-group (P = .037 and P = .0042, respectively). The same procedure shows that the 60+ age-group PCS-12 (P = .017) and self-perception means (P = .0040) are significantly different from the means of the 35- to 50-year age-group, and the self-perception means are significantly different when comparing the 60+ and 50- to 60-year age-groups (P =.0007). Although none of the pairwise comparison of means of the role development VFQ score is significant when using the Tukey-Kramer test, utilizing Scheffe’s method for testing contrasts shows that the mean role development for the 50- to 60-year age-group is different from the average of the other means (P = .0027).
TABLE 15.
GRAVES DISEASE QUALITY OF LIFE BY AGE SUBGROUPS*
| CATEGORY | AGE 20–34 (n = 7) | AGE 35–49 (n = 68) | AGE 50–59 (n = 78) | AGE 60+ (n = 96) |
|---|---|---|---|---|
| VFQ | ||||
| General health | 65.00 (20.21) | 68.31 (20.01) | 58.22 (25.80) | 59.63 (26.10) |
| General vision | 59.52 (26.97) | 62.75 (18.46) | 58.23 (17.65) | 58.07 (18.01) |
| Ocular pain | 67.14 (17.99) | 69.56 (21.68) | 68.16 (19.64) | 73.96 (16.45) |
| Near activities | 80.95 (19.67) | 71.58 (24.38) | 66.35 (25.74) | 73.48 (22.88) |
| Distance activities | 79.76 (21.97) | 74.82 (25.62) | 70.25 (23.14) | 73.26 (22.29) |
| Social functioning | 91.07 (15.67) | 85.82 (21.31) | 81.57 (20.42) | 86.97 (19.03) |
| Mental health† | 69.82 (29.51) | 66.26 (23.65) | 63.40 (25.37) | 73.33 (22.23) |
| Role difficulties‡ | 90.00 (17.32) | 71.79 (26.62) | 65.00 (28.41) | 74.58 (22.80) |
| Dependency | 71.43 (24.70) | 78.54 (24.60) | 67.95 (32.08) | 74.60 (27.89) |
| Driving | 82.14 (17.47) | 76.12 (18.56) | 67.54 (25.75) | 76.66 (24.36) |
| Color vision | 100.00 (0) | 95.15 (12.49) | 91.78 (17.98) | 94.35 (15.25) |
| Peripheral vision | 89.29 (19.67) | 76.49 (28.16) | 69.16 (29.22) | 75.54 (24.16) |
| Overall VFQ | 78.84 (16.17) | 74.57 (17.41) | 68.69 (18.66) | 74.24 (16.38) |
| SF-12 | ||||
| PCS-12§ | 45.57 (12.57) | 48.18 (9.86) | 44.27 (9.85) | 42.89 (11.06) |
| MCS-12¶ | 43.81 (15.73) | 41.97 (12.21) | 40.71 (11.20) | 47.12 (11.23) |
| Self-perception# | 2.11 (1.57) | 1.83 (1.33) | 1.90 (1.38) | 1.14 (0.98) |
| Social desirability | 1.00 (1.39) | 1.08 (1.17) | 1.14 (1.11) | 0.81 (0.92) |
Mean (standard deviation) is shown.
Means significantly different at α = .05, P =.463.
Means significantly different at α = .05, P =.0197.
Means significantly different at α = .05, P = .0208
Means significantly different at α = .01, P = .0043
Means significantly different at α = .001, P = .0002
Table 16 shows the difference in means for several eye disease–related quality-of-life measures between the Graves study group and the control group, as well as a corresponding effect size difference (the difference in means divided by the standard deviation of the control group). Comparison by t tests of both mean and effect size differences suggests that the quality of life of the Graves study group is statistically and substantially less than the quality of life for the control group. This difference is highlighted in Table 17, where the means between both groups across the HR-QOL measures can be compared side to side. All of the measures, including the total VFQ and all the individual VFQ-25 subscores, the SF-12, the self-perception, and the social desirability scales, are statistically significant, implying lower quality of life for the Graves study group.
TABLE 16.
EFFECT SIZE DIFFERENCE BETWEEN THE GRAVES STUDY GROUP AND CONTROL*
| VARIABLE | DIFFERENCE BETWEEN THE CONTROL AND GRAVES STUDY GROUP | EFFECT SIZE |
|---|---|---|
| VFQ | ||
| General health† | 30.83 | 2.11 |
| General vision† | 26.22 | 1.60 |
| Ocular pain† | 21.31 | 2.42 |
| Near activities† | 22.39 | 1.83 |
| Distance activities† | 20.42 | 1.87 |
| Social functioning† | 11.13 | 1.04 |
| Mental health† | 24.36 | 2.53 |
| Role difficulties† | 24.63 | 1.83 |
| Dependency† | 16.33 | 1.01 |
| Driving† | 18.02 | 0.97 |
| Color vision | 2.25 | 0.16 |
| Peripheral vision† | 22.00 | 2.62 |
| VFQ-Total† | 20.28 | 2.18 |
| SF-12 | ||
| PCS-12‡ | 6.87 | 0.70 |
| MCS12† | 8.19 | 0.94 |
| Self-perception† | −1.45 | −1.99 |
| Social desirability † | −0.96 | −5.05 |
This table shows a measure of effect size. The effect size formula used is the following: (mean of control group – mean of study group) / standard deviation of control group. This formula indicates the size difference of the mean between treatment and control when compared to the dispersion or variability of the control scores. A large effect size is conventionally .80, a medium effect is .50, and a low effect size is .20.
Difference between control and study group is significant at α = .001
Significance at α = .01.
TABLE 17.
QUALITY-OF-LIFE DIFFERENCES BETWEEN THE CONVENIENCE SAMPLE, CASE-SERIES, AND CONTROL GROUP*
| VARIABLE | CASES SERIES (n = 53) | CONVENIENCE GROUP (n = 203) | GRAVES STUDY GROUP (n = 256) | CONTROL (n = 33) |
|---|---|---|---|---|
| VFQ | ||||
| General health | 63.46 (20.95) | 61.29 (25.21) | 61.74 (24.37) | 92.12 (14.58)† |
| General vision | 58.01 (18.81) | 60.15 (18.14) | 59.71 (18.26) | 86.36 (16.38)† |
| Ocular pain | 70.57 (19.75) | 71.19 (19.07) | 71.06 (19.17) | 92.50 (8.80)† |
| Near activities | 68.95 (26.27) | 71.80 (23.93) | 71.21 (24.41) | 94.19 (12.23)† |
| Distance activities | 71.70 (26.08) | 73.77 (22.71) | 73.34 23.40) | 94.19 (10.92)† |
| Social functioning | 86.56 (18.96) | 84.70 (20.82) | 85.09 (20.43) | 95.83 (10.67)‡ |
| Mental health | 69.41 (22.37) | 68.39 (24.49) | 68.61 (24.02) | 92.75 (9.62)† |
| Role difficulties | 72.08 (26.84) | 71.44 (25.83) | 71.57 (25.99) | 96.06 (13.45)† |
| Driving | 77.17 (20.12) | 73.11 (24.48) | 73.92 (23.69) | 91.13 (18.59)¶ |
| Color vision | 91.50 (20.58) | 94.63 (13.47) | 94.00 (15.16) | 96.88 (13.84) |
| Peripheral vision | 74.06 (27.72) | 74.87 (26.72) | 74.70 (26.88) | 96.88 (8.40)† |
| Overall VFQ | 72.82 (18.30) | 73.02 (17.39) | 72.97 (17.55) | 93.29 (9.30)† |
| SF-12 | ||||
| PCS-12 | 45.82 (10.26) | 44.68 (10.63) | 44.90 (10.55) | 51.55 (9.86)§ |
| MCS-12 | 44.27 (11.65) | 43.74 (12.02) | 43.84 (11.93) | 51.93 (8.67) |
| Self-perception | 1.39 (1.21) | 1.64 (1.30) | 1.58 (1.28) | 0.21 (0.74)† |
| Social desirability | 0.90 (1.03) | 1.00 (1.08) | 0.98 (1.07) | 0.04 (0.19)† |
Mean (SD) is shown. For VFQ and SF-12, a score of 100 is best and 0 is worst. For social perception and social desirability, a score of 0 is best and 4 worst. The case series and convenience sample scores are not significantly different from each other.
Control significantly different from convenience and case series samples at α = .001 using Dunnett’s method (one-sided)
Control significantly different from convenience sample at α = .01 and case series at α = .05.
Control significantly different from convenience sample at α = .01 and case series at α = .01. Control significantly different from convenience sample α = .001 and case series at α = .01.
Clinical severity scores were derived by assessment of disease severity from clinical examination of the individual patients. Mean scores for the four assessments or clinical scales are shown in Table 18. Each scale was additionally categorized into mild, moderate, moderate-severe, and severe; the higher the score, the more severe the disease.
TABLE 18.
GRAVES STUDY GROUP CLINICAL SEVERITY SCORES*
| SEVERITY SCALES | MEAN (SD) | RANGE | SKEWNESS |
|---|---|---|---|
| Neuropathy | 15.97 (17.48) | 2–82 | 2.01 |
| Myopathy | 14.07 (11.63) | 0–55 | 1.53 |
| Cosmesis | 13.38 (10.21) | 0–65 | 0.83 |
| Keratopathy | 11.02 (10.19) | 0–54 | 1.32 |
Severity scales were derived by assessment of severity from individual clinical characteristics of the individual. Scales were additionally categorized subjectively into mild, moderate, moderate-severe, and severe.
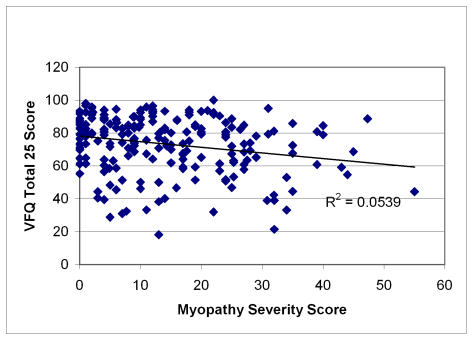
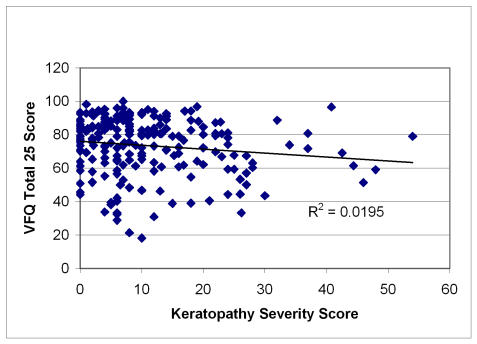
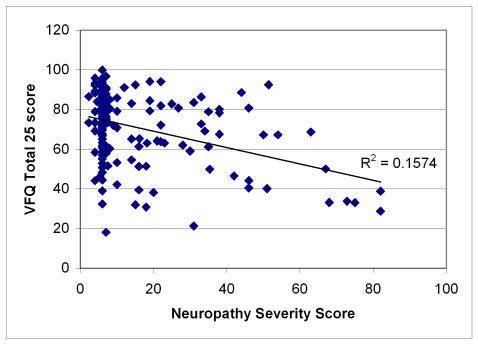
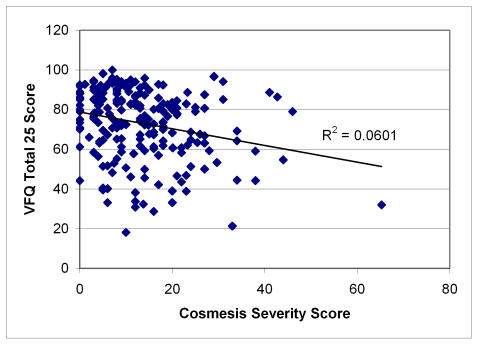
Figures 1 through 4 plot severity scores versus the total VFQ scores. Of all the four severity scores, neuropathy is most highly correlated (r = −.39) with the VFQ-25 than the other severity measures, with myopathy (r = −.23) and cosmesis (r = −.24) being next in magnitude and keratopathy having the lowest correlation (r = −.14). The figures suggest that the high neuropathy scores are more likely to be present with decreased quality of life. In order to develop the quality-of-life scale related to Graves disease, Tables 19, 20, and 21 show the quality-of-life–related items that correlate and discriminate best with the neuropathy, cosmesis, and myopathy disease severity measures. Keratopathy was excluded from consideration because of its lower correlation with quality of life as well as its high correlation with cosmesis severity (r = −.74). None of the other severity indicators were highly correlated among each other; the next highest correlation is between myopathy and cosmesis (r = −.40).
FIGURE 1.
Scatter plot of myopathy severity scores versus quality of life in Graves study group. Pearson correlation = −.23; regression slope significant at α = .001, P =.0007.
FIGURE 4.
Scatter plot of keratopathy severity score versus quality of life in Graves study group. Pearson correlation = −.14; regression slope significant at α = .05, P = .0407.
TABLE 19.
BEST AND WORST ITEMS ASSESSING NEUROPATHY
| 10 BEST CORRELATED ITEMS (PEARSON) | 10 BEST DISCRIMINATORS* | ITEMS WITH FACE VALIDITY† | BEST SCORERS ABOVE 10 POINTS‡ |
|---|---|---|---|
| Q32 (10 pts) | Q41 (10pts) | Q5,Q21,Q19,Q20 | Q32(18) |
| Q33 | Q25 | Q23,Q24,Q25,Q26 | Q41(18) |
| Q41 | Q32 | Q27,Q28,Q29,Q31 | Q25(18) |
| Q31 | Q35 | Q34,Q35,Q39 | Q31(15) |
| Q25 | Q26 | Q26(14) | |
| Q26 | Q31 | Q33(13) | |
| Q39 | Q33 | ||
| Q5 | Q5 | ||
| Q27 | Q27 | ||
| Q21 (1 pt) | Q39 (1 pt) | ||
| 10 WORST CORRELATED ITEMS§ | 10 WORST VFQ DISCRIMINATORS§ | WORST SCORERS ABOVE 10 POINTS | |
| Q52 (10 pts) | Q17 (10pts) | Q52 (22 pts) | |
| Q17 | Q52 | Q17 (22) | |
| Q53 | Q7 | Q7(19) | |
| Q7 | Q24 | Q20(12) | |
| Q20 | Q20 | Q24(12) | |
| Q24 | Q23 | Q53(10) | |
| Q38 | Q8 | ||
| Q46 | Q46 | ||
| Q3 | Q3 | ||
| Q51 (1pt) | Q38 (1pt) |
Discrimination assessed by ranking for largest effect size difference between mild neuropathy and moderate neuropathy.
Items expected to associate best with neuropathy.
Scoring formula for best scorers: add points for correlation and discrimination rank plus three points if item is in face validity list.
Scoring formula for worst scorers: add points for correlation and discrimination rank plus three points if item is not in list.
TABLE 20.
BEST AND WORST ITEMS ASSESSING COSMESIS
| 10 BEST CORRELATED ITEMS (PEARSON) | 10 BEST DISCRIMINATORS* | ITEMS WITH FACE VALIDITY† | BEST SCORERS ABOVE 10 POINTS‡ |
|---|---|---|---|
| Q19 (10 pts) | Q18 (10 pts) | Q63,Q92,Q19,Q38,Q37 | Q19 (20 pts) |
| Q41 | Q63 | Q53,Q72,Q73,Q80,Q82 | Q63 (12) |
| Q22 | Q77 | Q18 (10) | |
| Q12 | Q19 | ||
| Q33 | Q17 | ||
| Q25 | Q32 | ||
| Q93 | Q79 | ||
| Q30 | Q13 | ||
| Q79 | Q14 | ||
| Q61 (1 pt) | Q93 (1 pts) | ||
| 10 WORST VFQ CORRELATED ITEMS§ | 10 WORST VFQ DISCRIMINATORS§ | WORST SCORERS ABOVE 10 POINTS | |
| Q3 (10 pts) | Q57 (10 pts) | Q57(21 pts) | |
| Q52 | Q24 | Q44 (14) | |
| Q57 | Q40 | Q24 (14) | |
| Q44 | Q35 | Q3 (13) | |
| Q51 | Q23 | Q52 (12) | |
| Q35 | Q52 | Q23 (10) | |
| Q27 | Q44 | ||
| Q21 | Q21 | ||
| Q24 | Q27 | ||
| Q23 (1 pts) | Q41 (1 pt) |
Discrimination assessed by ranking for largest effect size difference between mild neuropathy and moderate or severe cosmesis (grouping due to small sample size).
Items expected to associate best with cosmesis.
Scoring formula for best scorers: add points for correlation and discrimination rank plus three points if item is in face validity list.
Scoring formula for worst scorers: add points for correlation and discrimination rank plus three points if item is not in list.
TABLE 21.
BEST AND WORST ITEMS ASSESSING MYOPATHY
| 10 BEST CORRELATED CANDIDATE ITEMS (PEARSON) | 10 BEST DISCRIMINATORS* | ITEMS WITH FACE VALIDITY† | BEST SCORERS ABOVE 10 POINTS‡ |
|---|---|---|---|
| Q63 (10 pts) | Q45 (10 pts) | Q63,Q92,Q19,Q38,Q37 | Q63 (13 pts) |
| Q79 | Q38 | Q53,Q72,Q73,Q80,Q82 | Q30 (13 ) |
| Q85 | Q30 | Q38 (11) | |
| Q12 | Q41 | Q45 (10) | |
| Q36 | Q75 | ||
| Q30 | Q64 | ||
| Q88 | Q10 | ||
| Q13 | Q43 | ||
| Q41 | Q12 | ||
| Q74 (1 pt) | Q24 (1 pt) | ||
| 10 WORST VFQ CORRELATED ITEMS§ | 10 WORST VFQ DISCRIMINATORS§ | WORST SCORERS ABOVE 10 POINTS | |
| Q3 (10 pt) | Q29 (10 pts) | Q52 (19 pts) | |
| Q52 | Q17 | Q17 (17) | |
| Q44 | Q47 | Q3 (14) | |
| Q21 | Q52 | Q29 (13) | |
| Q57 | Q53 | Q44 (11) | |
| Q17 | Q8 | Q21 (10) | |
| Q27 | Q7 | ||
| Q51 | Q50 | ||
| Q35 | Q31 | ||
| Q53 (1 pt) | Q3 (1 pt) |
Discrimination assessed by ranking for largest Cohen effect size difference between mild neuropathy and moderate or severe myopathy (grouping due to small sample size).
Items expected to associate best with myopathy.
Scoring formula for best scorers: add points for correlation and discrimination plus rank plus three points if item is in face validity list.
Scoring formula for worst scorers: add points for correlation and discrimination rank plus three points if item is not in list.
FIGURE 2.
Scatter plot of neuropathy severity score versus quality of life in Graves study group. Pearson correlation = −39; regression slope significant at α = .001, P < .0001.
FIGURE 3.
Scatter plot of cosmesis severity score versus quality of life in Graves study group. Pearson correlation = −.24; regression slope significant at α = .001, P = .0003.
Table 22 shows the proposed scale assessing Graves disease quality of life using the item selection method described in Tables 12 through 14. The internal consistency of the resulting scale is 0.89. Some candidate items that performed well based on the criteria described in these tables, such as Q18, Q12, and Q32, were dropped from the analysis because they decreased the overall reliability of the scale, had low item-to-total correlation, or suffered from excessive nonresponse.
TABLE 22.
ITEMS COMPRISING PROPOSED QUALITY-OF-LIFE GRAVES SCALE*
| CATEGORY AND VARIABLE | DESCRIPTION | CORRELATION WITH TOTAL† | FACTOR LOADING‡ |
|---|---|---|---|
| General Vision | |||
| Q63§ | Please rate current appearance of eyes | .49 | .51 |
| Q19 | Eye symptoms interfere with well-being | .60 | .61 |
| Near Activities | |||
| Q30§ | Noticing object or activities off to the side while you are walking along | .65 | .72 |
| Q26§ # | Finding something in a crowded shelf | .68 | .77 |
| Q33# | Figuring whether bills you receive are accurate | .66 | .72 |
| Distance Activities | |||
| Q41# | Going out to see movie and theatre or sports | .74 | .85 |
| Q31# | Recognizing people from across the room | .62 | .70 |
| Social Functioning | |||
| Q32# | Seeing how people react to things you say | .69 | .78 |
| Q38§ | Visiting with people you don’t know well in their homes, at parties, or in restaurants | .70 | .80 |
Items Q18 and Q12 were dropped due to low item-to-total correlation, factor loadings.
Overall Cronbach α = .89.
A principal iterated factor analysis was used to calculate the factor loadings. Main factor explains approximately 58% of item variation.
Item was selected based on association with neuropathy.
Item was selected based on association with myopathy.
Item was selected based on association with cosmesis.
Table 22 also shows the factor loadings from factor analysis conducted on the item set. Only one factor was selected based on examining the screeplot of factor eigenvalues and using the Kaiser greater than one criterion. This main factor explains approximately 58% of the variance.
Finally, Table 23 shows the descriptive statistics of this proposed scale and a comparison with the overall VFQ score. The means, standard deviations, ranges, and skew are similar. As expected, the correlation between the proposed Graves disease quality-of-life scale and the severity scores is stronger than the correlation between the VFQ and the severity measures.
TABLE 23.
COMPARISON OF PROPOSED GRAVES SCALE WITH VFQ- 25
| CLINICAL OUTCOME | PEARSON CORRELATION FOR VFQ-25 TOTAL | PERSON CORRELATION FOR PROPOSED GRAVES SCALE* |
|---|---|---|
| Neuropathy | −0.40 | −0.49 |
| Cosmesis | −0.24 | −0.32 |
| Myopathy | −0.23 | −0.28 |
| Keratopathy | −0.14 | −0.21 |
| Descriptive statistics | ||
| Mean* | 72.96 | 76.30 |
| Standard deviation | 17.54 | 19.05 |
| Range* | [0 worst ,100 best] | [0 worst ,100 best] |
| Observed range* | [18,100] | [21,100] |
| Skew | −0.84 | −0.90 |
| Correlation with VFQ-25 in analysis group | 1.00 | .92 |
| Correlation with VFQ-25 in control group | 1.00 | .95 |
Scaled from 0 to 100. Nine items (shown in Table 22) compose the scale.
DISCUSSION
Patients with Graves ophthalmopathy frequently experience cosmetic disfigurement and functional disability.1-5 Pain, proptosis, ocular injection, swelling of the eyelids, grittiness of the eyes, diplopia, and, less often, blindness may result from this inflammatory orbitopathy. Although many of the signs of Graves ophthalmopathy can be objectively measured or quantified, the effect of the disease on the patient’s overall well-being or health-related quality of life is less defined and has only recently been studied.6 Gerding and associates56 investigated the quality of life in a cohort of 70 consecutive patients with Graves ophthalmopathy using a general questionnaire composed of 24 questions from the Medical Outcomes Study (MOS-24) and three subscales of the SIP. Comparison to a large published reference group showed low scores in the categories of physical functioning, social functioning, mental health, health perceptions, and bodily pain when compared with the reference group. Notably, the MOS-24 and SIP scores did not correlate with the duration, severity, or activity of the Graves ophthalmopathy, suggesting the negative impact of the disease may not be related to the usually assessed clinical parameters.
Gerding’s finding of a decreased quality of life in patients with Graves ophthalmopathy cannot be understated; however, findings using a generic health status questionnaire for vision-related disease may be questioned, not only because of the lack of correlation with clinical parameters of disease severity, but also because of the perceived insensitivity of generic questionnaires to visual changes and/or treatment effects. Terwee and colleagues53 have attempted to develop a disease-specific quality-of-life questionnaire for patients with Graves ophthalmopathy using vision-specific questions in an effort to evaluate the patient’s functional ability and overall well-being or health-related quality of life. The questionnaire was composed of items selected a priori from a variety of vision-related quality-of-life instruments, including the VF-14, AVDS, and the Vision Related SIP (VR-SIP), that were considered relevant for patients with Graves ophthalmopathy. Questions were added that explored the psychosocial consequences associated with changed appearance in this disease. Items were assigned to one of two groups, visual function or appearance, based on face value and correlation scores. The questionnaire was validated against subscale scores of the MOS-24 and SIP. Overall quality of life was reduced; however, severity of disease assessed by the NO SPEC classification correlated only moderately with visual functioning and had low correlation with appearance. The questionnaire design did not permit comparison to other visually impaired groups.
In this study, a battery of previously validated questionnaires was used that permitted comparison of a Graves disease cohort to other groups representing a variety of illnesses and, specifically, comparison to other visually impaired groups. The instruments used included the 51-item NEI-VFQ,43 the 12-item SF-12,22,23 an adapted version of the DSQL,34 and questions specific to Graves disease. Considering possible vision-specific instruments, very few questionnaires represent true multidimensional constructs that define a person’s subjective perception of the impact of health status on physical, psychological, and social functioning and well-being.18,19 The 51-item NEI-VFQ is one of these, representing a validated vision-specific questionnaire that approaches a multidimensional assessment of health-related quality of life. It was used in our questionnaire construct because of its design, as well as its utility and validity in assessing quality of life of the visually impaired in a variety of vision-related diseases. The shorter-version VFQ-25 has been found comparable to NEI-VFQ44; however, the more lengthy version was chosen for completeness and to subsequently establish a valid shorter construct for assessment of quality of life in Graves disease.
As a generic instrument of quality of life, the SF-12 complemented the vision-specific NEI-VFQ. The utility of the SF-12 is due to the relatively few items (to be added to a relatively lengthy questionnaire) as well as its frequent use and validity as a quality-of-life instrument. The DSQL was originally designed to assess the psychosocial consequences of acne. Both the acne and the Graves ophthalmopathy patients have concerns regarding appearance, and it would appear, on face value, that a validated instrument addressing this issue in the acne patient may have applicability in assessing the psychosocial consequences of Graves ophthalmopathy. Scales regarding social desirability and self-perception found in the DSQL are pertinent to an assessment of the quality of life of Graves disease patients, where the sequalae of the disease may be visually apparent to others, resulting in feelings of embarrassment and lack of self-confidence, leading to compromise in social interaction with others. Finally, Graves disease–specific questions were included to assess the following: (1) habits known to exacerbate ophthalmopathy (ie, smoking), (2) history of prior surgical intervention as a result of ophthalmopathy, and (3) symptoms related to exposure keratopathy that may affect visual function and quality of life.
The questionnaire was originally sent to all patients seen at the Wake Forest University Eye Center (representing the convenience sample), and there was a 62% response rate. Of the 122 patients who did not respond (38% nonrespondents), 21 questionnaires were returned to sender because of a recent change of address or because the patients were deceased. No effort was made to contact nonrespondents.
Although a 62% respondent rate may be considered an excellent response to a mailed survey, there was concern regarding possible study bias if only patients with significant ophthalmopathy were motivated to respond. The questionnaire was subsequently administered to 53 consecutive patients presenting for evaluation who were new patient registrants or who had not previously completed the questionnaire (case series). There were no significant differences between the convenience sample and the case series. This result would support the conclusion of Wolffsohn and colleagues,59 who investigated the most reliable method to implement a quality-of-life instrument. They found that postal implementation was the most cost-effective method, and the patients with greater visual impairment were no less likely to complete the questionnaire when implemented by post (ie, mail) than by interview. There was also no apparent bias from other people assisting them. Because there was no significant difference in the demographics, comorbidities, or response to the questionnaire of the convenience sample and case series, the two groups were combined for further statistical analysis (Graves study group).
The questionnaire results show a statistically significant lower score for all measures of quality of life when compared to a control group. These measures include all subscores of the NEI-VFQ except color vision; both the physical and mental components of the SF-12; and the self-perception and social desirability scales. The overall lower quality of life (summary score for each component) was neither age- nor gender-specific. These findings were not surprising when considering the consequences of Graves disease on visual function and cosmesis.
Although the decline in quality of life in Graves disease was not gender-specific, female gender was associated with a greater decline in self-perception. A decline in self-perception suggests that the disease affects a patient’s self-confidence and indicates frustration, anger, and concern about others’ negative appraisals of them. The decline in social desirability was observed in both men and women, indicating an effect of the disease on personal relationships, social interaction, and group activities. Male gender was associated with a decrease in color vision.
In regard to age, subscores for general health, general vision and visual functions, and dependency measures were similar across all age-groups. Role development, however, was preserved in the younger age cohort (20 to 34 years) when compared to all other age-groups. Role development queried opinions about one’s accomplishments. The score suggests that such a concern may not be perceived by the younger-aged Graves patient, or at least relatively young patients did not feel that the disease limited one’s future personal and social development. Such a limitation was perceived by the older Graves patient. Mental health scores were overall lower in the Graves disease cohort when compared to the control group and declined to a significantly greater degree in the 50- to 59-year-old group, as did the self-perception scale in the greater than 60-year-old group. Although this latter finding may be interpreted as secondary to perceptions of advancing age with associated physical limitation, these differences could not be explained by the younger age of the control group when compared to the Graves study group. Notably, there is no significant difference between the health-related comorbidities of the control group and the Graves study group, and additionally, when mean scores are adjusted for age, the difference in quality-of-life measures between the Graves study group and the control remains statistically significant.
The Graves study group showed a greater number of ocular disease–related comorbidities than the control group. It is unlikely that other ocular disease comorbidities played a significant role in the reduced quality of life because the number of Graves patients afflicted with ocular disease comorbidities was small. In the Graves study group, the most frequent ocular disease comorbidities were cataract in 26 patients (10%), followed by glaucoma in 11 patients (4%) and macular degeneration in 8 patients (3%). Cataract, glaucoma, and macular degeneration are more commonly observed in the elderly patient. The health-related quality of life in the Graves study group was reduced in all age-groups, suggesting minimal effect of these diseases on the assessment of quality of life in the Graves disease study cohort.
The use of the NEI-VFQ or its shortened sister version, the VFQ-25, permits comparison to other visually impaired groups and national norms. Overall, patients with Graves disease are most comparable to patients with diabetic retinopathy across all measures of the VFQ, although diabetic patients have a statistically significant lower score for general health as do patients with cytomegalovirus retinitis. Ocular pain, not generally considered a hallmark of Graves disease, is more frequently experienced in Graves disease than in other diseases with VFQ benchmarks. Complaints of pain can often be elicited from Graves disease patients when queried, but this information is often not volunteered by the patient. Pain may accompany significant exposure keratitis or dry eye associated with eyelid malposition or assume a pressure quality due to periorbital swelling, extraocular muscle enlargement, or an increase in orbital fat volume associated with proptosis. Among visually impaired groups, only patients with low vision and macular degeneration have overall VFQ-25 scores lower than patients with Graves disease, although this difference is statistically significant only with the low-vision group.
Validation of VFQ subset scores by comparison to national VFQ-25 reference cohort and to our control group shows that our reference group is statistically similar to the national reference group. Only the general health subscore varied significantly, suggesting that our control group, composed of employees at our university eye center, perceived that they were healthier than the national normative group. The comparison of Graves patient subscores to our control is likely valid as there was no significant difference in comorbidities between the control group and the Graves study group. The difference in general health perceptions between the control group and national control cohort may reflect the thoughts of gainfully employed individuals in the health care field.
The correlation of individual questionnaire items to clinical measures of disease and to the overall VFQ was undertaken to establish a short quality-of-life questionnaire with clinical disease severity correlation. Although measures of disease burden can be objectively assessed, how each parameter relates to the overall measure of clinical severity of Graves disease is controversial. The NO SPECS classification proposed by Werner and subsequently promoted by the American Thyroid Association has been the subject of debate and criticism since its introduction in 1969.7,8,60 Bartley has highlighted these objections and reviewed alternative classifications of Graves disease severity or activity.7 Few would argue with Perros and associates,61 who stated that “the ideal system for grading TAO [thyroid-associated ophthalmopathy] does not exist.”
It was not the purpose of this investigation to propose or promote a particular method of grading disease burden in either its severity or its intensity. Although it is difficult to classify disease severity by a single score or index, arguably one can more easily define and measure clinical parameters that affect a single clinical function. For this study, we chose to measure disease burden in each of four areas of potential clinical involvement, namely, myopathy, neuropathy, exposure keratopathy, and cosmesis. These measures were determined for the purpose of using these four individual measures for clinical correlation with quality of life. Although this division of clinical involvement in Graves disease may seem arbitrary, these four areas represent the classifiable complications of the disease. The degree of myopathy, neuropathy, keratopathy, and cosmetic deformity was easily quantified and their effect on quality of life assessed. A single clinical measure (eg, eyelid retraction) may contribute to more than one of the four areas of clinical involvement. Eyelid retraction, for example, may be a manifestation of a myopathy involving the levator palpebrae superioris muscle but may also contribute to cosmesis and exposure keratopathy. Myopathy score would also include a motility score and a score for presence of diplopia, whereas a score of cosmesis includes a measure of periorbital edema and proptosis.
Of the four clinical severity scores, neuropathy is the most highly correlated with the VFQ scores. This is not a surprising result when comparing patients with Graves ophthalmopathy to other visually impaired groups. Considering the VFQ, those who had low vision or who had potential loss of central vision had the lower total VFQ scores. Those with Graves disease have VFQ scores that are statistically indistinguishable from those with macular degeneration.
Myopathy and cosmesis had a lower correlation than patients afflicted with neuropathy. Those with exposure keratopathy had the lowest correlation with VFQ scores. A lower correlation suggests that quality of life is multifactorial and our measures of clinical involvement have little relationship with an individual patient’s perception of the impact of the disease on the quality of his or her life. This result is similar to the findings of Terwee and associates,53 who suggested that this lack of correlation is the essence of health-related quality-of-life measurements. The low correlation between the objective measure of proptosis and the subjective perception of changed appearance by the patient illustrates well the lack of correlation between a physician’s objective findings and the patient’s subjective perception. Indeed, quality-of-life questionnaires appraise patient perceptions and may provide information of the effect of a disease beyond a physician’s objective assessment.
All questionnaire items were analyzed in regard to their correlation with clinical severity measures as well as with the overall VFQ scale validity to develop a valid quality-of-life questionnaire that could be easily administered. Although the administration of multiple validated quality-of-life instruments may be useful to measure quality of life in a Graves disease cohort, items within such a questionnaire may overlap and a lengthy questionnaire may be impractical and laborious to administer. Nine items of the 105-item questionnaire correlate with clinical measures of disease severity and have validity on face value, as well as showing high correlation with the overall VFQ. We propose these nine items as the Graves Ophthalmopathy Quality-of-Life Scale (GO-QLS) (Appendix 3).
Pearson correlation for the proposed GO-QLS ranged from −0.21 for keratopathy to −.049 for neuropathy and may be considered fair to excellent, respectively, for a quality-of-life questionnaire. One-to-one correlation is not expected nor anticipated, because a patient’s subjective perception and the physician’s objective measurement of a physical parameter may differ.
When comparing our proposed GO-QLS to the GO-QOL of Terwee and colleagues, both show the negative impact of this disease on the quality of life of those so afflicted. Although results are similar, how the results were obtained are not. Of the 70 patients completing Terwee’s questionnaire in the Netherlands, 46 patients were administered a questionnaire culled from the VF-14, the ADVS, and the VR-SIP, that were “considered relevant for patients with Graves ophthalmopathy” based on discussions with patients and experienced physicians. Additional questions were asked of the remaining 24 patients after completing a questionnaire with open-ended questions about signs, symptoms, and problems associated with their disease. Although these items may be relevant, questions chosen a priori may not fully evaluate the overall visual quality of life or permit correlation to national standardized norms or to other vision-impaired groups. Questions regarding cycling, a common mode of transportation in the Netherlands, are less applicable to the US population, who heavily rely on the automobile. Whereas the GO-QOL survey queries limitations with reading, driving, and hobbies, we found little correlation between the overall vision quality of life and disease severity with these functions. The proposed GO-QLS, in contrast, shows that activities related to visual discrimination are most correlated with visual quality of life. These activities would include finding an object on a crowded shelf, recognizing facial features from across a room, or enjoying a movie or sporting event. In each of these visual activities, a patient is confronted with multiple visual stimuli or required to discriminate objects or features. Although walking was not specifically impaired, noticing objects to the side while ambulating is problematic and correlates with myopathy associated with Graves disease. Each of these queries in the GO-QLS correlates with the overall VFQ-25 score and was selected a posteriori by correlation with disease severity correlation and validated on face value.
Self-assessment of health by the patient presents an opportunity to evaluate the effect of treatment from the patient’s perspective. The patient’s evaluation of the effects of treatment of Graves disease was recommended by a joint committee of the thyroid association as early as 19926,15 and increasingly is being required in national collaborative studies of eye disease. This study, as well as those of Terwee and associates,6,17 assists in identification of important determinates of health-related quality of life that will allow a better assessment of treatment modalities and patient care.
Limitations of this study include a relatively low response rate to the questionnaire mailing. Only 203 (62%) of 325 questionnaires were returned. Assessment of respondent bias by administration of the questionnaire to 53 consecutive patients showed no difference between the two groups, suggesting that the mailed questionnaire was statistically representative of patients presenting to an academic medical center for evaluation of ophthalmopathy. Although this study has shown a reduced quality of life in patients with Graves ophthalmopathy that is comparable to other visually impaired groups, the value of a questionnaire can only be assessed by its use prospectively. Such an instrument is useful only if it can measure changes in an individual’s quality of life associated with changes in disease severity or can denote changes in quality of life associated with treatment. The sensitivity of the proposed GO-QLS in detecting these changes and its utility in assessing changes in quality of life associated with treatment has not yet been assessed and is the subject of future study. Given the prevalence of Graves disease and the uncertainly of optimal treatment,62–64 quality-of-life measures may play an important role addressing issues surrounding treatment in this disease.
In summary, patients with Graves ophthalmopathy show a reduction in both physical and mental health measures. Self-image is also reduced when compared with control subjects. When compared with other visually impaired groups, vision-related quality of health is similar to those patients afflicted with diabetic retinopathy or age-related macular degeneration. Only patients with low vision show a greater reduction in quality of life than those aforementioned groups. Pain, commonly experienced by the patient afflicted with Graves disease, is uncommon in other vision-impaired groups. Correlation with objective clinical measures of disease severity is moderate in patients with compressive optic neuropathy and correlates to a lesser degree in patients with myopathy or exposure keratopathy. Cosmesis correlates poorly with quality-of-life measures using previously validated quality-of-life instruments. Correlation of questionnaire items with clinical measures of disease severity and of face value validity yielded a short Graves Ophthalmopathy Quality-of-Life Scale (Appendix 3) that correlates highly with the NEI-VFQ. This scale may be a useful instrument to evaluate the effect of therapeutic interventions in the treatment of this disorder.
ACKNOWLEDGMENTS
The author acknowledges Roger Anderson, PhD, and Fabian Camacho, MS, from the Division of Public Health Sciences, Wake Forest University School of Medicine, Winston-Salem, North Carolina, for assistance in study design and statistical analysis.
APPENDIX 1 GRAVES QUALITY-OF-LIFE QUESTIONNAIRE
APPENDIX 1 FIGURE 1.
Page 1, Graves Quality-of-Life Questionnaire.
APPENDIX 1 FIGURE 2.
Page 2, Graves Quality-of-Life Questionnaire.
APPENDIX 1 FIGURE 3.
Page 3, Graves Quality-of-Life Questionnaire.
APPENDIX 1 FIGURE 4.
Page 4, Graves Quality-of-Life Questionnaire.
APPENDIX 1 FIGURE 5.
Page 5, Graves Quality-of-Life Questionnaire.
APPENDIX 1 FIGURE 6.
Page 6, Graves Quality-of-Life Questionnaire.
APPENDIX 1 FIGURE 7.
Page 7, Graves Quality-of-Life Questionnaire.
APPENDIX 1 FIGURE 8.
Page 8, Graves Quality-of-Life Questionnaire.
APPENDIX 1 FIGURE 9.
Page 9, Graves Quality-of-Life Questionnaire.
APPENDIX 1 FIGURE 10.
Page 10, Graves Quality-of-Life Questionnaire.
APPENDIX 1 FIGURE 11.
Page 11, Graves Quality-of-Life Questionnaire.
APPENDIX 1 FIGURE 12.
Page 12, Graves Quality-of-Life Questionnaire.
APPENDIX 1 FIGURE 13.
Page 13, Graves Quality-of-Life Questionnaire.
APPENDIX 2 GRAVES CLINICAL WORKSHEET
The clinical records of the Graves study group were reviewed and graded in regard to four categories: (1) myopathy, (2) compressive optic neuropathy, (3) exposure keratopathy, and (4) soft tissue changes and cosmesis. A particular manifestation of Graves disease, such as eyelid edema or chemosis, may contribute to the soft tissue/cosmesis score but not to other categories. In contrast, eyelid retraction may be a manifestation of an orbital myopathy and may also contribute to exposure keratopathy. Therefore, eyelid retraction may contribute to the score for each of these categories. Scores on individual categories were graded as absent, mild, moderate, or severe based on the total score in each category. Scores are given in the parentheses below each individual observation. The minimum score for each category is zero; the maximum score is given below.
MYOPATHY
| Motility/ROM (raw score = summation of scores from 0 to –4 in all cardinal positions of gaze): | ||||
| ○ 0
(0) |
○ 1–5
(1) |
○ 6–10
(3) |
○ 11–15
(5) |
○ >15
(8) |
| Lid retraction (upper OD): | ||||
| ○ <2 mm
(0) |
○ 2–3 mm
(2) |
○ 3.1–5 mm
(5) |
○ >5 mm
(8) |
|
| Lid retraction (lower OD): | ||||
| ○ <2 mm
(0) |
○ 2–3 mm
(2) |
○ 3.1–5 mm
(5) |
○ >5 mm
(8) |
|
| Lid retraction (upper OS): | ||||
| ○ <2 mm
(0) |
○ 2–3 mm
(2) |
○ 3.1–5 mm
(5) |
○ >5 mm
(8) |
|
| Lid retraction (lower OS): | ||||
| ○ <2 mm
(0) |
○ 2–3 mm
(2) |
○ 3.1–5 mm
(5) |
○ >5 mm
(8) |
|
| Lid lag (OD): | ||||
| ○ Absent
(0) |
○ Present
(2) |
|||
| Lid lag (OS): | ||||
| ○ <Absent
(0) |
○ Present
(2) |
|||
| Strabismus/diplopia, primary gaze: | ||||
| ○ None | (0) | |||
| ○ AM or PM only | (2) | |||
| ○ AM and PM (or 25% or less of day) | (5) | |||
| ○ Diplopia only in side or vertical gaze | (4) | |||
| ○ 25% to 50% of day | (8) | |||
| ○ Constant | (12) | |||
| Positional changes in intraocular pressure: | ||||
| Tensions (primary versus upgaze; measured difference; OD): | ||||
| ○ <5 mm Hg
(0) |
○ 5–10 mm Hg
(4) |
○ >10 mm Hg
(8) |
||
| Tensions (primary versus upgaze; measured difference; OS): | ||||
| ○ <5 mm Hg
(0) |
○ 5–10 mm Hg
(4) |
○ >10 mm Hg
(8) |
||
COMPRESSIVE OPTIC NEUROPATHY
| Visual acuity (corrected) (OD): | ||||
| ○ 20/20
(0) |
○ 20/40+
(1) |
○ 20/50–20/80
(4) |
○ >20/80–20/200
(8) |
○ >20/200
(15) |
| Visual acuity (corrected) (OS): | ||||
| ○ 20/20
(0) |
○ 20/40+
(1) |
○ 20/50–20/80
(4) |
○ >20/80–20/200
(8) |
○ >20/200
(15) |
| Visual acuity (best corrected) (OU): | ||||
| ○ 20/20
(0) |
○ 20/40+
(1) |
○ 20/50–20/80
(4) |
○ >20/80–20/200
(8) |
○ >20/200
(15) |
| Visual Field: | ||||
| Mean deviation (OD): | ||||
| ○ No deviation
(0) |
○ 0–5 dB
(1) |
○ 5.1–10 dB
(5) |
○ >10 dB
(10) |
|
| Mean deviation (OS): | ||||
| ○ No deviation
(0) |
○ 0–5 dB
(1) |
○ 5.1–10 dB
(5) |
○ >10 dB
(10) |
|
| Foveal sensitivity (OD): | ||||
| ○ >30 db
(0) |
○ 27–30 db
(8) |
○ 24–26.9 db
(12) |
○ <24 db
(20) |
|
| Foveal sensitivity (OS): | ||||
| ○ >30 db
(0) |
○ 27–30 db
(8) |
○ 24–26.9 db
(12) |
○ <24 db
(20) |
|
| Pupils (afferent pupillary defect): | ||||
| ○ Absent
(0) |
○ Present
(15) |
|||
| Color vision (No. of plates missed) (OD): | ||||
| ○ <4
(0) |
○ ≥ 4
(5) |
|||
| Color vision (No. of plates missed) (OS): | ||||
| ○ <4
(0) |
○ ≥ 4
(5) |
|||
| Papilledema (OD): | Papilledema (OS): | |||
| ○ Absent
(1) |
○ Present
(15) |
○ Absent
(1) |
○ Present
(15) |
|
| Choroidal folds (OD): | Choroidal folds (OS): | |||
| ○ Absent
(1) |
○ Present
(5) |
○ Absent
(1) |
○ Present
(5) |
|
EXPOSURE KERATOPATHY
| Lid retraction (upper) (OD): | |||
| ○ <2 mm
(0) |
○ 2–3 mm
(3) |
○ 3.1–5 mm
(6) |
○ >5 mm
(10) |
| Lid retraction (upper) (OS): | |||
| ○ <2 mm
(0) |
○ 2–3 mm
(3) |
○ 3.1–5 mm
(6) |
○ >5 mm
(10) |
| Lid retraction (lower) (OD): | |||
| ○ <1 mm
(0) |
○ 1–2 mm
(3) |
○ 2.1–3 mm
(6) |
○ >3 mm
(10) |
| Lid retraction (lower) (OS): | |||
| ○ <1 mm
(0) |
○ 1–2 mm
(3) |
○ 2.1–3 mm
(6) |
○ >3 mm
(10) |
| Lagophthalmos (OD): | |||
| ○ None
(0) |
○ Slit
(2) |
○ 1–2 mm
(4) |
○ ≥3 mm
(8) |
| Lagophthalmos (OS): | |||
| ○ None
(0) |
○ Slit
(2) |
○ 1–2 mm
(4) |
○ ≥3 mm
(8) |
| Exophthalmometry (OD): | |||
| ○ <20 mm
(1) |
○ 20–23 mm
(2) |
○ 24–27 mm
(4) |
○ 28–30 mm
(8) |
| Exophthalmometry (OS): | |||
| ○ <20 mm
(1) |
○ 20–23 mm
(2) |
○ 24–27 mm
(4) |
○ 28–30 mm
(8) |
| Eye irritation: | |||
| ○ Absent
(0) |
○ AM or late PM only
(2) |
○ AM and late PM
(4) |
○ Present all day
(8) |
| Keratopathy (OD) | Keratopathy (OS) | ||
| ○ Absent | (0) | ○ Absent | (0) |
| ○ Present | (1) | ○ Present | (1) |
| ○ Min inferior 1/4 of cornea | (2) | ○ Min inferior 1/4 of cornea | (2) |
| ○ Inferior half of cornea | (6) | ○ Inferior half of cornea | (6) |
| ○ Diffuse punctate epithelial keratopathy | (10) | ○ Diffuse punctate epithelial keratopathy | (10) |
| ○ Corneal scarring | (12) | ○ Corneal scarring | (12) |
| Keratopathy (OD) | Keratopathy (OS) | ||
| ○ Corneal ulceration | (20) | ○ Corneal ulceration | (20) |
| Tearing | |||
| ○ None | (0) | ||
| ○ Early morning or evening only | (2) | ||
| ○ Morning and evening or > 25% a day | (6) | ||
| ○ ≥50% a day | (8) | ||
| ○ Constant | (12) | ||
SOFT TISSUE CHANGES/COSMESIS
| Eyelid edema (Grade) (OD): | Eyelid edema (Grade) (OS): | ||||||||
| ○ 0
(0) |
○ 1
(2) |
○ 2
(4) |
○ 3
(8) |
○4
(15) |
○ 0
(0) |
○ 1
(2) |
○ 2
(4) |
○ 3
(8) |
○ 4
(15) |
| Herniated orbital fat (Grade) (OD): | |||||||||
| ○ 0
(0) |
○ 1
(2) |
○ 2
(4) |
○ 3
(6) |
○4
(8) |
○ between intermuscular septae
(4) |
||||
| Herniated orbital fat (Grade) (OS): | |||||||||
| ○ 0
(0) |
○ 1
(2) |
○ 2
(4) |
○ 3
(6) |
○4
(8) |
○ between intermuscular septae
(4) |
||||
| Lid retraction (upper OD): | |||||||||
| ○ <2 mm
(0) |
○2–3 mm
(3) |
○3.1–5 mm
(6) |
○ >5 mm
(10) |
||||||
| Lid retraction (upper OS): | |||||||||
| ○ <2 mm
(0) |
○2–3 mm
(3) |
○3.1–5 mm
(6) |
○ >5 mm
(10) |
||||||
| Lid retraction (lower OD): | |||||||||
| ○ <1mm
(0) |
○1–2 mm
(1) |
○2.1–3 mm
(3) |
○ >3 mm
(6) |
||||||
| Lid retraction (lower OS): | |||||||||
| ○ <1 mm
(0) |
○1–2 mm
(1) |
○2.1–3 mm
(3) |
○ >3 mm
(6) |
||||||
| Exophthalmometry (OD): | |||||||||
| ○ <20 mm
(0) |
○20–23 mm
(2) |
○ 24–27 mm
(4) |
○ 28–30 mm
(8) |
○ >30 mm
(15) |
|||||
| Exophthalmometry (OS): | |||||||||
| ○ <20 mm
(0) |
○20–23 mm
(2) |
○ 24–27 mm
(4) |
○ 28–30 mm
(8) |
○ >30 mm
(15) |
|||||
| Difference between both eyes: | |||||||||
| ○ None
(0) |
○ 2–3
(3) |
○ 3.1–5
(6) |
○ >5
(10) |
||||||
| Chemosis (Grade) (OD): | Chemosis (Grade) (OS): | ||||||||
| ○ 0
(0) |
○ 1
(2) |
○ 2
(4) |
○ 3
(8) |
○ 4
(15) |
○ 0
(0) |
○ 1
(2) |
○ 2
(4) |
○ 3
(8) |
○ 4
(15) |
| Injection (Grade) (OD): | Injection (Grade) (OS): | ||||||||
| ○ 0
(0) |
○ 1
(2) |
○ 2
(4) |
○ 3
(8) |
○ 4
(15) |
○ 0
(0) |
○ 1
(2) |
○ 2
(4) |
○ 3
(8) |
○ 4
(15) |
| Eyelid erythema (Grade) (OD): | Eyelid erythema (Grade) (OS): | ||||||||
| ○ 0
(0) |
○ 1
(2) |
○ 2
(4) |
○ 3
(8) |
○ 4
(15) |
○ 0
(0) |
○ 1
(2) |
○ 2
(4) |
○ 3
(8) |
○ 4
(15) |
| Strabismus: | |||||||||
| ○ None | (0) | ||||||||
| ○ 25% or less of day | (4) | ||||||||
| ○ Diplopia only in side or vertical gaze | (4) | ||||||||
| ○ 25% to 50% of day | (6) | ||||||||
| ○ Constant | (10) | ||||||||
GRADING SCORE FOR MYOPATHY, NEUROPATHY, KERATOPATHY, AND COSMESIS
| Myopathy | Score |
| Minimum | 0 |
| Maximum | 62 |
| Absent | 0 |
| Mild | 1 – 12 |
| Moderate | 13 – 33 |
| Moderately severe | 34 – 47 |
| Severe | 48 – 62 |
| Optic Neuropathy/Visual Compromise | Score |
| Minimum | 0 |
| Maximum | 150 |
| Absent | 0 |
| Mild | 1 – 10 |
| Moderate | 11 – 75 |
| Moderately severe | 75 – 110 |
| Severe | 110 – 150 |
| Exposure Keratopathy | Score |
| Minimum | 0 |
| Maximum | 138 |
| Absent | 0 |
| Mild | 1 – 24 |
| Moderate | 24 |
| Moderately severe | 25 - 75 |
| Severe | 75 - 138 |
| Soft Tissue Changes/Cosmesis | Score |
| Minimum | 0 |
| Maximum | 199 |
| Mild | 0 – 30 |
| Moderate | 31 – 45 |
| Moderately severe | 45 – 70 |
| Severe | 71 – 199 |
APPENDIX 3 GRAVES OPHTHALMOPATHY QUALITY-OF-LIFE SCALE
-
Have eye symptoms interfered with your well-being?
Never
Infrequently
Frequently
Most of the time
Always
-
Please rate the current appearance of your eyes.
Excellent
Good
Fair
Poor
Very poor
Please rate how much difficulty you have with the following tasks using the following scale:
No difficulty at all
A little difficulty
Moderate difficulty
Extreme difficulty
Stopped because of my eyesight
Don’t do for reasons other than eyesight
-
Finding something on a crowded shelf
A B C D E F
-
Noticing objects or activities off to the side while you are walking along
A B C D E F
-
Figuring out whether bills you receive are accurate
A B C D E F
-
Recognizing people you know from across the room
A B C D E F
-
Going out to see movies, the theatre, or sports events
A B C D E F
-
Seeing how people react to things you say
A B C D E F
-
Visiting with people you don’t know well in their homes, at parties, or in restaurants
A B C D E F
Footnotes
Supported in part by the Kulynych Family Fund in Ophthalmology, Wake Forest University School of Medicine, Winston-Salem, North Carolina.
REFERENCES
- 1.Bartley GB, Fatourechi V, Kadramas EF, et al. Clinical features of Graves’ ophthalmopathy in an incident cohort. Am J Ophthalmol. 1996;121:284–290. doi: 10.1016/s0002-9394(14)70276-4. [DOI] [PubMed] [Google Scholar]
- 2.Bartley GB, Fatourechi V, Kadrmas EF, et al. Long-term follow-up of Graves ophthalmopathy in an incident cohort. Ophthalmology. 1996;106:958–962. doi: 10.1016/s0161-6420(96)30579-4. [DOI] [PubMed] [Google Scholar]
- 3.Burch HB, Wartofsky L. Graves’ ophthalmopathy: current concepts regarding pathogenesis and management. Endocr Rev. 1993;14:747–793. doi: 10.1210/edrv-14-6-747. [DOI] [PubMed] [Google Scholar]
- 4.Weetman AP. Thyroid-associated eye disease: pathophysiology. Lancet. 1991;338:25–28. doi: 10.1016/0140-6736(91)90013-f. [DOI] [PubMed] [Google Scholar]
- 5.Hales IB, Rundle FF. Ocular changes in Graves’ disease: a long-term follow-up study. Q J Med. 1960;29:113–126. [PubMed] [Google Scholar]
- 6.Terwee CB, Dekker FW, Prummel MF, et al. Graves’ ophthalmopathy through the eyes of the patient: a state of the art on health-related quality of life assessment. Orbit. 2001;20:281–290. doi: 10.1076/orbi.20.4.281.2608. [DOI] [PubMed] [Google Scholar]
- 7.Bartley GW. Evolution of classification systems for Graves’ ophthalmopathy. Ophthal Plast Reconstr Surg. 1995;11:229–237. doi: 10.1097/00002341-199512000-00001. [DOI] [PubMed] [Google Scholar]
- 8.Werner SC. Classification of the eye changes of Graves’ disease. J Clin Endocrinol Metab. 1969;29:982–984. doi: 10.1210/jcem-29-7-982. [DOI] [PubMed] [Google Scholar]
- 9.Werner SC. Modification of the classification of the eye changes of Graves’ disease. Am J Ophthalmol. 1977;83:725–727. doi: 10.1016/0002-9394(77)90140-4. [DOI] [PubMed] [Google Scholar]
- 10.Mourits MP, Koornneef L, Wiersinga WM, et al. Clinical criteria for the assessment of disease activity in Graves’ ophthalmopathy: a novel approach. Br J Ophthalmol. 1989;73:639–644. doi: 10.1136/bjo.73.8.639. [DOI] [PMC free article] [PubMed] [Google Scholar]
- 11.Bartalena L, Marcocci C, Bogazzi F, et al. A new ophthalmopathy index for quantification of eye changes of Graves’ disease. Acta Endocrinol (Copenh) 1998;121(suppl 2):190–192. [Google Scholar]
- 12.Feldon SE, Unsöld R. Graves’ ophthalmopathy evaluated by infrared eye-movement recordings. Arch Ophthalmol. 1982;100:324–328. doi: 10.1001/archopht.1982.01030030326022. [DOI] [PubMed] [Google Scholar]
- 13.Bahn RS, Gorman CA. Choice of therapy and criteria for assessing treatment outcome in thyroid-associated ophthalmopathy. Endocrinol Metab Clin North Am. 1987;16:391–407. [PubMed] [Google Scholar]
- 14.Van Dyk HJL. Orbital Graves’ disease: a modification of the “NO SPECS” classification. Ophthalmology. 1881;88:479–483. [PubMed] [Google Scholar]
- 15.Pinchera A, Wiersinga WM, Glinoer D, et al. Classification of eye changes of Graves’ disease. Thyroid. 1992;2:235–236. doi: 10.1089/thy.1992.2.235. [DOI] [PubMed] [Google Scholar]
- 16.Frueh BR. Why the NOSPECS classification of Graves’ eye disease should be abandoned with suggestions for the characterization on this disease. Thyroid. 1992;2:85–88. doi: 10.1089/thy.1992.2.85. [DOI] [PubMed] [Google Scholar]
- 17.Terwee CB, Gerding MN, Dekker FW, et al. Development of a disease specific quality of life questionnaire for patients with Graves’ ophthalmopathy. Br J Ophthalmol. 1998;82:773–779. doi: 10.1136/bjo.82.7.773. [DOI] [PMC free article] [PubMed] [Google Scholar]
- 18.Brown MM. Quality-of-life instruments. Evidence-Based Eye Care. 2001;2:196–197. [Google Scholar]
- 19.Parrish RK. Visual impairment, visual functioning and quality of life assessments on patients with glaucoma. Trans Am Ophthalmol Soc. 1996;94:919–1028. [PMC free article] [PubMed] [Google Scholar]
- 20.Anonymous. Study protocol for the World Health Organization project to develop a Quality of Life assessment instrument (WHOQOL) Qual Life Res. 1993;2:153–59. [PubMed] [Google Scholar]
- 21.Vitale S, Schein OD. Quantitative research in functional visual loss. Int Ophthalmol Clin. 2003;43:17–30. doi: 10.1097/00004397-200343020-00005. [DOI] [PubMed] [Google Scholar]
- 22.Ware JE. Sherbourne CD. The MOS 36-item Short Form Health Survey (SF-36) I: conceptual framework and item selection. Med Care. 1992;30:473–481. [PubMed] [Google Scholar]
- 23.Stewart AL, Hayes RD, Ware JE. The MOS Short-form General Health Survey: reliability and validity in a patient population. Med Care. 1988;26:724–35. doi: 10.1097/00005650-198807000-00007. [DOI] [PubMed] [Google Scholar]
- 24.Bergner M, Bobbitt RA, Pollard, et al. The Sickness Impact Profile: conceptual and methodology for the development of a health status measure. Int J Health Serv. 1976;6:393–415. doi: 10.2190/RHE0-GGH4-410W-LA17. [DOI] [PubMed] [Google Scholar]
- 25.Bassatt SS, Folstein MF. Cognitive impairment and functional disablility in the absence of psychiatric diagnosis. Psychiatr Med. 1991;21:77–84. doi: 10.1017/s0033291700014677. [DOI] [PubMed] [Google Scholar]
- 26.Anderson RT, Aaronson NK, Wilkin D. Critical review of the international assessment of health related quality of life. Qual Life Res. 1993;2:369–95. doi: 10.1007/BF00422215. [DOI] [PubMed] [Google Scholar]
- 27.Schag CA, Ganz PA, Heinrich RL. Cancer Rehabilitation Evaluation System—short form (CARES-SF). A cancer specific rehabilitation and quality of life instrument. Cancer. 1991;68:1406–13. doi: 10.1002/1097-0142(19910915)68:6<1406::aid-cncr2820680638>3.0.co;2-2. [DOI] [PubMed] [Google Scholar]
- 28.Bottomley A, Vanvoorden V, Flechtner H, et al. The challenges and achievements involved in implementing quality of life research in cancer clinical trials. Eur J Cancer. 2003;39:275–85. doi: 10.1016/s0959-8049(02)00729-3. [DOI] [PubMed] [Google Scholar]
- 29.Naughton MJ, Wiklund I. A critical review of dimension-specific measures of health-related quality of life in cross-cultural research. Qual Life Res. 1993;2:397–432. doi: 10.1007/BF00422216. [DOI] [PubMed] [Google Scholar]
- 30.Eypasch E, Williams JI, Wood-Dauphinee S, et al. Gastrointestinal Quality of Life Index: development, validation and application of a new instrument. Br J Surg. 1995;82:216–222. doi: 10.1002/bjs.1800820229. [DOI] [PubMed] [Google Scholar]
- 31.Irvine EJ. Quality of life: rational and methods for developing a disease-specific instrument for inflammatory bowel disease. Scand J Gastroenterol. 1993;199:22–27. doi: 10.3109/00365529309098351. [DOI] [PubMed] [Google Scholar]
- 32.Wyrwich KW, Nelson HS, Tierney WM, et al. Clinically important differences in health-related quality of life for patients with asthma: an expert consensus panel report. Ann Allergy Asthma Immunol. 2003;1:148–53. doi: 10.1016/S1081-1206(10)62169-2. [DOI] [PubMed] [Google Scholar]
- 33.Hays RD, Kallich JD, Mapes DL, et al. Development of the kidney disease quality of life (KDQOL) instrument. Qual Life Res. 1994;4:221–231. doi: 10.1007/BF00451725. [DOI] [PubMed] [Google Scholar]
- 34.Anderson R, Rajagopaian R. Responsiveness of the dermatology-specific quality of life (DSQL) instrument to treatment for acne vulgaris in a placebo-controlled clinical trial. Qual Life Res. 1998;7:723–734. doi: 10.1023/a:1008832917452. [DOI] [PubMed] [Google Scholar]
- 35.Kass MA, Heuer DK, Higginbotham EJ, et al. The Ocular Hypertension Treatment Study: a randomized trial determines that topical ocular hypotensive medication delays or prevents the onset of primary open-angle glaucoma. Arch Ophthalmol. 2002;120:701–713. doi: 10.1001/archopht.120.6.701. [DOI] [PubMed] [Google Scholar]
- 36.Zadnik K, Barr JT, Edrington TB, et al. Baseline findings in the Collaborative Longitudinal Evaluation of Keratoconus (CLEK) Study. Invest Ophthalmol Vis Sci. 1998;39:2537–2546. [PubMed] [Google Scholar]
- 37.Janz NK, Wren PA, Lichter PR, et al. Quality of life in newly diagnosed glaucoma patients: the Collaborative Initial Glaucoma Treatment Study. Ophthalmology. 2001;108:887–897. doi: 10.1016/s0161-6420(00)00624-2. [DOI] [PubMed] [Google Scholar]
- 38.Musch DC, Lichter PR, Guire KE, et al. The Collaborative Initial Glaucoma Treatment Study (CIGTS): study design, methods, and baseline characteristics of enrolled patients. Ophthalmology. 1999;106:653–662. doi: 10.1016/s0161-6420(99)90147-1. [DOI] [PubMed] [Google Scholar]
- 39.Margolis MK, Coyne K, Kennedy-Martin T, et al. Vision-specific instruments for the assessment of health-related quality of life and visual functioning: a literature review. Pharmacoeconomics. 2002;20:791–812. doi: 10.2165/00019053-200220120-00001. [DOI] [PubMed] [Google Scholar]
- 40.Scott IU, Schein OD, West S, et al. Functional status and quality of life measurement among ophthalmic patients. Arch Ophthalmol. 1994;112:329–335. doi: 10.1001/archopht.1994.01090150059023. [DOI] [PubMed] [Google Scholar]
- 41.Desai P, Reidy A, Minassian DC, et al. Gains from cataract surgery: visual function and quality of life. Br J Ophthalmol. 1996;80:868–873. doi: 10.1136/bjo.80.10.868. [DOI] [PMC free article] [PubMed] [Google Scholar]
- 42.Mills RP. Correlation of quality of life with clinical symptoms and signs at the time of glaucoma diagnosis. Trans Am Ophthalmol Soc. 1998;96:753–812. [PMC free article] [PubMed] [Google Scholar]
- 43.Mangione CM, Berry S, Spritzer K, et al. Identifying the content area for the 51-item National Eye Institute Visual Function Questionnaire: results from focus groups with visually impaired persons. Arch Ophthalmol. 1998;116:227–233. doi: 10.1001/archopht.116.2.227. [DOI] [PubMed] [Google Scholar]
- 44.Mangione CM, Lee PP, Gutierrez PR, et al. Development of the 25-item National Eye Institute Visual Function Questionnaire. Arch Ophthalmol. 2001;119:1050–1058. doi: 10.1001/archopht.119.7.1050. [DOI] [PubMed] [Google Scholar]
- 45.Clemons TE, Chew EY, Bressler SB, et al. National Eye Institute visual function questionnaire in the age-related eye disease study (AREDS): AREDS report no. 10. Arch Ophthalmol. 2003;121:211–217. doi: 10.1001/archopht.121.2.211. [DOI] [PMC free article] [PubMed] [Google Scholar]
- 46.Miskala PH, Hawkins BS, Mangione CM, et al. Responsiveness of the National Eye Institute Visual Function Questionnaire to changes in visual acuity: findings in patients with subfoveal choroidal neovascularization-SST report no.1. Arch Ophthalmol. 2003;121:531–539. doi: 10.1001/archopht.121.4.531. [DOI] [PMC free article] [PubMed] [Google Scholar]
- 47.Brody BL, Roch-Levcq AC, Gamst AC, et al. Self-management of age-related macular degeneration and quality of life: a randomized controlled trial. Arch Ophthalmol. 2002;120:1477–1483. doi: 10.1001/archopht.120.11.1477. [DOI] [PubMed] [Google Scholar]
- 48.Nichols KK, Mitchell GL, Zadnik K. Performance and repeatability of the NEI-VFQ-25 in patients with dry eye. Cornea. 2002;21:578–583. doi: 10.1097/00003226-200208000-00009. [DOI] [PubMed] [Google Scholar]
- 49.Cruickshanks KJ, Fryback DG, Nondahl DM, et al. Treatment choice and quality of life in patients with choriodal melanoma. Arch Ophthalmol. 1999;117:461–467. doi: 10.1001/archopht.117.4.461. [DOI] [PubMed] [Google Scholar]
- 50.Deramo VA, Cox TA, Syed AB, et al. Vision-related quality of life in people with central retinal vein occlusion using the 25-item National Eye Institute Visual Function Questionnaire. Arch Ophthalmol. 2003;121:1297–1302. doi: 10.1001/archopht.121.9.1297. [DOI] [PubMed] [Google Scholar]
- 51.Parrish RK, Gedde SJ, Scott IU, et al. Visual function and quality of life among patients with glaucoma. Arch Ophthalmol. 1997;115:1447–1455. doi: 10.1001/archopht.1997.01100160617016. [DOI] [PubMed] [Google Scholar]
- 52.Jampel HD. Glaucoma patients’ assessment of their visual function and quality of life. Trans Am Ophthalmol Soc. 2001;99:301–317. [PMC free article] [PubMed] [Google Scholar]
- 53.Terwee CB, Gerding MN, Dekker FW, et al. Test-retest reliability of the GO-QOL: a disease-specific quality of life questionnaire for patients with Graves’ ophthalmopathy. J Clin Epidemiol. 1999;9:875–884. doi: 10.1016/s0895-4356(99)00069-4. [DOI] [PubMed] [Google Scholar]
- 54.Terwee CB, Dekker FW, Mourits MP, et al. Interpretation and validity of changes in scores on the Graves’ ophthalmopathy quality of life questionnaire (GO-QOL) after different treatments. Clin Endocrinol. 2001;54:391–398. doi: 10.1046/j.1365-2265.2001.01241.x. [DOI] [PubMed] [Google Scholar]
- 55.Egle UT, Kahaly GJ, Petrak F, et al. The relevance of physical and psychosocial factors for the quality of life in patients with thyroid associated orbitopathy (TAO) Exp Clin Endocrinol Diabetes. 1999;107(suppl 5):S168–171. doi: 10.1055/s-0029-1212177. [DOI] [PubMed] [Google Scholar]
- 56.Gerding MN, Terwee CB, Dekker FW, et al. Quality of life in patients with Graves’ ophthalmopathy is markedly decreased: measurement by the Medical Outcomes Study instrument. Thyroid. 1997;7:885–889. doi: 10.1089/thy.1997.7.885. [DOI] [PubMed] [Google Scholar]
- 57.Guyatt GH, Bombardier C, Tugwell PX. Measuring disease-specific quality of life in clinical trials. Can Med Assoc. 1986;134:889–899. [PMC free article] [PubMed] [Google Scholar]
- 58.Patrick DL, Deyo RA. Generic and disease-specific measures in assessing health status and quality of life. Med Care. 1989;27:S217–32. doi: 10.1097/00005650-198903001-00018. [DOI] [PubMed] [Google Scholar]
- 59.Wolffsohn JS, Cochrane AL, Watt NA. Implementation methods for vision related quality of life questionnaires. Br J Ophthalmol. 2000;84:1035–1040. doi: 10.1136/bjo.84.9.1035. [DOI] [PMC free article] [PubMed] [Google Scholar]
- 60.Werner SC. Modification of the classification of the eye changes of Graves’ disease: recommendations of the Ad Hoc Committee of the American Thyroid Association [letter] J Clin Endocrinol Metab. 1977;44:203–204. doi: 10.1210/jcem-44-1-203. [DOI] [PubMed] [Google Scholar]
- 61.Perros P, Crombie AL, Matthews JNS, et al . Age and gender influence the severity of thyroid-associated ophthalmopathy: a study of 101 patients attending a combined thyroid-eye clinic. Clin Endocrinol. 1993;38:367–372. doi: 10.1111/j.1365-2265.1993.tb00516.x. [DOI] [PubMed] [Google Scholar]
- 62.Bartalena L, Marcocci C, Pinchera A. Orbital radiotherapy for Graves’ ophthalmopathy [editorial] J Clin Endocrinol Metab. 2004;89:13–14. doi: 10.1210/jc.2003-031769. [DOI] [PubMed] [Google Scholar]
- 63.Gorman CA, Garrity JA, Fatourechi V, et al. A prospective, randomized, single-blind, placebo-controlled study of orbital radiotherapy for Graves’ ophthalmopathy. Ophthalmology. 2001;108:1523–1534. doi: 10.1016/s0161-6420(01)00632-7. [DOI] [PubMed] [Google Scholar]
- 64.Bartalena L, Marcocci C, Bagazzi F, et al. Relation between therapy for hyperthyroidism and the course of Graves’ ophthalmopathy. N Engl J Med. 1998;338:73–78. doi: 10.1056/NEJM199801083380201. [DOI] [PubMed] [Google Scholar]


