

Abstract
Background
Incidence rates of both type 1 and type 2 diabetes mellitus (DM) are increasing in youth and may eventually contribute to premature heart disease in early adulthood. This investigation explored the influence of type of diabetes, gender, body mass index (BMI), metabolic control (HbA1c), exercise beliefs and physical activity on cardiovascular endurance (CE), and heart rate variability (HRV). Differences in exercise beliefs, physical activity, HRV, and CE in youth with type 1 versus type 2 DM were determined.
Methods
Adolescents with type 1 DM (n = 105) or with type 2 DM (n = 27) completed the Exercise Belief Instrument and the Physical Activity Recall. Twenty-four HRV measures were obtained via Holter monitoring and analyzed using SpaceLabs Vision Premier™ software system. The McMaster cycle test was used to measure CE (V02peak).
Results
Regardless of the type of DM, females and those with higher BMI, poorer metabolic control, and lower amounts of physical activity tended to have lower levels of CE. Exercise beliefs consistently predicted both frequency and time domain HRV measures. Measures of exercise beliefs, self-reported physical activity, CE (V02peak), and HRV were significantly lower in adolescents with type 2 DM in comparison to those with type 1 DM.
Conclusions and Recommendations
Early findings of poor physical fitness, lower HRV, fewer positive beliefs about exercise, and less active lifestyles highlight the importance of developing culturally sensitive interventions for assisting youth to make lifelong changes in their physical activity routines. Females, those with poorer metabolic control, and minority youth with type 2 DM may be particularly vulnerable to later cardiovascular disease.
Keywords: type 1 diabetes, type 2 diabetes, adolescents, cardiovascular endurance, heart rate variability, cardiovascular risks
Diabetes mellitus (DM) is a potentially devastating disease and currently ranks as the fifth leading cause of death in the United States, primarily via cardiovascular complications (American Diabetes Association, 2003; Centers for Disease Control and Prevention, 2003). Adults with DM of either type 1 or type 2 have a 2 to 4 times greater risk for heart disease than adults without DM (American Diabetes Association, 2001). The economic burden of diabetes in the United States is estimated to be $132 billion, which can be predominantly attributed to the direct costs of hospitalizations related to cardiovascular disease (Centers for Disease Control and Prevention, 2003). Recent research indicates that early onset of type 2 DM in young adults is associated with a 14-fold increase in the risk of myocardial infarction as compared to controls without type 2 DM (Hillier & Pedula, 2003), further supporting findings that these individuals have a reduced life expectancy (Narayan, Boyle, Thompson, Sorensen, & Williamson, 2003). Currently, incidence rates of both type 1 and type 2 DM in youth are increasing (Gale, 2002; Karvonen et al., 2000; Kaufman, 2002). Approximately 1 in 500 children and adolescents have type 1 DM. Although there is a lack of nationally representative data on type 2 DM in youth, regional studies indicate increasing cases in minorities, particularly African Americans, Hispanics, and American Indians (National Institute of Diabetes and Digestive and Kidney Diseases, 2004). Although morbidity and mortality data are not available for youth populations, mortality rates for adults with diabetes as the underlying cause are greater for African Americans (41.2/100,000) and Hispanics (27.8/100,000) than for Whites (18.4/100,000) (American Diabetes Association, 2001). The growing number of new cases of young persons being diagnosed with DM may eventually contribute to an enormous onslaught of premature heart disease in early adulthood.
In Standards of Medical Care, The American Diabetes Association (2004) recommends a regular physical activity program for all patients with diabetes, adapted for the presence of complications. Although most adolescents with diabetes have not yet developed overt complications of their disease, the societal trends toward a more sedentary lifestyle and predisposition for overweight places these teens at a potentially greater risk for long-term negative health outcomes. The limited research available on the efficacy of exercise interventions with youth who have type 1 DM indicates an improvement in cardiovascular endurance (CE) and glucose regulation (Marrero, Fremion, & Golden, 1988; Mosher, Nash, Perry, LaPerriere, & Goldberg, 1998). Despite the proliferation of investigations focusing on the prevention of type 2 DM in youth through diet and exercise, studies on the effects of exercise in youth already diagnosed with type 2 DM are nonexistent in the research literature. Gutin and colleagues (2002), however, reported beneficial effects of exercise on both the CE and heart rate variability (HRV) of obese youth.
It is well established that adults with type 2 DM have a lower level of CE when compared to healthy age-matched controls (Albright et al., 2000). In addition, DM predisposes individuals to cardiovascular dysautonomia (Faulkner, Hathaway, Milstead, & Burghen, 2001; Hathaway, Cashion, Wicks, Milstead, & Gaber, 1998; Makimattila et al., 2000). Cardiovascular autonomic neuropathy with impaired HRV leads to debilitating complications and is an independent marker of poor prognosis for persons with DM (Burger, Charlamb, Weinrauch, & D’Elia, 1997; Levitt, Stansberry, Wynchank, & Vinik, 1996; Liao, Carnethon, Evans, Cascio, & Heiss, 2002; Osterhues, Grossmann, Kochs, & Hombach, 1998; Task Force of the European Society of Cardiology and the North American Society of Pacing and Electrophysiology, 1996). An example of impaired HRV in persons with DM is cardiac denervation syndrome. This syndrome results in an initial loss of parasympathetic tone with a relative increase in sympathetic tone, tachycardia at rest, and risk for lethal arrhythmias, including sudden death, and contributes significantly to morbidity and mortality (Ewing, Campbell, & Clarke, 1981; Kahn, Sisson, & Vinik, 1988).
In contrast to adults with type 2 DM, little is known about CE in adolescents with either type 1 or type 2 DM. It has been found, however, that cardiovascular autonomic function may be impaired early in childhood DM, independent of the duration of the disease or degree of glycemic control (Karavanaki, Davies, Morgan, & Baum, 1997; Karavanaki-Karanassiou, 2001; Verrotti, Chiarelli, Blasetti, & Morgese, 1995; Ziegler et al., 1992). Studies using power spectral analysis for determining HRV reveal levels that are significantly lower in youth with type 1 DM who are not exhibiting clinical symptoms or overt complications of the disease as compared to similarly aged controls (Faulkner et al., 2001; Massin et al., 1999; Wawryk, Bates, & Couper, 1997).
In response to the relative dearth of studies exploring factors that may influence CE or HRV in youth diagnosed with either type 1 or type 2 DM, the cross-sectional investigation described here had three specific aims: (a) to explore the influence of type of diabetes, gender, body mass index (BMI), metabolic control (HbA1c), exercise beliefs, and physical activity on CE; (b) to explore the influence of type of diabetes, gender, BMI, HbA1c, exercise beliefs, and physical activity on HRV; and (c) to determine differences in exercise beliefs, physical activity, HRV, and CE in youth with type 1 versus those with type 2 DM.
The study described here is part of a larger descriptive investigation addressing cardiovascular risks in adolescents with both type 1 and type 2 DM funded by the National Institute of Nursing Research (Faulkner, Carley, Quinn, Rich, & Rimmer, 2000). The framework for the biobehavioral concepts incorporated into this program of research is depicted in the model shown in Figure 1. The model includes socio-demographic components and personal and behavioral factors that may contribute to the trajectory of cardiovascular disease in youth with DM. The variables of interest include gender, type of DM, the personal factors of exercise beliefs and BMI, the behavioral factor of physical activity, and the biological variables of HbA1c, CE, and HRV.
Figure 1.
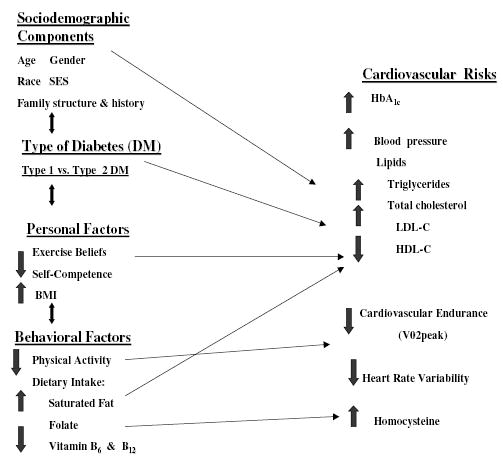
A model of cardiovascular risks in adolescents with diabetes.
Materials and Methods
Participants
Adolescents were eligible for inclusion in this study if they had been diagnosed with either type 1 or type 2 DM for at least 1 year, were 13 to 18 years of age, and were within 2 years of the appropriate grade in school for their age. The study focused on adolescents owing to the challenges of managing diabetes during this developmental stage when insulin resistance increases and therapeutic regimens often require careful adjustment to account for hormonal and lifestyle fluctuations. The exclusion of youth who were still in the initial year after diagnosis allowed for an adjustment period for establishing individual therapies for insulin and/or oral medication regimens. The criterion limiting inclusion to those within 2 years of the appropriate grade level in school was useful to exclude any participants who may have any overt delays in cognitive, psychological, or behavioral functioning.
Other exclusion criteria included having developed diabetes as a secondary condition to treatment for another chronic condition (e.g., cancer) or having a known cardiac defect. The sample was composed of adolescents who were receiving routine medical treatment in the outpatient clinic of a large metropolitan university-based childhood diabetes center located in the Midwest. The participants in this study were representative of the overall clinic population, which includes individuals with widely diverse socioeconomic statuses.
Data Collection and Instruments
Data were collected at the General Clinical Research Center (GCRC) of a major Midwestern medical center where the principal investigator is employed. Participant recruitment occurred at a large pediatric diabetes center of a different university located in the same metropolitan area where the GCRC is located. Recruitment was established at this diabetes center owing to the limited numbers of youth being treated for diabetes at the university affiliated with the GCRC. Data collection occurred between March 2001 and September 2004. Adolescents were all scheduled for exercise testing in the morning to minimize any potential circadian variation related to daily schedules that included school or work. Each adolescent spent approximately 3 hrs at the GCRC on the morning of data collection. The behavioral measures included the Exercise Belief Instrument for Adolescents (Loman & Galgani, 1996) and the Seven-Day Physical Activity Recall (PAR) (Sallis, Buono, Roby, Micale, & Nelson, 1993). The biological measures included a glycosylated hemoglobin (HbA1c) obtained at the GCRC on the day of data collection, exercise testing for CE using peak VO2, and 24-hr Holter monitoring for HRV indices.
Exercise Belief Instrument for Adolescents
The Exercise Belief Instrument for Adolescents (Loman & Galgani, 1996) was developed to measure exercise beliefs specifically in adolescents with diabetes. Following a review of the literature and discussions with adolescents with diabetes, Loman and Galgani developed a 16-item, 4-point Likert-type scale questionnaire. The possible range of scores is 16 to 64, with higher scores indicating more positive beliefs about exercise. Factors known to promote or discourage exercise were included, such as enjoyment of exercise, influence of family and peers, and time availability. Three diabetes nurse educators and 4 adolescents reviewed the questionnaire to establish content validity. Internal consistency of the 16 items was reported as a Cronbach’s alpha of .71, and the standardized item alpha was .74. The 2-week test-retest reliability for the total score of the instrument was .70 (p = .001). The sample used for the original psychometric evaluation of the instrument included 30 adolescents from 12 to 17 years of age; 87% of these were White and 13% were Black.
Seven-Day Physical Activity Recall
PAR (Sallis et al., 1993) is a 15- to 20-min interview devised to obtain information from the research participant regarding duration, frequency, and intensity of physical activity for the previous 7 days. PAR was developed for use in a study on community prevention of coronary heart disease. The instrument was designed to have a short recall period for increased accuracy, to be simple to administer, and to be useful with both males and females across a wide age spectrum. Participants are asked to describe all activities they undertook and the number of hours of sleep they got during the previous 7 days. Examples of light, moderate, hard, and very hard activities are provided so that participants can classify the types of physical activity in which they participated. Light activities are similar to walking at a slow pace, or strolling. Moderate activities are described as those feeling similar to a brisk walk. Additional examples of moderate activities include light bike riding and house chores. Very hard activities include running, basketball, and football. Hard activities fall between moderate and very hard and include activities like swimming and dancing.
Scores on the PAR are reported as average daily METS (metabolic equivalents). METS are multiples of resting metabolic rate. Resting metabolic rate equals approximately 1 kilocalorie per kilogram of weight per hour (kcal/kg/hr). For example, activities requiring 3.0 METS would expend 3 kcal/kg/hr. The level of activity is calculated based on average values for each category of intensity as follows: sleep (1.0 METS), light (1.5 METS), moderate (4.0 METS), hard (6.0 METS), and very hard (10 METS). Each METS value is multiplied by the amount of time the activity (including sleep) occurred to come up with a grand total for the week. The weekly total is divided by 7 to obtain the average daily METS score, which reflects daily energy expenditure. Thus, the total energy expenditure per day is derived from the intensity level of activities in combination with the frequency and duration of those activities (Blair, 1984).
Established validity in relation to direct observation and test-retest reliability for use of the PAR with children and adolescents has been demonstrated (Sallis et al., 1993; Wallace, McKenzie, & Nader, 1985). In a sample of 102 elementary, middle, and high school youth of diverse ethnic backgrounds (69% were non-Hispanic White, 11% were Asian, 10% were Latino, 8% were African American, and the remainder were from other ethnic groups), test-retest reliability was r = .77. Overall concurrent validity of the PAR with heart-rate monitoring (i.e., association of recalled very hard activity with intervals of heart rate ≥160) was indicated by an r value of .53 (p < .001). For the subgroup of 11th grade students (n = 30), the validity improved, with an r value of .72 (p < .001) (Sallis et al., 1993). Although the correlation for the adolescent group was > .70, there is a recognized limitation on the accuracy of self-reported physical activity data.
Glycosylated Hemoglobin
HbAlc is a standard measure of glycemic control over the previous 90 days. For the current study, it was determined by using the Abbott IMx® assay method for quantitative measurement of whole blood (Abbott Park, IL). Since 1996, the National Glycohemoglobin Standardization Program (NGSP) has certified laboratories to report Diabetes Control and Complications Trial traceable assay results with between-laboratory coefficients of variation of less than 5%. The NGSP certification allows for valid and reliable comparisons of HbA1c values across laboratories and investigations (Little et al., 2001).
Cardiovascular Endurance
According to the American College of Sports Medicine (2000), the criterion measure of CE or fitness is the direct measure of maximal oxygen uptake, or VO2max. The measurement of VO2max involves the analysis of expired air samples that are collected while the participant performs exercise of progressive intensity. VO2max values are typically expressed relative to body weight (i.e., ml·kg−1·min−1). Termination of exercise due to fatigue is the subjective indicator for maximal exertion during testing. Because youth often fail to meet the objective criteria for V02max commonly used with adults (American College of Sports Medicine, 2000; McMurray, Harrell, Bradley, Deng, & Bangdiwala, 2002), including reaching an oxygen plateau, a respiratory exchange ratio (RER) > 1.0, and heart rate > 200 beats/min (Gutin et al., 2002), V02peak was used rather than V02max, in this study. V02peak was determined by achieving an RER > 1.0.
The American College of Cardiology and the American Heart Association taskforce on practice guidelines for exercise testing in children and adolescents indicates that applications of testing in youth are commonly related to the evaluation of exercise capacity (Gibbons et al., 1997). Children and adolescents who experience sedentary lifestyles often have diminished physical work capacity, leading to even more inactivity and possibly resultant social and psychological limitations (Tomassoni, 1996). Such lack of physical activity predisposes children and adolescents for the early development of cardiovascular disease and negatively affects their quality of life (Tomassoni, 1996).
Exercise testing using cycle ergometer or treadmill procedures for the measurement of V02peak have been used successfully in healthy children and adolescents and with diverse groups, including those with asymptomatic Ebstein’s anomaly and those with mild to moderate mental retardation and following renal transplantation (Bishop, Jenkins, & Mackinnon, 1998; Fernhall et al., 1998; Giordano et al., 1998; Lupoglazoff et al., 1999; McMurray, Guion, Ainsworth, & Harrell, 1998). Reliability of exercise testing using the cycle ergometer has been established with 8 females (mean age 19.6 ± 2.5 years) by repeating the testing three times over a period of 2 weeks with all tests separated by at least 48 hrs (Bishop et al., 1998). The tests were performed at the same time of day in a controlled environment, with no significant differences in CE reported.
The SensorMedics® VMAX29 cardiopulmonary metabolic cart and cycle ergometer (SensorMedics, Yorba Linda, CA) were used for exercise testing in this investigation. Each participant performed the McMaster cycle test (American College of Sports Medicine, 2000) to measure V02peak. The McMaster cycle test is a recommended protocol for youth because it is based on the height of the adolescent and uses a gender-specific workload, with a total optimal exercise time of 8 to 12 min.
Heart Rate Variability
HRV over 24 hrs was measured using the 3-channel SpaceLabs Burdick model 92510 digital Holter recorder (Deerfield, WI). The electrocardiographic (ECG) recordings were digitized at 500 samples per second. Power spectral analysis of HRV offers a highly sensitive source of data related to autonomic function. This technique quantifies and discriminates between sympathetic and parasympathetic autonomic function over a 24-hr period by recording the frequency of R-R variation. Abnormalities detected by power spectral analysis are more sensitive indicators of autonomic dysfunction than conventional tests, such as the change in heart rate with deep breathing and Valsalva ratio (ratio of the longest R-R interval during the post-Valsalva reflex bradycardia divided by the shortest R-R during the maneuver). Power spectral analysis detects autonomic dysfunction particularly in patients with diabetes who have diminished 24-hr R-R interval variability (Ewing, Neilson, & Travis, 1984).
Analysis of HRV is classified into frequency and time domain analyses. The SpaceLabs Vision Premier™ ECG Analysis and Editing software system utilizes the fast Fourier method of power spectral analysis to calculate the frequency domain. Fast Fourier transformations provide a mathematical representation of the spectrum of frequency, also called Hertz (Hz), or power. Frequency domain analysis provides estimates of the spectrum density of R-R intervals within specific frequency bandwidths (Cowan, 1995). Frequency domain measures of total Hertz (0.01–1.00 Hz), low Hertz (0.04–0.15), and high Hertz (0.15–0.40) are converted to log transformations by the computer software to correct for skewness. Total Hertz is the entire area under the curve in a power spectrum plot and represents the variance of all R-R intervals in the entire Holter recording (Schumacher, 2004; Task Force of the European Society of Cardiology and the North American Society of Pacing and Electrophysiology, 1996). Normally, low-frequency activity (primarily sympathetic with some parasympathetic innervation) predominates during waking hours and high-frequency activity (parasympathetic innervation) predominates during sleep (Low, 1997).
Time domain analysis uses differing computations of the standard deviation of the beat-to-beat change in heart rate based on sinus R-R intervals over time (Cowan, 1995). The time domain analysis of HRV can be further divided into 2 categories. The first is derived from the R-R intervals, using means and standard deviations of the intervals measured in milliseconds. Measures in this category include the SDNN, SDANN, and SD. The standard deviation of all R-R intervals during a 24-hr period is the SDNN. Values for SDNN that are less than 50 milliseconds have been associated with sudden cardiac death (Kleiger, Miller, Bigger, & Moss, 1987). The standard deviation of the means of R-R intervals found in successive 5-min time periods over 24 hrs is the SDANN. The calculation for SDANN makes it the most resistant HRV measure for QRS labeling errors and the best measure for circadian fluctuation in heart rate (Cowan, 1995). The mean of the standard deviations of the R-R intervals of each 5-min segment is the SD and is sensitive to fluctuation within the 5-min segment. The second category of time domain variables is derived from differences between adjacent R-R intervals and includes indices that are independent of circadian rhythms. Measures in this category are the pNN50 and the rMSSD. The proportion of the total R-R intervals that have differences of successive R-R intervals greater than 50 milliseconds represents pNN50. The square root of the mean squared differences of successive R-R intervals is the rMSSD. Reflecting alterations in autonomic function that are primarily vagally mediated, the pNN50 and rMSSD correlate highly with high-frequency power, reflecting parasympathetic modulation (Cowan, 1995).
In the current study, each QRS complex was identified and labeled. The analyzed data file was scanned and manually edited to locate and correct possible errors in QRS labeling that would negatively affect measurement of HRV. The software program allows for relabeling of QRS complexes that may occasionally be incorrectly identified as ectopy or artifact. For each data file, only R-R intervals derived from normal sinus rhythm were used to calculate HRV with power spectral analysis.
Time and frequency domain analyses of 24-hr HRV by ambulatory Holter monitoring have been used in previous studies to establish age-related indices in healthy children and adolescents (3 to 15 years of age) and to accurately assess cardiac autonomic function and subclinical autonomic neuropathy in adolescents with diabetes (Akinci, Celiker, Baykal, & Tezic, 1993; Faulkner, Hathaway, & Tolley, 2003; Goto et al., 1997; Rollins et al., 1992). Quality assurance data provided by SpaceLabs Burdick demonstrated that calculations and statistics of the HRV software had been verified using laboratory measures of predictable test signals. Kleiger and others (1991) established the stability of both time and frequency domain HRV measures using 24-hr Holter monitoring, reporting correlation coefficients > .80.
Procedures
Human subjects protection procedures were reviewed and approved by the institutional review boards at both the university hospital where recruitment took place and the university hospital that housed the GCRC where data were collected. Written parental permissions and youth assents were obtained for all adolescents less than 18 years of age. Teens who had reached their 18th birthday provided their own written consents. Participants were scheduled for exercise testing on a day of their choosing. All tests were performed in the morning and completed in a temperature-controlled environment. Although the American College of Sports Medicine (2000) does not state that the presence of a physician or physician backup is required for conducting exercise testing of youth who have a low risk of cardiovascular complications, studies conducted at NIH-funded GCRCs must have a data safety and monitoring plan. Therefore, a physician was available via pager during all scheduled tests. Additionally, blood glucose measurement by fingerstick using an Accu-Chek™ Advantage monitor (Roche, Indianapolis, IN) was performed immediately prior to exercise testing. No episodes of hypoglycemia (blood glucose < 90 mg/dl) were detected. In accordance with current recommendations of the American Diabetes Association (2004), if blood glucose levels were above 250 mg/dl, participants were rescheduled to have all data collected on another day. Rescheduling was only needed on 2 occasions.
Following the completion of the Exercise Belief Instrument for Adolescents and a routine venipuncture to obtain HbA1c, the exercise physiologist reviewed the McMaster protocol with each participant so she or he would know what to expect during testing. Calibration of equipment occurred prior to testing. Each participant inserted a clean mouthpiece, which was held in place by a head support adjusted to fit each individual. The participant also wore a nose clip to ensure that both inhalation and exhalation occurred only through the mouthpiece. Prior to the participant sitting on the seat of the cycle ergometer, the seat height, handlebar height, and pedal crank position were modified appropriately.
Based on the American College of Sports Medicine’s Guidelines for Exercise Testing and Prescription, 6th ed. (American College of Sports Medicine, 2000), exercise testing continued to a maximum level of exertion unless the participant experienced dyspnea, dizziness, a decline in systolic blood pressure, arrhythmias, lightheadedness, nausea, cyanosis, excessive rise in systolic blood pressure to over 200 mm Hg, or diastolic to over 120 mm Hg. The exercise session was terminated when the participant requested it due to fatigue. The average time to exhaustion for participants in this study was 9.4 ± 1.9 (SD) min.
Baseline blood pressure and pulse rate were taken prior to exercise testing. Heart rate was monitored continuously during the exercise test by the metabolic cart via a 12-lead electrocardiogram. Blood pressure was taken at 2-min intervals during the test. Following the participant’s request to terminate the testing, workload was gradually decreased and the participant was allowed to recover for at least 5 min by pedaling with no resistance. Heart rate and blood pressure were also monitored during the recovery phase.
Upon completion of the exercise test and following a rest period of approximately 30 min, each participant had SpaceLabs Burdick 24-hr ambulatory Holter recorder applied for recording a modified Lead II tracing. Seven cardiogram patches were attached to the electrodes at the following locations: (a & b) below the left and right clavicles, just lateral to the midclavicular line, (c) at the 4th rib to the left of the sternal border, (d) 5th rib at the left anterior axillary line, (e) at the manu-brium sterni, (f) at the 6th rib on the left midclavicular line, and (g) on the lower right 6th chest wall rib. During the rest period following exercise testing, participants were interviewed using the PAR (Sallis et al., 1993).
Sample
No previous studies exploring predictors of HRV or CE in adolescents were found in the existing literature that could serve as a basis for estimating sample size. Thus, a sample size of 100 was determined using Number Cruncher Statistical Software© (NCSS, Kaysville, UT) to detect at least five significant independent variables as predictors of approximately 20% of the variance in HRV or CE at an alpha of .05 and power of .98. The total sample included 132 adolescents with diabetes. Table 1 provides detailed demographic information for study participants. Adolescents who had type 1 DM (n = 105) were similar in age and in level of glycemic control (HbA1c) to those with type 2 DM (n = 27). Physical examination during routine clinic appointments with the adolescents’ regular health care providers determined Tanner stages of sexual maturation, which were not significantly different between the two groups. However, BMI was considerably higher and duration of diabetes was less for those with type 2 versus type 1 DM.
Table 1.
Demographic, Personal, and Behavioral Factors of Adolescents With Diabetes Mellitus (DM; N = 132)
|
Group |
||
|---|---|---|
| Factor | Type 1 DM | Type 2 DM |
| n | 105 | 27 |
| Age | 15.3 ± 1.9 years | 16.0 ± 1.8 years |
| Tanner stage (mean) | 4 | 4 |
| Gender (n) | ||
| Male | 57 | 10 |
| Female | 48 | 17 |
| Race (n) | ||
| White | 70 | 0 |
| Black | 29 | 22 |
| Hispanic | 5 | 5 |
| Asian | 1 | 0 |
| Duration of DM*** | 6.3 ± 3.7 years | 2.7 ± 2.2 years |
| BMI (kg/m2)*** | 23.4 ± 4.0 | 34.8 ± 9.7 |
| HbA1c (%) | 8.7 ± 1.6 | 8.6 ± 2.4 |
| PAR** (METS/day) | 34.7 ± 3.1 | 33.5 ± 1.4 |
| Exercise Beliefs* | 47.1 ± 5.0 | 44.6 ± 5.8 |
NOTE: Values are mean ± SD unless otherwise noted; BMI = body mass index; HbAlc = glycosylated hemoglobin ; PAR = Seven-Day Physical Activity Recall (Sallis, Buono, Roby, Micale, & Nelson, 1993); METS = metabolic equivalents; Exercise Beliefs = Exercise Belief Instrument for Adolescents (Loman & Galgani, 1996).
p < .05.
p < .01.
p < .0001.
Data Analysis
Aims 1 and 2 were both analyzed using stepwise regression procedures in the SPSS statistical program© (Version 12.0, SPSS, Inc., Chicago, IL). Following the evaluation of multicollinearity diagnostic procedures, which revealed an r value of .64 (p < .001) for the correlation between type of DM and BMI, three separate regression models were run for each of the dependent variables representing HRV (i.e., total Hz, low Hz, high Hz, SDNN, SDANN, SD, pNN50, rMSSD) and CE (VO2peak). These three models were selected to determine which one predicted the greatest variance in each of the dependent variables, HRV and CE. Additionally, the use of three separate models allowed for determining whether type of DM or BMI had more predictive influence on HRV or CE. Model 1 included the independent variables of type of DM, BMI, gender, metabolic control, physical activity, and exercise beliefs. Model 2 included all of the independent variables in Model 1, excluding type of DM. Model 3 included all of the independent variables in Model 1, excluding BMI. Aim 3 was analyzed using Student’s independent t tests to detect differences in the mean scores reflecting exercise beliefs, METS, frequency and time domain measures of HRV, and VO2peak.
Results
Aim 1 was to explore the influence of type of diabetes, gender, BMI, metabolic control (HbA1c), exercise beliefs (Exercise Belief Instrument for Adolescents), and physical activity (PAR) on CE (VO2peak). Gender, BMI, metabolic control, and physical activity predicted 55% of the variance in CE (Table 2). The largest contributor to CE was gender, accounting for 27% of the variance in CE. Neither type of DM nor exercise beliefs significantly predicted CE. Therefore, females and those with higher BMI, poorer metabolic control, and lower amounts of physical activity tended to have lower levels of CE.
Table 2.
Predictors for VO2Peak
| Beta | t | p** | R2Change | R2 | |
|---|---|---|---|---|---|
| Gender | −.425 | −6.776 | .000 | .272 | .272 |
| BMI | −.475 | −7.556 | .000 | .208 | .480 |
| HbA1c | −.225 | −3.580 | .000 | .055 | .536 |
| PAR | .172 | 2.720 | .008 | .027 | .563 |
NOTE: BMI = body mass index; HbAlc = glycosylated hemoglobin; PAR = Seven-Day Physical Activity Recall (Sallis, Buono, Roby, Micale, & Nelson, 1993); Adjusted R2 = .548.
p < .01.
Aim 2 was to explore the influence of type of diabetes, gender, BMI, metabolic control (HbA1c), exercise beliefs, and physical activity on HRV. Results of the stepwise regression analyses revealed that approximately 12% to 30% of the variance in the various measures of time and frequency domains of HRV could be explained by select independent variables. In contrast to the finding that BMI predicted CE noted above for Aim 1, BMI did not remain as a significant predictor for any of the remaining models for HRV. For the frequency domain measures of HRV, having type 2 DM predicted lower HRV. Exercise beliefs consistently predicted both frequency and time domain HRV measures, even though the contribution to the variance in these measures was only 3% to 9%. Results for the models with the greatest predictive value for HRV are presented in Table 3.
Table 3.
Predictors for Heart Rate Variability (HRV)
| Beta | t | P | R2Change | R2 | Adj.R2 | |
|---|---|---|---|---|---|---|
| Frequency domains | ||||||
| Total frequency (Hz) | ||||||
| Gender | −.234 | −2.849 | .005 | .116 | .116 | |
| Exercise beliefs | .238 | 2.903 | .004 | .076 | .192 | |
| DM type | −.206 | −2.528 | .013 | .035 | .227 | |
| HbA1c | −.199 | −2.470 | .015 | .038 | .265 | .24 |
| Low frequency (Hz) | ||||||
| PAR | .212 | 2.634 | .010 | .125 | .125 | |
| Exercise beliefs | .210 | 2.638 | .009 | .076 | .201 | |
| Gender | −.195 | −2.413 | .017 | .054 | .255 | |
| DM type | −.209 | −2.641 | .009 | .035 | .290 | |
| HbA1c | −.191 | −2.473 | .015 | .036 | .326 | .30 |
| High frequency (Hz) | ||||||
| Exercise beliefs | .256 | 2.977 | .004 | .091 | .091 | |
| DM type | −.243 | −2.822 | .006 | .057 | .148 | .133 |
| Time domain | ||||||
| SDNN | ||||||
| Gender | −.306 | −3.790 | .0001 | .169 | .169 | |
| PAR | .271 | 3.338 | .001 | .087 | .256 | |
| Exercise beliefs | .199 | 2.490 | .014 | .037 | .293 | .275 |
| SDANN | ||||||
| Gender | −.289 | −3.401 | .001 | .139 | .139 | |
| PAR | .212 | 2.485 | .014 | .054 | .193 | |
| Exercise beliefs | .166 | 1.982 | .050 | .026 | .219 | .199 |
| SD | ||||||
| PAR | .252 | 3.007 | .003 | .128 | .128 | |
| Gender | −.249 | −2.983 | .003 | .073 | .202 | |
| Exercise beliefs | .216 | 2.612 | .010 | .044 | .245 | .226 |
| pNN50 | ||||||
| PAR | .209 | 2.361 | .020 | .085 | .085 | |
| Exercise beliefs | .186 | 2.138 | .035 | .043 | .128 | |
| Gender | −.180 | −2.041 | .043 | .030 | .158 | .137 |
| rMSSD | ||||||
| Exercise beliefs | .233 | 2.664 | .009 | .078 | .078 | |
| PAR | .231 | 2.644 | .009 | .051 | .130 | .115 |
NOTE: Hz = Hertz; PAR = Seven-Day Physical Activity Recall (Sallis, Buono, Roby, Micale, & Nelson, 1993); Exercise Beliefs = Exercise Belief Instrument for Adolescents (Loman & Galgani, 1996); DM = diabetes mellitus; HbAlc = glycosylated hemoglobin; SDNN = standard deviation of all R-R intervals; SDANN = standard deviation of all the means of R-R intervals for each 5-minute block; SD = mean of the standard deviation of the R-R intervals of each 5-min block; pNN50 = % of adjacent R-R intervals with ≥50 ms difference; rMSSD = square root of the mean of the sum of squares of differences between adjacent R-R intervals.
Aim 3 was to determine differences in exercise beliefs, physical activity, HRV, and CE in youth with type 1 versus type 2 DM. Measures of exercise beliefs, self-reported physical activity, CE (V02peak), and HRV were significantly lower in adolescents with type 2 DM in comparison to those with type 1 DM. One time domain measure of HRV, the rMSSD, was not significantly lower in youth with type 2 DM (p = .07). The means and standard deviations for exercise beliefs and self-reported physical activity are reported in Table 1. The means and standard deviations for the HRV measures and V02peak can be found in Table 4.
Table 4.
Cardiovascular Endurance (VO2peak) and Heart Rate Variability in Adolescents With Type 1 Versus Those With Type 2 Diabetes Mellitus (DM)
| Type 1 DM | Type 2 DM | |
|---|---|---|
| VO2peak*** | 34.4 ± 8.8 | 25.4 ± 5.9 |
| HRV | ||
| TotHza** | 8.3 ± 0.7 | 7.8 ± 0.8 |
| LowHza** | 7.1 ± 0.7 | 6.5 ± 0.8 |
| HiHza** | 6.7 ± 1.0 | 5.9 ± 1.1 |
| SDNN** | 153 ± 39 | 125 ± 45 |
| SDANN** | 128 ± 35 | 106 ± 41 |
| SD** | 77 ± 25 | 61 ± 24 |
| pNN50* | 20 ± 13 | 14 ± 13 |
| rMSSD | 59 ± 28 | 47 ± 29 |
NOTE: Values are mean ± SD. Hz = hertz; SDNN = standard deviation of all R-R intervals; SDANN = standard deviation of all the means of R-R intervals of each 5-min block; SD = mean of the standard deviation of the R-R intervals of each 5-min block; pNN50 = % of adjacent R-R intervals with ≥50 ms difference; rMSSD = square root of the mean of the sum of squares of differences between adjacent R-R intervals.
Natural log (ms2).
p ≤.05.
p < .01.
p < .0001.
Discussion
Although type 2 DM is increasing in children and adolescents, type 1 DM remains the most prevalent type of diabetes in youth. The sample of adolescents with DM in this study represents the approximate proportion of youth with type 1 DM and type 2 DM seen in the clinic where recruitment took place. Nevertheless, the small proportion of youth with type 2 DM was a potential limitation for the analysis of study data. The ethnic composition of the study sample, in which predominantly White youth had type 1 DM and predominantly minority youth (e.g., Black and Hispanic) had type 2 DM, reflects available epidemiological data (Rosenbloom, Joe, Young, & Winter, 1999). The elevated BMI noted in the minority adolescents with type 2 DM in this study is consistent with the finding of increasing average weight of youth noted in large population studies, such as the National Health and Nutrition Examination Survey IV (Ogden, Flegal, Carroll, & Johnson, 2002). The level of glycemic control for both those with type 1 and type 2 DM in this sample is lower than the 7% glycosylated hemoglobin recommended by the American Diabetes Association (2004) to prevent future cardiovascular disease but is a level frequently seen in adolescents, who tend to exhibit more labile glucose levels (Faulkner et al., 2001; Massin et al., 1999; Wawryk et al., 1997).
The findings of this investigation revealed that the variables of gender, BMI, metabolic control, and physical activity were stronger predictors of CE, regardless of type of DM, than any of the independent variables influencing HRV. The major influence of gender and BMI on physical fitness is a consistent association noted in studies of physical energy capacity, with females exhibiting at least 20% lower capacity than males even when the VO2peak values are expressed as ml·kg−1·min−1 (McArdle, Katch, & Katch, 2001; McMurray et al., 2002). Studies of physical activity behaviors in general youth populations report decreasing levels of CE in females versus males as they age into later adolescence (Garcia et al., 1995; Myers, Strikmiller, Webber, & Berenson, 1996; Pate, Heath, Dowda, & Trost, 1996). Although no studies in youth report metabolic control of glucose level as a predictor of CE, better glycemic control has been a positive outcome of the limited intervention research that has promoted physical activity in youth with type 1 DM (Marrero et al., 1988; Mosher et al., 1998).
In comparison, a smaller amount of variance in both time and frequency domains of HRV was estimated by the models in this study. The difficulties in identifying the most influential variables for determining HRV may be attributed to the lack of stationarity in HRV signals, which are also affected by circadian patterns, temperature, and hormones (Task Force of the European Society of Cardiology and the North American Society of Pacing and Electrophysiology, 1996). Gender was a significant predictor for six out of eight HRV variables (total Hz, low Hz, SDNN, SDANN, SD, pNN50), a finding that is consistent with previous research of HRV in healthy adolescents (Faulkner et al., 2003). The results of previous studies of HRV in youth with DM regarding gender have varied widely, finding a trend toward lower values for HRV in females than males (Faulkner et al., 2001), lower values for females only in early puberty (i.e., 11–13 years) (Massin et al., 1999), or no gender difference at all (Wawryk et al., 1997).
Although exercise beliefs predicted less than 9% of the variance for HRV, this variable consistently influenced all of the individual HRV measures. For HRV measures that are known to reflect parasympathetic function (i.e., high frequency, pNN50, and rMSSD), some differences in the amount of influence of the predictor variables occurred. Exercise beliefs remained in all of the models, but DM type, PAR, and gender were included in only one or two of the models. These differences may be explained by the small amount of variance accounted for by each of the models and the lack of variability in the independent variables for high frequency, pNN50, or rMSSD. Self-reported physical activity (PAR) contributed to less than 13% of the variance in HRV. However, PAR influenced six out of eight HRV measures (low Hz, SDNN, SDANN, SD, pNN50, rMSSD), with higher levels of HRV noted in those reporting more physical activity. This finding is consistent with that of the study by Gutin, Barbeau, Litaker, Ferguson, and Owens (2000) in which aerobic interventions with obese youth improved HRV, particularly measures of parasympathetic function.
The interesting finding in the final model that DM type rather than BMI is a predictor of HRV indicates the possibility that cardiovascular autonomic changes may in fact present earlier in those with type 2 versus type 1 DM (Vinik, Freeman, & Erbas, 2003). The clinical significance of lower HRV is of its association with diabetic autonomic neuropathy (DAN), a condition that predisposes individuals with DM to lethal arrhythmias and sudden cardiac death in adulthood. Typically, there is reduced power in all spectral bands, including total power, for persons with DAN (Task Force of the European Society of Cardiology and the North American Society of Pacing and Electrophysiology, 1996). Both the age of the individual and the duration of diabetes at which the trajectory for lower HRV begins in persons with DM are relatively unknown.
Although having type 2 DM exerted a stronger influence on HRV than BMI in this study, race or gender variation might actually explain the influence of type 2 DM on HRV. In healthy adolescents, Faulkner and others (2003) found that HRV was lower in females and Black youths than in their male or White counterparts. Because the healthy Black youth in that study were predominantly females who tended to have lower HRV, the differences detected may have been more attributable to gender than race. The sample of adolescents in the current study was 81% Black and 62% female in the type 2 DM group versus 28% Black and 46% female in the type 1 group. Due to the lack of representation of White adolescents in the type 2 DM group, race was not explored as a predictor of HRV. It is noteworthy that the predominance of Black females in the group with type 2 DM is reflective of national prevalence rates for diabetes (American Diabetes Association, 2001).
Earlier research found a negative association between BMI and HRV in adolescents with type 1 DM (Faulkner et al., 2001), and obesity has been suggested as a link to depressed sympathetic and parasympathetic neural modulation (Spallone & Menzinger, 1997). However, more recent findings indicate that obesity is not a confounding factor in autonomic function testing in individuals with diabetes (Maser, 2002). One major limitation on the interpretation of these study findings is related to the varied methods for determining cardiovascular autonomic functioning in individuals with diabetes. Some investigators use 24-hr HRV, and others incorporate short-term evoked measures of changes in heart rate in response to deep breathing or Valsalva ratio.
The most salient findings of this study may have been the significantly lower levels of CE and HRV in adolescents with type 2 versus type 1 DM. These lower levels of HRV in those with type 2 DM were also below the lower 95% confidence level found in healthy teens (Faulkner et al., 2003). Once again, the possible confounding effects of gender and race warrant cautious interpretation of the findings. The relative values for CE (ml·kg−1·min−1) for those with type 1 or type 2 DM fell far below averages for either males (52 ml·kg−1·min−1) or females (40 ml·kg−1·min−1) at age 16 (McArdle et al., 2001). Additionally, the differences between the 2 groups in exercise beliefs and self-reported physical activity further emphasized possible differences in the behavioral practices and views concerning the importance of leading an active lifestyle as part of diabetes management between adolescents with the two types of DM.
Conclusions
This investigation is a first step toward gaining a more complete understanding of the personal and behavioral factors that affect physical fitness and cardiovascular autonomic function in adolescents with DM, who have an increased risk for cardiovascular disease in adulthood. Although gender was shown to play a major role in both CE and HRV, a finding consistent with previous investigations, interventions that can decrease BMI and improve metabolic control and physical activity are needed to enhance physical fitness in youth, regardless of type of DM. Intervention strategies that can promote the incorporation of positive beliefs about the benefits of exercise and motivate youth to engage in more active lifestyles are necessary to minimize early cardiovascular autonomic changes.
The complexity of pediatric diabetes presents unique concerns to practitioners, who are delivering care to young patients who may be dissimilar in the characteristics of their disease. Increasing numbers of teens with diabetes have concomitant elevated BMI and come from minority groups. The ravages of DM complications, such as higher rates of hypertension and myocardial infarction, are well documented for minority populations and contribute to the health disparities associated with these populations (American Diabetes Association, 2001). Early findings of poor physical fitness, lower HRV, fewer positive beliefs about exercise, and less active lifestyles are warning signs regarding the importance of developing culturally sensitive interventions that encourage these youth to make lifelong changes in their physical activity routines. Determining effective strategies for engaging individual teens in routine exercise behaviors that are congruent with their interests and linked to their family and community resources is a logical next step toward contributing to evidence-based practice in pediatric diabetes.
Footnotes
Funded by the National Institute of Nursing Research, R01 NR07719. Supported by University of Illinois at Chicago General Clinical Research Center, NIH M01-RR-13987. The authors wish to recognize the contributions of Cynthia Fritschi, MS, RN, CDE, project director, for R01 NR07719, and Don Smith, MS, exercise physiologist.
References
- Akinci A, Celiker A, Baykal E, Tezic T. Heart rate variability in diabetic children: Sensitivity of the time- and frequency-domain methods. Pediatric Cardiology, . 1993;14:140–146. doi: 10.1007/BF00795641. [DOI] [PubMed] [Google Scholar]
- Albright A, Franz M, Hornsby G, Kriska A, Marrero D, Ullrich I, et al. American College of Sports Medicine position stand. Exercise and type 2 diabetes. Medicine & Science in Sports & Exercise. 2000;32(7):1345–1360. doi: 10.1097/00005768-200007000-00024. [DOI] [PubMed] [Google Scholar]
- American College of Sports Medicine. (2000). ACSM’s guidelines for exercise testing and prescription (6th ed.). Philadelphia: Lippincott, Williams & Wilkins.
- American Diabetes Association. (2001). Diabetes 2001: Vital statistics Alexandria, VA: Author.
- American Diabetes Association. Economic costs of diabetes in the US in 2002. Diabetes Care. 2003;26(3):917–932. doi: 10.2337/diacare.26.3.917. [DOI] [PubMed] [Google Scholar]
- American Diabetes Association. Standards of medical care in diabetes. Diabetes Care. 2004;27(Suppl 1):S15–S35. doi: 10.2337/diacare.27.2007.s15. [DOI] [PubMed] [Google Scholar]
- Bishop D, Jenkins DG, Mackinnon LT. The effect of stage duration on the calculation of peak VO2 during cycle ergometry. Scandinavian Journal of Medicine and Science in Sports. 1998;1(3):171–178. doi: 10.1016/s1440-2440(98)80012-1. [DOI] [PubMed] [Google Scholar]
- Blair, S. N. (1984). How to assess exercise habits and physical fitness. In S.M.W.J.D. Matarazzo, J. S. Herd, & N. E. Miller (Eds.), Behavioral health: A handbook of health enhancement and disease prevention (pp. 424–447). New York: John Wiley.
- Burger AJ, Charlamb M, Weinrauch LA, D’Elia JA. Short- and long-term reproducibility of heart rate variability in patients with long-standing type I diabetes mellitus. American Journal of Cardiology. 1997;80(9):1198–1202. doi: 10.1016/s0002-9149(97)00639-5. [DOI] [PubMed] [Google Scholar]
- Centers for Disease Control and Prevention. (2003). National diabetes fact sheet: General information and national estimate on diabetes in the United State Atlanta, GA: U.S. Department of Health and Human Services, Centers for Disease Control and Prevention. Retrieved December 4, 2003, from http://www.cdc.gov/diabetes/pubs/factsheet.htm
- Cowan MJ. Measurement of heart rate variability. Western Journal of Nursing Research. 1995;17(1):32–48. doi: 10.1177/019394599501700104. discussion 101–111. [DOI] [PubMed] [Google Scholar]
- Ewing DJ, Campbell IW, Clarke BF. Heart rate changes in diabetes mellitus. Lancet. 1981;1(8213):183–186. doi: 10.1016/s0140-6736(81)90061-1. [DOI] [PubMed] [Google Scholar]
- Ewing DJ, Neilson JM, Travis P. New method for assessing cardiac parasympathetic activity using 24 hour electrocardiograms. British Heart Journal. 1984;52(4):396–402. doi: 10.1136/hrt.52.4.396. [DOI] [PMC free article] [PubMed] [Google Scholar]
- Faulkner, M. S., Carley, D., Quinn, L., Rich, B. H., & Rimmer, J. H. (2000). Cardiovascular risks in adolescents with diabetes R01 funded by the National Institute of Nursing Research, NIH, PHS, NR07719.
- Faulkner MS, Hathaway DK, Milstead EJ, Burghen GA. Heart rate variability in adolescents and adults with type 1 diabetes. Nursing Research. 2001;50(2):95–104. doi: 10.1097/00006199-200103000-00005. [DOI] [PubMed] [Google Scholar]
- Faulkner MS, Hathaway D, Tolley B. Cardiovascular autonomic function in healthy adolescents. Heart & Lung. 2003;32(1):10–22. doi: 10.1067/mhl.2003.6. [DOI] [PubMed] [Google Scholar]
- Fernhall B, Pitetti KH, Vukovich MD, Stubbs N, Hensen T, Winnick JP, et al. Validation of cardiovascular fitness field tests in children with mental retardation. American Journal of Mental Retardation. 1998;102(6):602–612. doi: 10.1352/0895-8017(1998)102<0602:vocfft>2.0.co;2. [DOI] [PubMed] [Google Scholar]
- Gale EA. The rise of childhood type 1 diabetes in the 20th century. Diabetes. 2002;51(12):3353–3361. doi: 10.2337/diabetes.51.12.3353. [DOI] [PubMed] [Google Scholar]
- Garcia AW, Broda MA, Frenn M, Coviak C, Pender NJ, Ronis DL. Gender and developmental differences in exercise beliefs among youth and prediction of their exercise behavior. Journal of School Health. 1995;65(6):213–219. doi: 10.1111/j.1746-1561.1995.tb03365.x. [published erratum appears in Journal of School Health 1995 Oct; 65(8):311] [DOI] [PubMed] [Google Scholar]
- Gibbons RJ, Balady GJ, Beasley JW, Bricker JT, Duvernoy WF, Froelicher VF, et al. ACC/AHA guidelines for exercise testing: Executive summary. A report of the American College of Cardiology/American Heart Association Task Force on Practice Guidelines (Committee on Exercise Testing) Circulation. 1997;96(1):345–354. doi: 10.1161/01.cir.96.1.345. [DOI] [PubMed] [Google Scholar]
- Giordano U, Calzolari A, Matteucci MC, Pastore E, Turchetta A, Rizzoni G. Exercise tolerance and blood pressure response to exercise testing in children and adolescents after renal transplantation. Pediatric Cardiology. 1998;19(6):471–473. doi: 10.1007/s002469900360. [DOI] [PubMed] [Google Scholar]
- Goto M, Nagashima M, Baba R, Nagano Y, Yokota M, Nishibata K, et al. Analysis of heart rate variability demonstrates effects of development on vagal modulation of heart rate in healthy children [see comments] Journal of Pediatrics. 1997;130(5):725–729. doi: 10.1016/s0022-3476(97)80013-3. [published erratum appears in Journal of Pediatrics 1997 Sep;131(3):502] [DOI] [PubMed] [Google Scholar]
- Gutin B, Barbeau P, Litaker MS, Ferguson M, Owens S. Heart rate variability in obese children: Relations to total body and visceral adiposity, and changes with physical training and detraining. Obesity Research. 2000;8(1):12–19. doi: 10.1038/oby.2000.3. [DOI] [PubMed] [Google Scholar]
- Gutin B, Barbeau P, Owens S, Lemmon CR, Bauman M, Allison J, et al. Effects of exercise intensity on cardiovascular fitness, total body composition, and visceral adiposity of obese adolescents. American Journal of Clinical Nutrition. 2002;75(5):818–826. doi: 10.1093/ajcn/75.5.818. [DOI] [PubMed] [Google Scholar]
- Hathaway DK, Cashion AK, Wicks MN, Milstead EJ, Gaber AO. Cardiovascular dysautonomia of patients with end-stage renal disease and type I or type II diabetes. Nursing Research. 1998;47(3):171–179. doi: 10.1097/00006199-199805000-00008. [DOI] [PubMed] [Google Scholar]
- Hillier TA, Pedula KL. Complications in young adults with early-onset type 2 diabetes: Losing the relative protection of youth. Diabetes Care. 2003;26(11):2999–3005. doi: 10.2337/diacare.26.11.2999. [DOI] [PubMed] [Google Scholar]
- Kahn JK, Sisson JC, Vinik AI. Prediction of sudden cardiac death in diabetic autonomic neuropathy. Journal of Nuclear Medicine. 1988;29(9):1605–1606. [PubMed] [Google Scholar]
- Karavanaki K, Davies AG, Morgan MH, Baum JD. Autonomic function in a cohort of children with diabetes. Journal of Pediatric Endocrinology and Metabolism. 1997;10(6):599–607. doi: 10.1515/jpem.1997.10.6.599. [DOI] [PubMed] [Google Scholar]
- Karavanaki-Karanassiou K. Autonomic neuropathy in children and adolescents with diabetes mellitus. Journal of Pediatric Endocrinology and Metabolism. 2001;14(Suppl 5):1379–1386. [PubMed] [Google Scholar]
- Karvonen M, Viik-Kajander M, Moltchanova E, Libman I, LaPorte R, Tuomilehto J. Incidence of childhood type 1 diabetes worldwide. Diabetes Mondiale (DiaMond) Project Group. Diabetes Care. 2000;23(10):1516–1526. doi: 10.2337/diacare.23.10.1516. [DOI] [PubMed] [Google Scholar]
- Kaufman FR. Type 2 diabetes mellitus in children and youth: A new epidemic. Journal of Pediatric Endocrinology and Metabolism. 2002;15(Suppl 2):737–744. doi: 10.1515/JPEM.2002.15.s2.737. [DOI] [PubMed] [Google Scholar]
- Kleiger RE, Bigger T, Bosner MS, Chung MK, Cook JR, Rolnitzky LM, et al. Stability over time of variables measuring heart rate variability in normal subjects. American Journal of Cardiology. 1991;68:626–630. doi: 10.1016/0002-9149(91)90355-o. [DOI] [PubMed] [Google Scholar]
- Kleiger RE, Miller JP, Bigger JT, Jr, Moss AJ. Decreased heart rate variability and its association with increased mortality after acute myocardial infarction. American Journal of Cardiology. 1987;59(4):256–262. doi: 10.1016/0002-9149(87)90795-8. [DOI] [PubMed] [Google Scholar]
- Levitt NS, Stansberry KB, Wynchank S, Vinik AI. The natural progression of autonomic neuropathy and autonomic function tests in a cohort of people with IDDM. Diabetes Care. 1996;19(7):751–754. doi: 10.2337/diacare.19.7.751. [DOI] [PubMed] [Google Scholar]
- Liao D, Carnethon M, Evans GW, Cascio WE, Heiss G. Lower heart rate variability is associated with the development of coronary heart disease in individuals with diabetes: The atherosclerosis risk in communities (ARIC) study. Diabetes. 2002;51(12):3524–3531. doi: 10.2337/diabetes.51.12.3524. [DOI] [PubMed] [Google Scholar]
- Little RR, Rohlfing CL, Wiedmeyer H, Myers GL, Sacks DB, Goldstein DE. The national glycohemoglobin standardization program: A five-year progress report. Clinical Chemistry. 2001;47:1985–1992. [PubMed] [Google Scholar]
- Loman DG, Galgani CA. Physical activity in adolescents with diabetes. Diabetes Education. 1996;22(2):121–125. doi: 10.1177/014572179602200204. [DOI] [PubMed] [Google Scholar]
- Low, P. A. (1997). Clinical autonomic disorders (2nd ed.). Philadelphia: Lippincott-Raven.
- Lupoglazoff JM, Denjoy I, Kabaker M, Benali K, Riescher B, Magnier S, et al. Cardiorespiratory exercise tolerance in asymptomatic children with Ebstein’s anomaly. Pediatric Cardiology. 1999;20(3):189–194. doi: 10.1007/s002469900438. [DOI] [PubMed] [Google Scholar]
- Makimattila S, Schlenzka A, Mantysaari M, Bergholm R, Summanen P, Saar P, et al. Predictors of abnormal cardiovascular autonomic function measured by frequence domain analysis of heart rate variability and conventional tests in patients with type 1 diabetes. Diabetes Care. 2000;23(11):1686–1693. doi: 10.2337/diacare.23.11.1686. [DOI] [PubMed] [Google Scholar]
- Marrero DG, Fremion AS, Golden MP. Improving compliance with exercise in adolescents with insulin-dependent diabetes mellitus: Results of a self-motivated home exercise program. Pediatrics. 1988;81(4):519–525. [PubMed] [Google Scholar]
- Maser RELMJ. Obesity is not a confounding factor for performing autonomic function tests in individuals with diabetes mellitus. Diabetes Obesity & Metabolism. 2002;4(2):113–117. doi: 10.1046/j.1463-1326.2002.00188.x. [DOI] [PubMed] [Google Scholar]
- Massin MM, Derkenne B, Tallsund M, Rocour-Brumioul D, Ernould C, Lebrethon MC, et al. Cardiac autonomic dysfunction in diabetic children. Diabetes Care. 1999;22(11):1845–1850. doi: 10.2337/diacare.22.11.1845. [DOI] [PubMed] [Google Scholar]
- McArdle, W. D., Katch, F. I., & Katch, V. L. (2001). Exercise physiology: Energy, nutrition, and human performance Philadelphia: Lippincott Williams & Wilkins.
- McMurray RG, Guion WK, Ainsworth BE, Harrell JS. Predicting aerobic power in children. A comparison of two methods. Journal of Sports Medicine and Physical Fitness. 1998;38(3):227–233. [PubMed] [Google Scholar]
- McMurray RG, Harrell JS, Bradley CB, Deng S, Bangdiwala SI. Predicted maximal aerobic power in youth is related to age, gender, and ethnicity. Medicine & Science in Sports & Exercise. 2002;34(1):145–151. doi: 10.1097/00005768-200201000-00022. [DOI] [PubMed] [Google Scholar]
- Mosher PE, Nash MS, Perry AC, LaPerriere AR, Goldberg RB. Aerobic circuit exercise training: Effect on adolescents with well-controlled insulin-dependent diabetes mellitus. Archives of Physical Medicine and Rehabilitation. 1998;79(6):652–657. doi: 10.1016/s0003-9993(98)90039-9. [DOI] [PubMed] [Google Scholar]
- Myers L, Strikmiller PK, Webber LS, Berenson GS. Physical and sedentary activity in school children grades 5–8: The Bogalusa Heart Study. Medicine and Science in Sports and Exercise. 1996;28(7):852–859. doi: 10.1097/00005768-199607000-00012. [DOI] [PubMed] [Google Scholar]
- Narayan KM, Boyle JP, Thompson TJ, Sorensen SW, Williamson DF. Lifetime risk for diabetes mellitus in the United States. Journal of the American Medical Association. 2003;290(14):1884–1890. doi: 10.1001/jama.290.14.1884. [DOI] [PubMed] [Google Scholar]
- National Institute of Diabetes and Digestive and Kidney Diseases. (2004). National diabetes statistics fact sheet: General information and national estimates on diabetes in the United States (National Institutes of Health Publication No. 04–3892). Bethesda, MD: U.S. Department of Health and Human Services, National Institutes of Health.
- Ogden CL, Flegal KM, Carroll MD, Johnson CL. Prevalence and trends in overweight among US children and adolescents, 1999–2000. Journal of the American Medical Association. 2002;288(14):1728–1732. doi: 10.1001/jama.288.14.1728. [DOI] [PubMed] [Google Scholar]
- Osterhues HH, Grossmann G, Kochs M, Hombach V. Heart-rate variability for discrimination of different types of neuropathy in patients with insulin-dependent diabetes mellitus. Journal of Endocrinological Investigation. 1998;21(1):24–30. doi: 10.1007/BF03347282. [DOI] [PubMed] [Google Scholar]
- Pate RR, Heath GW, Dowda M, Trost SG. Associations between physical activity and other health behaviors in a representative sample of US adolescents. American Journal of Public Health. 1996;86(11):1577–1581. doi: 10.2105/ajph.86.11.1577. [DOI] [PMC free article] [PubMed] [Google Scholar]
- Rollins MD, Jenkins JG, Carson DJ, McClure BG, Mitchell RH, Imam SZ. Power spectral analysis of the electrocardiogram in diabetic children. Diabetologia. 1992;35(5):452–455. doi: 10.1007/BF02342443. [DOI] [PubMed] [Google Scholar]
- Rosenbloom AL, Joe JR, Young RS, Winter WE. Emerging epidemic of type 2 diabetes in youth. Diabetes Care. 1999;22(2):345–354. doi: 10.2337/diacare.22.2.345. [DOI] [PubMed] [Google Scholar]
- Sallis JF, Buono MJ, Roby JJ, Micale FG, Nelson JA. Seven-day recall and other physical activity self-reports in children and adolescents. Medicine & Science in Sports & Exercise. 1993;25(1):99–108. doi: 10.1249/00005768-199301000-00014. [DOI] [PubMed] [Google Scholar]
- Schumacher A. Linear and nonlinear approaches to the analysis of R-R interval variability. Biological Research for Nursing. 2004;5:211–221. doi: 10.1177/1099800403260619. [DOI] [PubMed] [Google Scholar]
- Spallone V, Menzinger G. Diagnosis of cardiovascular autonomic neuropathy in diabetes. Diabetes. 1997;46(Suppl 2):S67–S76. doi: 10.2337/diab.46.2.s67. [DOI] [PubMed] [Google Scholar]
- Task Force of the European Society of Cardiology and the North American Society of Pacing and Electrophysiology. Heart rate variability: Standards of measurement, physiological interpretation and clinical use. Circulation. 1996;93(5):1043–1065. [PubMed] [Google Scholar]
- Tomassoni TL. Introduction: The role of exercise in the diagnosis and management of chronic disease in children and youth. Medicine & Science in Sports & Exercise. 1996;28(4):403–405. doi: 10.1097/00005768-199604000-00002. [DOI] [PubMed] [Google Scholar]
- Verrotti A, Chiarelli F, Blasetti A, Morgese G. Autonomic neuropathy in diabetic children. Journal of Paediatrics and Child Health. 1995;31(6):545–548. doi: 10.1111/j.1440-1754.1995.tb00881.x. [DOI] [PubMed] [Google Scholar]
- Vinik AI, Freeman R, Erbas T. Diabetic autonomic neuropathy. Seminars in Neurology. 2003;23(4):365–372. doi: 10.1055/s-2004-817720. [DOI] [PubMed] [Google Scholar]
- Wallace JP, McKenzie TL, Nader PR. Observed vs. recalled exercise behavior: A validation of a seven day exercise recall for boys 11 to 13 years old. Research Quarterly for Exercise and Sport. 1985;56(2):161–165. [Google Scholar]
- Wawryk AM, Bates DJ, Couper JJ. Power spectral analysis of heart rate variability in children and adolescents with IDDM. Diabetes Care. 1997;20(9):1416–1421. doi: 10.2337/diacare.20.9.1416. [DOI] [PubMed] [Google Scholar]
- Ziegler D, Dannehl K, Volksw D, Muhlen H, Spuler M, Gries FA. Prevalence of cardiovascular autonomic dysfunction assessed by spectral analysis and standard tests of heart-rate variation in newly diagnosed IDDM patients. Diabetes Care. 1992;15(7):908–911. doi: 10.2337/diacare.15.7.908. [DOI] [PubMed] [Google Scholar]