Abstract
The structure of Bacillus subtilis TrmB (BsTrmB), the tRNA (m7G46) methyltransferase, was determined at a resolution of 2.1 Å. This is the first structure of a member of the TrmB family to be determined by X-ray crystallography. It reveals a unique variant of the Rossmann-fold methyltransferase (RFM) structure, with the N-terminal helix folded on the opposite site of the catalytic domain. The architecture of the active site and a computational docking model of BsTrmB in complex with the methyl group donor S-adenosyl-l-methionine and the tRNA substrate provide an explanation for results from mutagenesis studies of an orthologous enzyme from Escherichia coli (EcTrmB). However, unlike EcTrmB, BsTrmB is shown here to be dimeric both in the crystal and in solution. The dimer interface has a hydrophobic core and buries a potassium ion and five water molecules. The evolutionary analysis of the putative interface residues in the TrmB family suggests that homodimerization may be a specific feature of TrmBs from Bacilli, which may represent an early stage of evolution to an obligatory dimer.
INTRODUCTION
Modified nucleosides have been found in all types of nucleic acids. Among the different families of RNA molecules, tRNA is the most heavily modified. The chemical nature of these modifications is very diverse, going from simple modifications like methylation, isomerization, reduction, thiolation, deamination or alteration of the nature of the glycosyl bond to complex group addition or multiple modifications leading to the formation of ‘hypermodified’ nucleosides (1). These modifications are post-transcriptional and enzymatically generated during the course of RNA maturation. The RNA modification enzymes represent between 3 and 11% of the open reading frames (ORFs) in genomes (2) and many of these ORFs seem to be part of the minimal set of genes necessary for life (3). Structural studies of RNA-modifying enzymes can shed light on the remarkable specificity and the catalytic mechanism of these enzymes, on the biochemical consequences of these modifications, as well as on the evolutionary relationships among the RNA modification machineries in organisms from different kingdoms. A certain number of nucleoside modification enzymes acting on tRNA have been structurally characterized, allowing a better understanding of enzyme mechanism and substrate recognition. Among them are several pseudo-uridine synthases (ψ synthases). The crystal structure of the ψ synthase TruB unliganded or in complex with a tRNA substrate revealed profound conformational rearrangements of both the enzyme and the substrate upon binding (4–6). Similarly, the crystal structure of the complex between tRNA and archaeosine tRNA-guanine transglycosylase from the archaeon Pyrococcus horikhoshii revealed a drastic change from a canonical L-shaped tRNA to the alternative λ-shape (7).
The most common among tRNA modifications are the numerous methylations. Essentially all tRNA species contain methylated nucleosides and virtually all domains of the molecule have been found to be methylated. tRNA methylation is carried out by a diverse group of methyltransferases (MTases). S-adenosyl-l-methionine (AdoMet) is the most common methyl donor. AdoMet-dependent tRNA MTases belong to two structurally and phylogenetically unrelated protein superfamilies: the Rossmann fold MTases (RFM) and SPOUT MTases (abbreviated after the founding members SpoU and TrmD) (8). The latter is characterized by a deep trefoil knot crucial for the formation of the catalytic site and the cofactor-binding pocket (9,10). As part of a large scale project aiming to identify, characterize and classify novel tRNA methyltransferases (MTases) among proteins of unknown function in sequence databases, the product of the yggH ORF in Escherichia coli was studied and found to encode the TrmB enzyme. This enzyme, belonging to the RFM family of MTases is responsible for the formation of 7-methylguanosine at position 46 (m7G46) of the variable loop (11). The yeast ortholog of this enzyme, Trm8p, was found to exhibit the same specificity (12). In Bacillus subtilis the product of an orthologous gene ytmQ (here termed BsTrmB) has also been identified. Here, we present the crystal structure of the BsTrmB enzyme, and analyze it as a representative of the TrmB family.
MATERIALS AND METHODS
Cloning, expression and purification of the TrmB enzyme of B.subtilis
The trmB (ytmQ) ORF was amplified from genomic DNA of B.subtilis strain 168 using ML162 (CGTACATATGAGAATGCGCCACAAGCCTTGGGCTGATG) and ML163 (CGTACTCGAGCGTTCTCCATTCAACCTCAGCCCGATAGATC) as primers and Pwo DNA polymerase in a standard PCR. The amplified NdeI XhoI fragment was purified and inserted in the E.coli expression vector pET30b giving rise to the pML64 plasmid, where a C-terminal His-tag determinant is added to the trmB ORF. This plasmid was transformed in the E.coli Rosetta (DE3) expression strain.
Transformed cells were grown at 37°C in Luria–Bertani broth supplemented with kanamycine (30 µg/ml) to an optical density of 0.7 and isopropyl-β-d-thiogalactoside was added to a final concentration of 1 mM to induce recombinant protein expression. The culture was incubated for an additional 3 h at 37°C and the cells were subsequently harvested by centrifugation.
The cell pellet was resuspended in extraction buffer (50 mM Tris–HCl and 500 mM KCl, pH 8.5) and lyzed by sonication. The lysate was cleared by centrifugation (20 000 g for 10 min) and applied to a Pharmacia Biotech Chelating Sepharose Fast Flow column (1.6 × 30 cm) charged with Ni2+. The column was washed with extraction buffer supplemented with 5 mM imidazole and eluted with a linear gradient (0.005–1 M) of imidazole. The eluted fractions were analyzed by SDS–PAGE. The pure fractions were pooled and dialyzed against 2 × 1 liter extraction buffer. Finally the sample was concentrated on a Diaflo PM10 membrane (Amicon Corporation). At this stage the protein appears as a single band of 25 kDa on a denaturing gel.
The seleniated version of the protein was purified following the same procedure except that the cells were grown according to Doublié et al. (13).
Cloning and T7 in vitro transcription of the B.subtilis tRNAPhe gene
The procedure for cloning and T7 in vitro transcription of the B.subtilis tRNAPhe gene is based on the method described previously (14). The sequence coding for B.subtilis tRNAPhe was amplified by PCR using Pwo DNA polymerase (Roche Applied Science), B.subtilis genomic DNA as template and forward (5′-CGCTAATACGACTCACTATAGGCTCGGTAGCTCAGTTGGTAGAGC-3′) and reverse (5′-CGCCCTGGTGGCTCGGGACGGAATCGAACCGCCG-3′) oligonucleotides as primers. The PCR product was cloned into the SmaI site of the pUC18 vector, giving plasmid pFT1. Radioactive (32P) transcripts of B.subtilis tRNAPhe were obtained using MvaI-digested pFT1 plasmid as template. [α-32P]GTP and [α-32P]UTP were purchased from MPBiomedicals and T7 RNA polymerase from Roche Applied Science. Large amounts of the non radioactive transcript were obtained using a T7 MEGAshortscript kit (Ambion) following the instructions of the supplier.
Electrophoretic mobility shift assays
Purified protein (3, 5 or 10 µg) was preincubated for 5 min at 37°C in 20 µl of gel shift buffer (2.5% glycerol and 50 mM Tris–HCl pH 8.0) with or without addition of sinefungin (1 mM final concentration). B.subtilis tRNAPhe transcript (1 µg) was then added and incubation was continued for 30 min. Loading buffer (4 µl) (0.25% bromophenol blue and 30% glycerol) was added to each sample which was loaded on a 6% polyacrylamide gel in 1× TB (Tris 89 mM, boric acid 89 mM, pH 8.3). Electrophoresis was carried out at 4°C under constant voltage (10 V/cm). The gel was stained with methylene blue.
Construction of a B.subtilis mutant strain lacking TrmB activity
The BFS1045 B.subtilis mutant strain carries a disrupted ytmQ ORF. This strain was obtained after transformation of the wild type B.subtilis 168 strain (15) with the plasmid pYR1045 constructed as follows. A 250 bp DNA fragment corresponding to the internal part of the ytmQ ORF (from nt 3 058 750 to 3 059 000, according to the SubtiList database: http://genolist.pasteur.fr/SubtiList) was generated by PCR using two primers adding a BamHI and a HindIII restriction sites to the 5′ and the 3′ end, respectively, of the PCR product. This fragment was then inserted between the BamHI and the HindIII sites of the plasmid pMUTIN2 (16) to create plasmid pYR1045. The correct integration of pYR1045 at the ytmQ locus by a single crossing over, resulting in ytmQ disruption, was checked by PCR.
Crystallization and data collection
Crystals were obtained by hanging drop. A protein solution of 10 mg/ml was equilibrated against a solution containing 20% PEG4000, 20% glycerol, 80 mM ammonium sulfate and 60 mM potassium acetate, pH 5 at 20°C. MAD data were collected at the FIP beamline BM30 (17) (ESRF, Grenoble, France). Crystals were flash frozen in the nitrogen stream. For each wavelength (Table 1) 150 frames were collected with a Δφ = 1°. Data were processed with DENZO/SCALEPACK (18) and programs from the CCP4 package (19). Details about the data collection and processing are given in Table 1.
Table 1.
Crystal, data and refinement parameters
| Data collection | |||
| Space group | R 3 | ||
| Unit cell | a = 178.75 Å, b = 178.75 Å, c = 41.90 Å α = β = 90°, γ = 120° | ||
| Resolution range Scalepack | 30–2.1 Å (2.10–2.18 Å) (overall (last shell)) | ||
| Resolution range Truncate | 30–2.1 Å (2.10–2.12 Å) [overall (last shell)] | ||
| λ1 edge | λ2 inflection | λ3 remote | |
| Wavelength/Å | 0.980101 | 0.980285 | 0.978110 |
| Completeness | 99.4 (95.5) | 99.8 (98.0) | 99.7 (97.0) |
| Mosaicity | 0.54 | 0.55 | 0.55 |
| R merge | 4.9 (33.1) | 4.4 (30.3) | 4.4 (31.8) |
| Bwilson | 31.3 | 31.4 | 31.9 |
| Mn(I/Sigma) | 26.0 (3.64) | 21.4 (3.31) | 19.6 (2.59) |
| Unique reflections | 174 360 | 174 360 | 174 528 |
| Phasing | |||
| SOLVE Res. range | 20–2.15 Å | ||
| nanomalous found | 5 | ||
| FOM after SOLVE | 0.3 | ||
| RESOLVE Res. range | 20–2.4 Å | ||
| FOM after RESOLVE | 0.54 | ||
| Residues placed | 34 of 416 | ||
| Main chain placed | 274 | ||
| Build score | 262 | ||
| Refinement | Final model | ||
| R/Rfree | 0.20/0.23 | Molecule A residues 8–212 | |
| RMS bonds/Å | 0.013 | Molecule B residues 10–213 | |
| RMS angles/deg | 1.51 | 3 K+ ions, 309 water molecules | |
Structure determination
The structure was solved by SeMAD. With SOLVE (20) 5 out of 10 possible Se sites were identified. RESOLVE (21) was used to improve initial phases and to do initial tracing. The final model was built manually in TURBO-FRODO, and refined with CNS (22). The asymmetric unit contains two BsTrmB molecules and the asymmetric unit was transformed so as to contain the dimer most likely corresponding to the functional unit. In each monomer a larger electron density between the carbonyls of residues Asn115 and Gly46 was refined as a potassium ion. In the dimer interface a large electron density was also attributed to a potassium ion on the basis of the coordination and coordination distances (23). The coordinates and structure factors have been deposited at the PDB (ID code 2FCA).
Comparative structure and sequence analyses
Sequence database searches and multiple sequence alignment (MSA) of the TrmB family were described previously (24). Here, searches of the protein structures available at the Protein Data Bank were carried out with DALI (25). Superposition of structures of BsTrmB and SpTrmB dimers was carried out with the I2I-SiteEngine Server (26), which superposes protein complexes to maximize the overlap of their interaction interfaces. The protein-protein interaction server (27) was used to calculate the interface accessible surface area (ASA), planarity and gap volume indices of the interfaces, and number of interface segments. Interface ASA (per monomer) is calculated as B/2 where B is a difference between a sum of total ASAs of individual monomers and the ASA of a dimer. Gap volume index is a gap volume of the interface divided by the interface ASA. The planarity of the interface is described as a root mean square deviation (r.m.s.d.) of all the interface atoms from the least-squares plane through the atoms. Interface segments were defined by allocating interface residues separated by more than five residues to different segments. The residue propensity (RP) score of the interface was calculated as where ni is the number of interface residues of type I and Pi is the number-based propensity to be part of a homodimer interface (28). The area fraction of non-polar interface atoms (fnp) was calculated using the area contributed by carbon atoms. The area fraction of fully buried atoms (fbu) was calculated using atoms with zero ASA after dimer formation.
Evolutionary rates of all interfaces were calculated with CONSURF (29) based on the MSA generated previously (24), refined based on threading the TrmB sequences onto the new structure. Sequences with ambiguous alignment in the interface region were removed from the MSA. P-values were calculated according to (30) using evolutionary rates obtained from CONSURF. Simply, P-values express the support for the null hypothesis that ‘the mean evolutionary rate of the interface consisting of n residues is not lower than the mean evolutionary rate of the random set of n residues drawn without replacement from the set of all surface residues’ (low P-value—null hypothesis should be rejected).
Molecular docking
SURFLEX 1.31 (31) was used to dock AdoMet into the active site of BsTrmB. Structures of AdoMet and BsTrmB were prepared for docking using SYBYL 7.0. Several docking runs with different parameters were performed. In each run, the docking simulation was started from 10 random orientations of AdoMet in random conformations. Best scoring results from all runs were ranked according to a theoretical affinity and crash score, which reflects clashes of the ligand with itself and with the protein molecule. The second best solution was very similar to the binding mode observed in other members of the RFM superfamily and was chosen for further analyses.
GRAMM 1.03 (32) was used to generate 10 000 alternative docking models using the BsTrmB-AdoMet model with the crystal structure of yeast tRNAPhe (Protein Data Bank ID code 1EHZ). The low-resolution docking mode of GRAMM was used. A value of repulsion parameter was adjusted to minimize the interpenetration between the tRNA and protein molecules. Subsequently, all 10 000 orientations were filtered to keep only those structures that satisfied loose distance constraints for placing G46 within 14 Å from the methyl group of AdoMet. The variant with the best shape complementarity and minimal number of clashes was chosen for the refinement.
The refinement of the BsTrmB–AdoMet–tRNA complex model was conducted by energy minimization in explicit water with periodic boundaries using the SANDER module of AMBER 8 (33). This minimization allowed for removing steric clashes between the molecules and formation of favorable contacts between the BsTrmB, AdoMet and tRNA. The nonbonded cutoff was set to 10 Å. A total of 1000 cycles of steepest descent were followed by 1500 cycles of conjugate gradients. The parameters for the AdoMet cofactor were derived using the program ANTECHAMBER. The parameters and libraries for yeast tRNAPhe were obtained from the AMBER Parameter Database at School of Pharmacy & Pharmaceutical Sciences (http://pharmacy.man.ac.uk/amber/).
RESULTS AND DISCUSSION
Functional characterization of BsTrmB
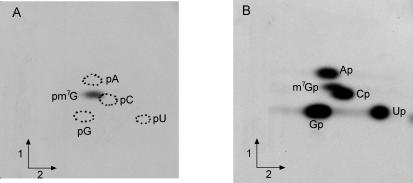
The ytmQ ORF in B.subtilis encodes an ortholog of the E.coli MTase TrmB responsible for the formation of m7G46 in the variable loop of tRNA. To test the MTase activity of the ytmQ gene product the purified protein was incubated with [methyl-14C]AdoMet and T7 in vitro transcribed B.subtilis tRNAPhe. The tRNA was subsequently hydrolyzed by nuclease P1 and the resulting 5′-phosphate nucleosides were analyzed by bidimensional cellulose thin layer chromatography (2D-TLC) followed by autoradiography. Figure 1A reveals the formation of a radioactive compound with the migration characteristics of 7-methylguanosine 5′-phosphate (pm7G). On the other hand, radioactive (32P) B.subtilis tRNAPhe transcripts were obtained by T7 in vitro transcription in the presence of [α-32P]GTP or [α-32P]UTP. These transcripts were incubated in the presence of the purified ytmQ gene product and non radioactive AdoMet. After incubation, the [α-32P]GTP-labelled transcript was hydrolyzed by nuclease P1 (generating 5′-phosphate nucleosides) and the [α-32P]UTP-labelled transcript was hydrolyzed by RNAse T2 (generating 3′-phosphate nucleosides-nearest neighbor analysis: B.subtilis tRNAPhe contains U47). The hydrolysates were analyzed by 2D-TLC followed by autoradiography. The formation of a modified guanosine with migration characteristics of pm7G was observed in the case of [α-32P]GTP-labeled tRNAPhe (data not shown) whereas the formation of a nucleotide with migration characteristics of 7-methylguanosine 3′-phosphate (m7Gp) was observed with [α-32P]UTP-labeled tRNAPhe (Figure 1B). These results show that the B.subtilis ytmQ gene product displays the same activity as the E.coli TrmB enzyme, generating m7G at position 46 in tRNA. For this reason, the ytmQ gene has been renamed trmB and the gene product BsTrmB.
Figure 1.
Affinity-purified ytmQ gene product (BsTrmB) catalyzes the formation of m7G in T7 transcripts of B.subtilis tRNAPhe. (A) B.subtilis tRNAPhe (5 µg) was incubated with 5 µg of purified BsTrmB protein and 15 µM of [methyl-14C]AdoMet (58 mCi/mmol) in TM buffer (50 mM Tris–HCl and 10 mM MgCl2, pH8) in a total volume of 200 µl. After 30 min incubation at 37°C the tRNA was recovered and digested with nuclease P1. The resulting nucleotides were analyzed by 2D-TLC and autoradiography as described (42). First dimension developed with isobutyric acid/conc. NH4OH/water (66:1:33; v/v/v); second dimension developed with conc. HCl/isopropanol/water (17.6:68:14.4; v/v/v). (B) [α-32P]UTP-labeled in vitro transcribed B.subtilis tRNAPhe (5 × 10⁵ c.p.m.) was incubated with 5 µg of purified BsTrmB and 30 µM AdoMet in TM buffer in a total volume of 300 µl. After 30 min incubation at 37°C, the tRNA was recovered, hydrolyzed by RNAse T2 and the resulting nucleotides were analyzed as above.
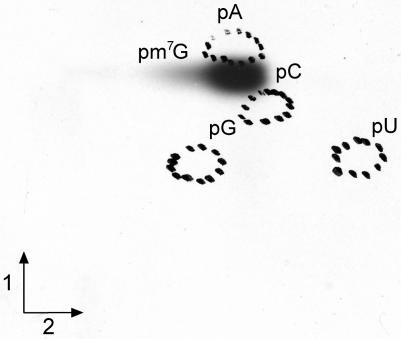
The B.subtilis strain BFS1045, in which the trmB gene is inactivated by an insertion, shows normal growth, demonstrating that neither the BsTrmB protein, nor the m7G46 modification are essential. Total (bulk) tRNA extracted from the BFS1045 strain was shown to be a substrate for the purified BsTrmB enzyme (Figure 2).
Figure 2.
Total tRNA extracted from the the B.subtilis strain BS1045 with a disrupted trmB gene is a substrate for the affinity-purified BsTrmB MTase. Total tRNA (5 µg) was incubated with the purified BsTrmB enzyme (5 µg) in the presence of 30 µM [methyl-14C]AdoMet in TM buffer. After 30 min incubation at 37°C the tRNA was recovered and digested with nuclease P1. The resulting nucleotides were analyzed by 2D-TLC and autoradiography as described in the legend of Figure 1.
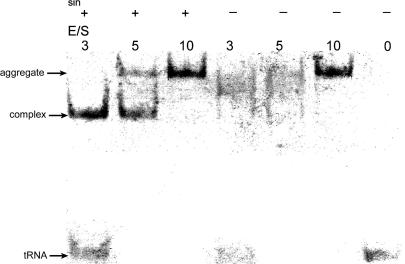
The formation of a specific complex between BsTrmB and a tRNA substrate was tested by the electrophoretic mobility shift assays in the presence or absence of sinefungin, a cofactor analog. As can be seen in Figure 3, a bandshift is observed in the presence of sinefungin, indicative of complex formation. When very high enzyme/substrate ratios are used, higher molecular mass aggregates appear, even in the absence of sinefungin. Experiments are in progress to determine the stoichiometry of the complex between BsTrmB and the tRNA.
Figure 3.
Complex formation between BsTrmB and B.subtilis tRNAPhe transcript. The experimental conditions are described in Materials and Methods. The enzyme to substrate ratio (E/S) varies from 3 to 10. The experiment was performed with or without addition of sinefungin (10−3 M).
Overall structure of BsTrmB
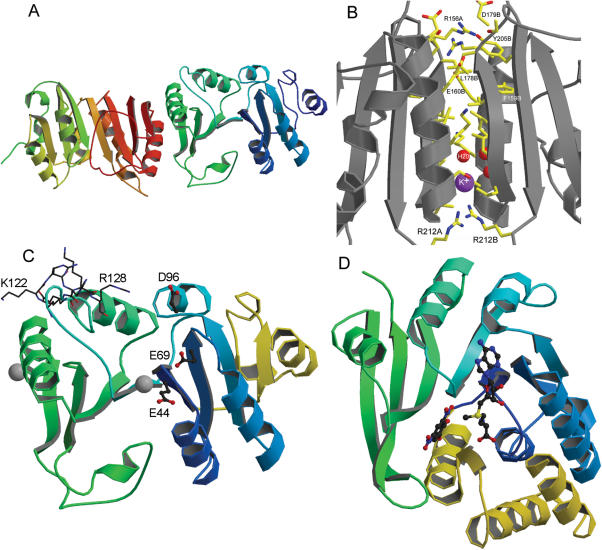
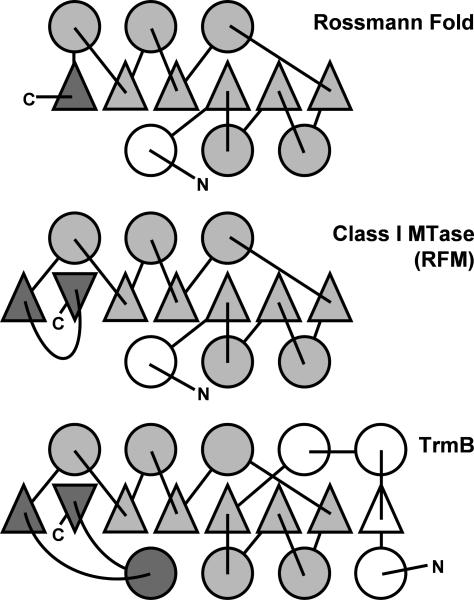
The crystals of BsTrmB diffracted to 2.1 Å, but the structure could not be fully traced automatically with the program Solve/Resolve. Therefore most of the structure was built manually. The electron density for the two BsTrmB molecules in the asymmetric unit is clear for residues 10–210. The 10 N-terminal residues of the protein and the His-tag are not visible in the electron density. Analysis of the Ramachandran plot (Supplementary Figure 1) revealed that 95.8% residues are in favored regions, and 99.0% residues are in allowed regions. There are four outliers (E86 and L185 in monomer A and G187 and S198 in monomer B), all in surface-exposed regions with a relatively high temperature factor. The 3D fold of the BsTrmB monomer is very similar to the RFM structure, also termed ‘class I’ MTase fold (34) (Figures 4C and 5). It consists of a seven-stranded β-sheet flanked by helices, and differs from the canonical Rossmann-fold by an additional strand inserted between strand 5 and 6 (35). Most parts of the structure of BsTrmB (including the conserved motifs I-VIII) are in general agreement with the theoretical model we proposed previously for the orthologous EcTrmB enzyme (24). Nonetheless, the crystal structure of BsTrmB reveals one striking difference with respect to all previously characterized members of the RFM fold that was also unaccounted for in the previous model of EcTrmB: residues 10–40 of the N-terminus fold back over the protein, over helix C, strand 2 and 3, and helix B. As a result, the N-terminal helix (corresponding to motif X) is located on an opposite part of the structure than in other RFM enzymes (Figure 5).
Figure 4.
(A) Overall view of the dimer structure of BsTrmB. (B) More detailed view of the dimer interface, with the potassium ion shown in magenta and water molecules in red. (C) Ribbon drawing of BsTrmB monomer A with the positively charged residues in loop 121–128 shown in bonds and residues Glu44, Glu69 and Asp96 shown in ball-and-stick. The N-terminal residues 8–40 are shown in yellow. (D) Ribbon drawing of catechol O-MTase (1VID) in the same orientation as the BsTrmB monomer A in (C). The N-terminal helix is shown in yellow.
Figure 5.
Topology diagram of typical Rossmann-fold dehydrogenases, Class-I (RFM) MTases and TrmB. Triangles indicate β-strands in parallel orientation, the inversed triangles in MTases indicate the only antiparallel strand, circles indicate helices, connectors indicate loops. The conserved core is colored in light gray, the variable N- and C-terminal elements are colored in white and dark gray, respectively.
Searches in the PDB for structures related to BsTrmB revealed that a closely related structure from Streptococcus pneumoniae (here termed SpTrmB) was solved by a structural genomics consortium, but not yet analyzed in the literature (1YZH; Y. Kim, H. Li, F. Collart and A. Joachimiak, manuscript in preparation). SpTrmB and BsTrmB exibit the 0.89 Å average r.m.s.d. between 190 superimposable Cα atom pairs and share the unusual conformation of the N-terminal region. The second best matches for BsTrmB in the PDB are the more remotely related AdoMet-dependent methyltransferase from Mycobacterium tuberculosis (1I9G, RMSD 2.2 Å for 141 Cα atom pairs) and catechol O-MTase (1VID, RMSD 2.2 Å for 141 Cα atom pairs), one of the smallest class I MTases, which exhibits an orthodox RFM fold.
The BsTrmB structure contains three potassium ions per asymmetric unit, one in the interface between monomers and one in a region involved in AdoMet binding in the homologous catechol O-MTase, bound to the main chain carbonyls of residues Asn115 and Gly46.
Dimerization
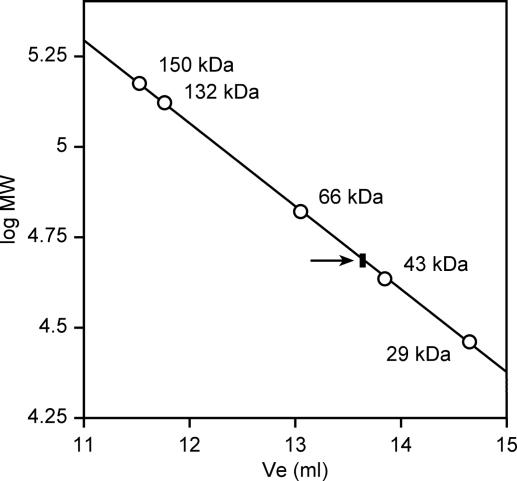
In the crystal BsTrmB forms a homodimeric structure, with two molecules per asymmetric unit. The dimer surface covers helix E (residues 154–170), and strand 6 (172–179), and buries a surface of 805 Å2 per molecule. The dimer contact buries a cluster of five water molecules of which three are bound to a potassium ion. The potassium ion itself is bound to residues Ser167 OH from molecules A and B, and to the main chain carbonyls of Leu171 from molecules A and B. It is also coordinated to Arg212 NH2 from molecules A and B, at a distance of 4.0 Å. The rest of the interface consists largely of hydrophobic interactions involving Phe159, Leu163, Leu173, Leu176 and Leu178, and hydrogen bond contacts involving residues Ser183, Arg212 and Arg156 on the edges of the interface (Figure 4B). The analysis of the molecular mass of the BsTrmB by gel filtration studies confirms that BsTrmB is dimeric also in solution, and that dimerization is not a consequence of crystal packing only (Figure 6).
Figure 6.
Gel filtration analysis of BsTrmB. Molecular mass determination was performed using an Amersham Biosciences Superose P12 HR (1 × 30 cm) column equilibrated with 50 mM Tris–HCl, pH8, 10 mM MgCl2, 300 mM KCl and 10% Glycerol. The flow rate was 0.4 ml/min. The column was calibrated with the following markers: carbonic anhydrase (29 kDa), ovalbumin (43 kDa), BSA (66 kDa), BSA dimer (132 kDa) and alcohol dehydrogenase (150 kDa). The elution volume corresponding to BsTrmB is indicated by an arrow.
Analysis of the asymmetric unit of the SpTrmB structure (1YHZ) reveals two molecules, however in an orientation that is unlikely to be biologically relevant (low interface ASA and lack of features typical for real homodimers—data not shown). Thus, symmetry related molecules were created by applying symmetry operators from space group C121 in which SpTrmB crystallized. In the reconstructed unit cell we identified a putative biological interface essentially identical to that in the BsTrmB dimer. All other possible crystal interfaces in SpTrmB have very small interface ASA or big gap volume (data not shown) and were regarded as resulting from crystal packing.
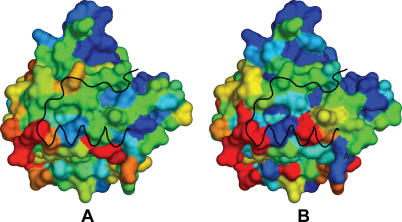
The common interface of BsTrmB and SpTrmB dimers was analyzed in respect to the physical and geometrical properties and compared with values obtained for homodimers (27,28) (Tables 2 and 3). It was shown previously (21) that the combination of these parameters (Materials and Methods) can be successfully used to discriminate between crystallographic interfaces and biological interfaces with very low false-positive rate (0.6%). Most homodimers have Fbu > 30%, Fnp*B > 800 Å2 and RP > 0. Dimeric interfaces of BsTrmB and SpTrmB have very similar features to those typical for homodimers (Table 2). However, a mapping of evolutionary rates (Figure 7) onto the surface of the structure and statistical test of a significance of a conservation level of the interface show that the interface is not as conserved as expected for homodimers. The level of conservation numerically is described with P-value equal to 0.35 which does not allow to reject a null hypothesis that the interface is not more conserved that the rest of the surface. Small interface area, low RP score and moderate level of conservation suggest that either BsTrmB and SpTrmB belong to the class of transient homodimers (36) or the dimer structure is only conserved within the subgroup of TrmB enzymes from Bacilli.
Table 2.
Analysis of interfaces in 1yzh and ytmq in terms of conservation of interfaces
| Mapped on | SpTrmB chain A | BsTrmB chain A |
|---|---|---|
| Group: Bs TrmB-like | ||
| Interface score | 0.11 | 0.19 |
| Mean random surface patch score | 0.28 | 0.27 |
| P-value | 0.22 | 0.35 |
| Group: Ec TrmB-like | ||
| Interface score | 0.54 | 0.57 |
| Mean random surface patch score | 0.23 | 0.18 |
| P-value | 0.90 | 0.96 |
Table 3.
Analysis of the dimer interfaces in Bs and SpTrmB
| SpTrmB chain A | BsTrmB chain A | Homodimers (mean) | Transient homodimers (mean) | |
|---|---|---|---|---|
| Subunit interface area (B/2) | 787 | 805 | 1368 | 740 |
| Number of residues | 18 | 20 | 37 | NA |
| Planarity | 1.28 | 1.32 | 3.5 | 2 |
| Interface residue segments | 2 | 3 | 5 | NA |
| Gap volume index | 2.64 | 3.05 | 2.2 | 2.8 |
| Hydrogen bonds per 100 A2 | 1.1 | 1.2 | 0.7 | 1.2 |
| RP score | 0.42 | 0.43 | 4.3 | <1.5 |
| Fraction of fully buried atoms (Fbu) | 0.38 | 0.35 | 0.36 | NA |
| Fraction of nonpolar atoms (Fnp) | 0.62 | 0.63 | 0.65 | 0.63 |
| Non-polar interface area (Fnp*B) | 976 | 1015 | >800 | 932 |
Data for homodimers were obtained from protein–protein interaction server (27) and from Ref. (43). Data for transient homodimers were obtained from protein–protein interaction server and from Ref. (28). Those parameters of interfaces in SpTrmB and BsTrmB which suggest that either SpTrmB and BsTrmB belong to the class of transient homodimers are shown in bold.
Figure 7.
Evolutionary rates derived from Bs and SpTrmB (A) and other TrmB-like sequences (B) mapped on the surface of BsTrmB structure. Gradient of colors represents the change of conservation: from red (not conserved) to blue (conserved). The black ribbon represents beta strand 6 and alpha helix E of the second subunit of a dimer.
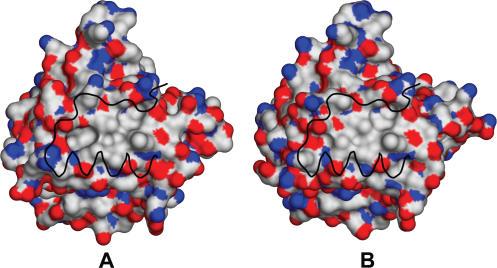
The dimerization interface is formed by a central hydrophobic cluster of five residue pairs surrounded by a polar and charged rim of partially buried residues (Figure 8). The hydrophobicity of the central region is conserved in BsTrmB and SpTrmB but not in all TrmB MTases. In particular, the region consists of Phe159 and Leu173 (hydrophobicity conserved only in Bs-like TrmBs), Leu163 (hydrophobicity conserved both in Bs- and Ec-like TrmBs), Leu176 [hydrophobicity conserved only in Bs-like TrmBs (except Mollicutes)], Leu 178 [hydrophobicity conserved in BsTrmB-like MTases but only in one subgroup (mainly Bacillales)].
Figure 8.
Surface representations of BsTrmB (A) and SpTrmB (B) structures colored by atomic type (red, oxygen; blue, nitrogen; white, carbon). The black ribbon represents beta strand 6 and alpha helix E of the second subunit of a dimer.
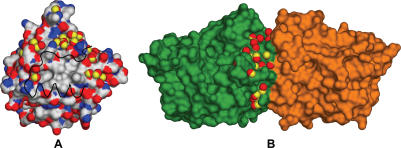
The rim of polar residues in the interface is only moderately conserved. It seems that this region can accept substitutions of several polar amino acids without losing the ability to dimerize. The interaction in the rim region is formed by a complicated network of hydrogen bonds and water bridges. Not all hydrogen bonds and water bridges are preserved in crystal structures of BsTrmB and SpTrmB despite their sequence similarity (Figure 9). Apparently, this network of hydrogen bonds and electrostatic interactions is even less similar in more distantly related BsTrmB-like MTases where it is created by different interacting amino acids.
Figure 9.
Surface representations of BsTrmB monomer (A) colored by atomic type (red, oxygen; blue, nitrogen; white, carbon) and BsTrmB dimer (B) colored by chain (chain A, green; chain B, orange). Red and yellow overlapping balls represent conserved positions of water molecules in Bs and SpTrmB crystal structures respectively (only water molecules for one chain are shown).
Identification of the ligand-binding and active sites
At present only the structure of the ligand-free BsTrmB is available. However, from the homology to other RFMs, the knowledge that AdoMet acts as a co-factor in the tRNA (m7G46) methylation reaction, and the mutagenesis data obtained for the orthologous EcTrmB enzyme (24) it is possible to identify the functionally important sites.
RFMs bind the methyl donor AdoMet in a deep groove formed by the C-terminal edges of strands 1–3. This is the most conserved region in the RFM superfamily, both at the sequence and structure level. The comparison of BsTrmB to the structure of catechol O-MTase (COMT) complexed with AdoMet (Figure 4C and D) shows conservation of the AdoMet-binding residues typical for motifs I, II and III. We carried out computational docking of AdoMet to the BsTrmB structure, which revealed that the preferred binding of the cofactor is similar to that observed in other members of the superfamily (Supplementary Data). According to the sequence conservation and the docking model, Glu44 is inferred to coordinate the methionine moiety, Glu69 may coordinate the ribose hydroxyl groups, and Asp96 may coordinate the N6 group of the adenine moiety.
On the other hand, the sequences and structures of the substrate-binding/active site are not conserved or only weakly conserved between different families of MTases (and this is also the case between BsTrmB and COMT). In BsTrmB, a large insertion (residues 179–200) folds over the active site region. This insertion is located between strands 6 and 7, in a site where structurally variable insertions are frequently found among different RFMs. The electron density is relatively weakly defined in the hinge regions around the insertion in molecule A and in the whole insertion in molecule B. The insertion is anchored to the rest of the protein mostly by hydrogen bonds, and a few hydrophobic residues (Tyr193 and Phe197) that cluster with Phe116 and Ile204. Tyr 193 is conserved (or conservatively substituted by Phe) in the TrmB family and is positioned in such a way that it could stack with a guanine bound in the active site in BsTrmB, e.g. in analogy to the role fulfilled by Val21 in the m6A MTase M.TaqI, the only MTase acting on purines in nucleic acids that has been successfully crystallized with the substrate in the active site (37).
The invariant Asp154 and conserved Thr153 could be involved (directly or indirectly) in coordination of the N2 amino group and the O6 group, respectively, of the target guanine base. In agreement with this finding, the mutation of Asp180 in EcTrmB (homologous to Asp154 in BsTrmB) abolishes tRNA binding, but has only a minor effect on AdoMet binding (24).
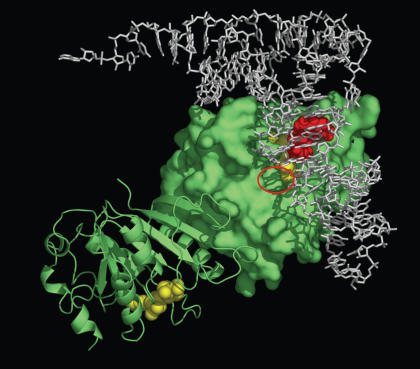
Using SURFLEX and GRAMM we constructed a preliminary computational docking model of the BsTrmB-AdoMet-tRNAPhe complex. The model (Figure 10; coordinates available as Supplementary Data) suggests an overall good surface complementarity between the protein and the tRNA molecules. However, the methylated N7 atom of the target guanosine is turned away from the methyl group of AdoMet and if our model is correct, then a significant conformational change of the tRNA substrate would be required to flip G46 into the active site of the enzyme. Interestingly, the same binding mode is equally compatible with the ‘lambda’ form of the tRNA previously observed in the archaeosine tRNA-guanine transglycosylase (7), where the D-arm unfolds and loses its tertiary interactions with the tRNA core. A similar rearrangement in the context of our model would result in clearing the space for G46 and enabling its rotation into the catalytic site (data not shown). Unfortunately, the computational simulation of such rearrangement is beyond the limits of the available methods. The current docked model remains to be tested experimentally (for instance by cross-linking experiments), both with respect to the mutual orientation of the protein and the tRNA, and the type of the potential conformational change and base-flipping of G46.
Figure 10.
A computational docking model of AdoMet (yellow spheres) and tRNA (white sticks) to the BsTrmB dimer (in green, one monomer shown using the surface representation, the other as cartoons depicting secondary structures). The target guanosine in the original tRNA structure is shown in red and the putative base-binding pocket, where it is hypothesized to be flipped out, is indicated by a red ellipse).
Importantly, the crystal structure of BsTrmB allows us to revise the role of conserved Thr191 and Glu194 residues, whose homologs in EcTrmB (Thr217 and Glu220) were found to be important for the enzyme activity and predicted to be involved in tRNA binding. Thr191 is located at the bottom of the AdoMet-binding pocket, where it is predicted to participate in the stabilization of the methionine moiety, while Glu220 is positioned away from any possible binding sites and seems to be involved in the stabilization of the 179–200 insertion.
The 179–200 insertion in BsTrmB occupies the space that in other RFMs (e.g. in the aforementioned COMT or M.TaqI) is filled by the N-terminal helix. Thus, it appears that TrmB evolved a novel structural element involved in the binding of the target base, which displaced (both in the functional and structural sense) the N-terminal region typically used for this purpose. The N-terminal region was relocated to the completely opposite part of the structure. This finding is important for the evolutionary studies of the RFM superfamily and in general, provides a new example of how the protein folds can change in the course of the evolution (38).
Part of the putative substrate-binding site of BsTrmB is a loop containing the highly positively charged sequence 121-PKKRHEKR-128. The electron density of this loop is very clear despite the fact that it protrudes quite far out of the protein surface. The location near the active site region, and the large accessibility and concentration of positively charged residues makes this loop a candidate for involvement in the binding of the tRNA substrate. In our docking model this loop makes extensive contacts with the tRNA. Indeed, for the homologous EcTrmB enzyme it was shown that mutations of residues homologous to His125, Arg128 or Arg129 (His151, Arg154A and Arg155A, respectively) to alanine all reduced the activity of the enzyme to below 10% of the wild-type activity, and the mutant Arg150A (residue homologous to Arg124 in BsTrmB) had only 30% of the wild-type activity. The mutation Asn152A in EcTrmB (the equivalent of Glu126 in BsTrmB) did not have any impact on catalysis or tRNA binding. In agreement with this finding, the side chain of Glu126 in the structure of BsTrmB points away from the potential tRNA-binding site.
CONCLUSIONS
BsTrmB, the product of the ytmQ gene from B.subtilis, is shown here to possess tRNA (m7G46) MTase activity in the presence of AdoMet. It forms a complex with the tRNAPhe from B.subtilis in the presence of the cofactor analog sinefungin, and not in its absence. The crystal structure of the tRNA (m7G46) MTase BsTrmB demonstrates that this enzyme belongs to the RFM superfamily, but exhibits an unexpected rearrangement of structural elements that form the putative active site, leading to considerable modification of the common Rossmann-like fold. Interestingly, BsTrmB is found to be a dimer both in crystal and in solution. We have also identified another closely related structure of SpTrmB to exhibit a very similar dimeric structure in crystals. This is an interesting finding in the light of the fact that in Saccharomyces cerevisiae the functional form of the the tRNA (m7G46) MTase is also a dimer, albeit comprising one protein orthologous to TrmB (Trm8p) and another (Trm82p) completely unrelated (39). Homooligomerization has been reported previously in a number of tRNA modification enzymes, such as the tRNA (m1A) MTase TrmI, and has been proposed to be an intermediate step in the evolution towards heterooligomeric enzymes, with different subunits specialized in substrate binding or catalysis (14). It is interesting to note that among DNA MTases, some were found to be monomers, while others dimerize at different conditions and sometimes require the dimerization to function (40,41).
The moderate level of conservation of residues at the dimer interface in BsTrmB and the fact that the orthologous EcTrmB is a monomer (11) argue that the dimerization of BsTrmB and SpTrmB represents an early stage of evolution of a potential obligatory dimer. We propose that the structural and biochemical analysis of other members of the TrmB family could shed more light on the molecular basis of the evolution of dimerization among MTases as well as its functional relevance. Thus, we argue that studies of the structure and function of relatively closely related proteins are essential for the understanding of important biological processes and that the solution of structures of just single members of each protein family under the structural genomics initiative will be insufficient for that purpose.
SUPPLEMENTARY DATA
Supplementary Data are available at NAR Online.
Supplementary Material
Acknowledgments
I.Z. gratefully acknowledges funding by the ESA Prodex programme. J.M.B. and J.K. were supported by the Polish Ministry of Scientific Research and Information Technology (grant PBZ-KBN-088/P04/2003). L.D. is a Research Associate of the Fonds National de la Recherche Scientifique (FNRS). This work was supported by a grant from the Fonds pour la Recherche Fondamentale Collective (FRFC). Funding to pay the Open Access publication charges for this article was provided by the FRFC.
Conflict of interest statement. None declared.
REFERENCES
- 1.Hopper A.K., Phiziky E.M. tRNA transfers to the limelight. Genes Dev. 2003;17:162–180. doi: 10.1101/gad.1049103. [DOI] [PubMed] [Google Scholar]
- 2.Anantharaman V., Koonin E.V., Aravind L. Comparative genomics and evolution of proteins involved in RNA metabolism. Nucleic Acids Res. 2002;30:1427–1464. doi: 10.1093/nar/30.7.1427. [DOI] [PMC free article] [PubMed] [Google Scholar]
- 3.Mushegian A.R., Koonin E.V. A minimal gene set for cellular life derived by comparison of complete bacterial genomes. Proc. Natl Acad. Sci. USA. 1996;93:10268–10273. doi: 10.1073/pnas.93.19.10268. [DOI] [PMC free article] [PubMed] [Google Scholar]
- 4.Hoang C., Ferré-d'Amaré A. Co-crystal structure of a tRNA Psi55 pseudouridine synthase: nucleotide flipping by an RNA modifying enzyme. Cell. 2001;107:929–939. doi: 10.1016/s0092-8674(01)00618-3. [DOI] [PubMed] [Google Scholar]
- 5.Pan H., Agarwalla S., Moustakas D., Finner-Moore J., Stroud R. Structure of tRNA pseudo-uridine synthase TruB and its RNA complex: RNA recognition through a combination of rigid docking and induced fit. Proc. Natl Acad. Sci. USA. 2003;100:12648–12653. doi: 10.1073/pnas.2135585100. [DOI] [PMC free article] [PubMed] [Google Scholar]
- 6.Phannachet K., Huang R. Conformational change of pseudouridine55 synthase upon association with RNA substrate. Nucleic Acids Res. 2004;32:1422–1429. doi: 10.1093/nar/gkh287. [DOI] [PMC free article] [PubMed] [Google Scholar]
- 7.Ishitani R., Nureki O., Nameki N., Okada N., Nishimura S., Yokoyama S. Alternative tertiary structure of tRNA for recognition by a posttranscriptional modification enzyme. Cell. 2003;113:383–394. doi: 10.1016/s0092-8674(03)00280-0. [DOI] [PubMed] [Google Scholar]
- 8.Anantharaman V., Koonin E., Aravind L. Comparative genomics and evolution of proteins involved in RNA metabolism. Nucleic Acids Res. 2002;30:1427–1464. doi: 10.1093/nar/30.7.1427. [DOI] [PMC free article] [PubMed] [Google Scholar]
- 9.Ahn H., Kim H., Yoon H., Lee B., Suh S., Yang J. Crystal structure of tRNA(m1G37)methyltransferase: insights into tRNA recognition. EMBO J. 2003;22:2593–2603. doi: 10.1093/emboj/cdg269. [DOI] [PMC free article] [PubMed] [Google Scholar]
- 10.Nureki O., Watanabe K., Fukai S., Ishii R., Endo Y., Hori H., Yokohama S. Deep knot structure for construction of active site and cofactor binding site of tRNA modification enzyme. Structure. 2004;12:593–602. doi: 10.1016/j.str.2004.03.003. [DOI] [PubMed] [Google Scholar]
- 11.De Bie L.G.S., Roovers M., Oudjama Y., Wattiez R., Tricot C., Stalon V., Droogmans L., Bujnicki J.M. The yggH gene of Escherichia coli encodes a tRNA (m7G46) methyltransferase. J. Bacteriol. 2003;185:3238–3243. doi: 10.1128/JB.185.10.3238-3243.2003. [DOI] [PMC free article] [PubMed] [Google Scholar]
- 12.Alexandrov A., Grayhack E.J., Phizicky E.M. tRNA m7G methyltransferase Trm8p/Trm82p: evidence linking activity to a growth phenotype and implicating Trm82p in maintaining levels of active Trm8p. RNA. 2005;11:821–830. doi: 10.1261/rna.2030705. [DOI] [PMC free article] [PubMed] [Google Scholar]
- 13.Doublié S. Preparation of selenomethionyl proteins for phase determination. Methods Enzymol. 1997;276:523–530. [PubMed] [Google Scholar]
- 14.Droogmans L., Roovers M., Bujnicki J.M., Tricot C., Hartsch T., Stalon V., Grosjean H. Cloning and characterization of tRNA (m1A58) methyltransferase (TrmI) from Thermus thermophilus HB27, a protein required for cell growth at extreme temperatures. Nucleic Acids Res. 2003;31:2148–2156. doi: 10.1093/nar/gkg314. [DOI] [PMC free article] [PubMed] [Google Scholar]
- 15.Kunst F., Ogasawara N., Moszer I., Albertini A.M., Alloni G., Azevedo V., Bertero M.G., Bessieres P., Bolotin A., Borchert S., et al. The complete genome sequence of the Gram-positive bacterium Bacillus subtilis. Nature. 1997;390:249–256. doi: 10.1038/36786. [DOI] [PubMed] [Google Scholar]
- 16.Vagner V., Dervyn E., Ehrlich S.D. A vector for systematic gene inactivation in Bacillus subtilis. Microbiology. 1998;144:3097–3104. doi: 10.1099/00221287-144-11-3097. [DOI] [PubMed] [Google Scholar]
- 17.Roth M., Carpentier P., Kaikati O., Joly J., Charrault P., Pirocchi M., Kahn R., Fanchon E., Jacquamet L., Borel F., et al. FIP: a highly automated beamline for multiwavelength anomalous diffraction experiments. Acta Crystallogr. 2002;D58:805–814. doi: 10.1107/s0907444902003943. [DOI] [PubMed] [Google Scholar]
- 18.Otwinowski Z., Minor W. Processing of X-ray diffraction data collected in oscillation mode. Methods Enzymol. 1997;276:307–326. doi: 10.1016/S0076-6879(97)76066-X. [DOI] [PubMed] [Google Scholar]
- 19.Bailey S. The Ccp4 suite—programs for protein crystallography. Acta Crystallogr. 1994;D50:760–763. doi: 10.1107/S0907444994003112. [DOI] [PubMed] [Google Scholar]
- 20.Terwilliger T.C., Berendzen J. Automated MAD and MIR structure solution. Acta Crystallogr. 1999;D55:849–861. doi: 10.1107/S0907444999000839. [DOI] [PMC free article] [PubMed] [Google Scholar]
- 21.Terwilliger T.C. Improving macromolecular atomic models at moderate resolution by automated iterative model building, statistical density modification and refinement. Acta Crystallogr. 2003;D59:1174–1182. doi: 10.1107/S0907444903009922. [DOI] [PMC free article] [PubMed] [Google Scholar]
- 22.Brunger A.T., Adams P.D., Clore G.M., Delano W.L., Gros P., Grosse-Kunstleve R.W., Jiang J.S., Kuszewski J., Nilges M., Pannu N.S., et al. Crystallography & NMR system: a new software suite for macromolecular structure determination. Acta Crystallogr. 1998;D54:905–921. doi: 10.1107/s0907444998003254. [DOI] [PubMed] [Google Scholar]
- 23.Harding M.M. Metal-ligand geometry relevant to proteins and in proteins: sodium and potassium. Acta Crystallogr. 2002;D58:872–874. doi: 10.1107/s0907444902003712. [DOI] [PubMed] [Google Scholar]
- 24.Purta E., van Vliet F., Tricot C., De Bie L.G.S., Feder M., Skowronek K., Droogmans L., Bujnicki J.M. Sequence-structure-function relationships of a tRNA (m7G46) methyltransferase studied by homology modeling and site-directed mutagenesis. Proteins. 2005;59:482–488. doi: 10.1002/prot.20454. [DOI] [PubMed] [Google Scholar]
- 25.Holm L., Sander C. Dali—a network tool for protein-structure comparison. Trends Biochem. Sci. 1995;20:478–480. doi: 10.1016/s0968-0004(00)89105-7. [DOI] [PubMed] [Google Scholar]
- 26.Schulman-Peleg A., Mintz S., Nussinov R., Wolfson H.J. Protein–protein interfaces: recognition of similar spacial and chemical organizations algorithms. In: Jonassen J., Kim J., editors. Proceedings of the Fourth International Workshop on Bioinformatics (WABI 2004); Bergen, Norway. Springer Verlag; 2005. pp. 194–205. [Google Scholar]
- 27.Jones S., Thornton J.M. Principles of protein–protein interactions. Proc. Natl Acad. Sci. USA. 1996;93:13–20. doi: 10.1073/pnas.93.1.13. [DOI] [PMC free article] [PubMed] [Google Scholar]
- 28.Bahadur R.P., Chakrabarti P., Rodier F., Janin J. A dissection of specific and non-specific protein–protein interfaces. J. Mol. Biol. 2004;336:943–955. doi: 10.1016/j.jmb.2003.12.073. [DOI] [PubMed] [Google Scholar]
- 29.Glaser F., Pupko T., Paz I., Bell R.E., Bechor-Shental D., Martz E., Ben Tal N. ConSurf: identification of functional regions in proteins by surface-mapping of phylogenetic information. Bioinformatics. 2003;19:163–164. doi: 10.1093/bioinformatics/19.1.163. [DOI] [PubMed] [Google Scholar]
- 30.Valdar W.S.J., Thornton J.M. Protein–protein interfaces: analysis of amino acid conservation in homodimers. Proteins. 2001;42:108–124. [PubMed] [Google Scholar]
- 31.Jain A.N. Surflex: fully automatic flexible molecular docking using a molecular similarity-based search engine. J. Med. Chem. 2003;46:499–511. doi: 10.1021/jm020406h. [DOI] [PubMed] [Google Scholar]
- 32.Katchalski-Katzir E., Shariv I., Eisenstein M., Friesem A.A., Aflalo C., Vakser I.A. Molecular surface recognition: determination of geometric fit between proteins and their ligands by correlation techniques. Proc. Natl Acad. Sci. USA. 1992;89:2195–2199. doi: 10.1073/pnas.89.6.2195. [DOI] [PMC free article] [PubMed] [Google Scholar]
- 33.Case D.A., Darden T.A., Cheatham T.E., III, Simmerling C.L., Wang J., Duke R.E., Luo R., Merz K.M., Wang B., Pearlman D.A., et al. San Francisco: University of California; 2004. AMBER 8. [Google Scholar]
- 34.Schubert H.L., Blumenthal R.M., Cheng X. Many paths to methyltransfer: a chronicle of convergence. Trends Biochem. Sci. 2003;28:329–335. doi: 10.1016/S0968-0004(03)00090-2. [DOI] [PMC free article] [PubMed] [Google Scholar]
- 35.Bujnicki J.M. Comparison of protein structures reveals monophyletic origin of the AdoMet-dependent methyltransferase family and mechanistic convergence rather than recent differentiation of N4-cytosine and N6-adenine DNA methylation. In silico Biol. 1999;1:175–182. [PubMed] [Google Scholar]
- 36.Mintseris J., Weng Z.P. Structure, function, and evolution of transient and obligate protein-protein interactions. Proc. Natl Acad. Sci. USA. 2005;102:10930–10935. doi: 10.1073/pnas.0502667102. [DOI] [PMC free article] [PubMed] [Google Scholar]
- 37.Goedecke K., Pignot M., Goody R.S., Scheidig A.J., Weinhold E. Structure of the N6-adenine DNA methyltransferase M.Taq1 in complex with DNA and a cofactor analog. Nature Struct. Biol. 2001;8:121–125. doi: 10.1038/84104. [DOI] [PubMed] [Google Scholar]
- 38.Grishin N.V. Fold change in evolution of protein structures. J. Struct. Biol. 2001;134:167–185. doi: 10.1006/jsbi.2001.4335. [DOI] [PubMed] [Google Scholar]
- 39.Phizicky E.M., Martzen M.R., McCraith S.M., Spinelli S.L., Xing F., Shull N.P., Van Slyke C., Montagne R.K., Torres F.M., Fields S., et al. Biochemical genomics approach to map activities to genes. Methods Enzymol. 2002;350:546–559. doi: 10.1016/s0076-6879(02)50984-8. [DOI] [PubMed] [Google Scholar]
- 40.Bheemanaik S., Chandrashekaran S., Nagaraja V., Rao D.N. Kinetic and catalytic properties of dimeric KpnI DNA methyltransferase. J. Biol. Chem. 2003;278:7863–7874. doi: 10.1074/jbc.M211458200. [DOI] [PubMed] [Google Scholar]
- 41.Dong A.P., Zhou L., Zhang X., Stickel S., Roberts R.J., Cheng X.D. Structure of the Q237W mutant of HhaI DNA methyltransferase: an insight into protein-protein interactions. Biol. Chem. 2004;385:373–379. doi: 10.1515/BC.2004.041. [DOI] [PMC free article] [PubMed] [Google Scholar]
- 42.Grosjean H., Keith G., Droogmans L. Detection and quantification of modified nucleotides in RNA using thin-layer chromatography. Methods Mol. Biol. 2004;265:357–391. doi: 10.1385/1-59259-775-0:357. [DOI] [PubMed] [Google Scholar]
- 43.Bahadur R.P., Chakrabarti P., Rodier F., Janin J. Dissecting subunit interfaces in homodimeric proteins. Proteins. 2003;53:708–719. doi: 10.1002/prot.10461. [DOI] [PubMed] [Google Scholar]
Associated Data
This section collects any data citations, data availability statements, or supplementary materials included in this article.


