

Abstract
The syntheses, properties, and biological applications of the Peroxysensor family, a new class of fluorescent probes for hydrogen peroxide, are presented. These reagents utilize a boronate deprotection mechanism to provide high selectivity and optical dynamic range for detecting H2O2 in aqueous solution over similar reactive oxygen species (ROS) including superoxide, nitric oxide, tert-butyl hydroperoxide, hypochlorite, singlet oxygen, ozone, and hydroxyl radical. Peroxyresorufin-1 (PR1), Peroxyfluor-1 (PF1), and Peroxyxanthone-1 (PX1) are first-generation probes that respond to H2O2 by an increase in red, green, and blue fluorescence, respectively. The boronate dyes are cell-permeable and can detect micromolar changes in H2O2 concentrations in living cells, including hippocampal neurons, using confocal microscopy and two-photon microscopy. The unique combination of ROS selectivity, membrane permeability, and a range of available excitation/emission colors establishes the potential value of PR1, PF1, PX1, and related probes for interrogating the physiology and pathology of cellular H2O2.
Introduction
Many diseases associated with human aging, including cancer,1 cardiovascular disorders,2 and neurodegenerative diseases,3,4 have a strong oxidative stress component, but the basic molecular mechanisms that connect aging, age-related diseases, and oxidative stress remain insufficiently understood.5-7 Oxidative stress is the result of unregulated production of reactive oxygen species (ROS), and cellular mismanagement of oxidation-reduction chemistry can trigger subsequent oxidative damage to tissue and organs.8 In particular, hydrogen peroxide is a major ROS byproduct in living organisms and a common marker for oxidative stress.5,6,8 The chemical biology of H2O2 is much more complex, however, as mounting evidence also supports a role for H2O2 as a second messenger in normal cellular signal transduction.9-12 Peroxide bursts in response to cell receptor stimulation can affect several classes of essential signaling proteins that control cell proliferation and/or cell death. Included are kinases such as the mitogen-activated protein (MAP) kinase family,13 transcription factors such as nuclear factor κB (NF-κB)14 and activating protein 1 (AP-1),15 as well as various protein tyrosine phosphatases (PTPs),16-18 ion channels,19,20 and G proteins.9 Despite the far-ranging consequences of H2O2 in human physiology and pathology, mechanistic details surrounding intracellular H2O2 generation, trafficking, and function remain elusive even in the simplest eukaryotic organisms.12,21
Fluorescent probes are well suited to meet the need for tools to map the spatial and temporal distribution of H2O2 within living cells. Such reagents have revolutionized the study of calcium in biological systems22 and hold much promise for enhancing our understanding of H2O2 physiology and pathology. The major challenge for practical H2O2 sensing in biological environments is creating water-soluble systems that respond to H2O2 selectively over competing cellular ROS such as superoxide (O2−), nitric oxide (NO), and lipid peroxides. Several types of small-molecule reporters have been described for H2O2 detection. Included are dihydro derivatives of common fluorescent dyes (e.g., 2′,7′-dichlorodihydrofluorescein, DCFH, and dihydrorhodamine 123, DHR),23-26 the Amplex Red/peroxidase system,27 phosphine-containing fluorophores,28-31 luminescent lanthanide complexes,32,33 and chromophores with ROS-cleavable protecting groups.34-36 Limitations of these and other currently available H2O2-responsive probes include interfering background fluorescence from competing ROS, potential side reactions with thiols that are present in high concentrations within cells, the need for external activating enzyme, lack of membrane permeability, and/or lack of water solubility or compatibility, requiring the use of organic cosolvents.
In an effort to help elucidate the complex roles of H2O2 in living systems, we have initiated a program to provide selective and sensitive fluorescent chemosensors for H2O2 with properties amenable to biological imaging applications. We recently described the preparation and preliminary characterization of Peroxyfluor-1 (PF1), a new type of cell-permeable probe for H2O2.37 Owing to its unique detection mechanism, which relies on chemoselective boronate deprotection rather than nonspecific oxidation to provide an optical response, PF1 exhibits unprecedented selectivity for H2O2 over other ROS. Initial experiments also establish that PF1 can be loaded passively into living cells and report changes in intracellular H2O2 concentrations. In this paper, we now show that boronate deprotection offers a general strategy for providing selective fluorescent probes for H2O2 in cellular environments and present the synthesis and characterization of a family of cell-permeable boronate-based probes for H2O2 detection. The resulting Peroxysensor platforms feature excellent selectivity for H2O2 over competing ROS in aqueous solution and excitation/emission profiles that span the ultraviolet to visible region. Moreover, these probes are capable of imaging micromolar changes in H2O2 concentrations in living cells, including hippocampal neurons from primary culture, using confocal microscopy and two-photon microscopy. Our results establish the value of the Peroxysensor family for imaging H2O2 in living biological samples and provide a basis for further development of fluorescent probes to interrogate the physiology and pathology of H2O2 and related ROS in living cells and tissue.
Results and Discussion
Design and Synthesis of Red-, Green-, and Blue-Fluorescent Probes for Hydrogen Peroxide
Our general strategy for the fluorescence detection of H2O2 in biological environments is based on the chemoselective H2O2-mediated deprotection of arylboronates to phenols.38,39 Initial efforts focused on developing H2O2-responsive probes using fluorescein as a fluorescent reporting group owing to its biological compatibility, near-unity quantum yield, and sizable extinction coefficient.40 Additionally, its visible excitation and emission profiles limit photodamage to biological samples, avoid autofluorescence from native cellular species, and offer compatibility with common optical filter sets for fluorescence microscopy. We reasoned that installation of boronic ester groups at the 3′ and 6′ positions of a xanthenone scaffold would force this platform to adopt a closed, colorless, and nonfluorescent lactone form. Hydrolytic deprotection of the boronates with H2O2 would subsequently produce the open, colored, and fluorescent fluorescein product. Peroxyfluor-1 (PF1, 1, Scheme 1) represents a first-generation, green-fluorescent probe based on this design.37
Scheme 1.

Peroxyfluor-1 (PF1)
We sought to expand this singular example to provide a family of xanthene-based probes with varying excitation and emission profiles that report H2O2 by chemoselective boronate deprotection. Red-emitting fluorophores are particularly useful for fluorescence microscopy because cellular absorbance, scattering, and autofluorescence decrease greatly at lower energy wavelengths. Scheme 2 outlines the syntheses of Peroxyresorufin-1 (PR1, 3) and Peroxyxanthone-1 (PX1, 6) dyes that respond to H2O2 by an increase of red and blue fluorescence, respectively. Direct bromination of phenoxazine with hydrobromic acid and sodium nitrite affords 3,7-dibromophenoxazine 2 in 10% yield after isolation from various other brominated products. Palladium-catalyzed transmetalation of dibromide 2 with bis(pinacolato)diboron under Miyaura conditions41 proceeds smoothly to generate PR1 in 69% yield after workup and purifcation by flash column chromatography. Reaction of 3,6-dihydroxyxanthone (4)42 with N-phenyl bis(trifluoromethanesulfonamide) in dichloromethane furnishes 3,6-bis(trifluoromethanesulfonate)-xanthone 5 in 85% yield. Palladium-catalyzed transmetalation of bis-triflate 5 with bis(pinacolato)diboron delivers PX1 in 51% yield. Taken together, PR1, PF1, and PX1 represent a unique homologous series of red-, green-, and blue-fluorescent probes for H2O2, respectively, that operate by a boronate deprotection mechanism.
Scheme 2.

Syntheses of Peroxyresorufin-1 (PR1) and Peroxyxanthone-1 (PX1)
Spectroscopic Properties and Optical Responses to H2O2
The Peroxysensor reagents were evaluated under simulated physiological conditions (20 mM HEPES buffer, pH 7). As expected, PF1 and PR1 are nonfluorescent and display no absorption features in the visible region. PX1 has an ultraviolet absorption maximum centered at 350 nm (ε = 4.7 × 10³ M−1 cm−1) and exhibits weak fluorescence with an emission maximum at 400 nm. The addition of H2O2 triggers prompt increases in fluorescence for all three probes. Figures 1, 2, and 3 show the fluorescence responses of PF1, PR1, and PX1, respectively, to H2O2 after 30 min. For PF1 and PR1, the fluorescence increases induced by H2O2 occur with concomitant growth of visible wavelength absorption bands characteristic of green-fluorescent fluorescein40 and red-fluorescent resorufin,43 respectively. Absorption and emission spectra, along with electrospray ionization mass spectrometry, establish that fluorescein is the product generated from the reaction between PF1 and H2O2 (Figure 1, Scheme 1) and resorufin is the product afforded from the reaction between PR1 and H2O2 (Figure 2, Scheme 2). Analogous experiments with PX1 show that its reaction with H2O2 produces blue-fluorescent 3,6-dihydroxyxanthone, with a 52-fold increase in integrated fluorescence intensity and a concomitant shift in emission maximum from 400 to 450 nm (Figure 3, Scheme 2). The dynamic ranges of PF1 and PR1 are even larger (>1000-fold increase in integrated emission), owing to their binary absorption/emission response. These values represent a 5- to 500-fold improvement in H2O2 dynamic range compared to previously reported probes. For comparison, H2O2 probes based on sulfonate deprotection have a dynamic range of up to 2.5,34 lanthanide complexes display increases of up to 15-fold upon H2O2 addition,32 and phosphine-containing fluorophores for nonspecific detection of hydroperoxides in water show an on–off ratio of up to 78 (higher values are obtained in 1:1 organic:aqueous solution).30 Dihydro derivatives of fluorescein and rhodamine dyes show comparable dynamic ranges to the Peroxysensor family in response to H2O2, but are not nearly as selective for H2O2 over other ROS (vide infra).24,36 For example, DCFH shows a 190-fold increase upon addition of H2O2 but increases by ca. 7000-fold by reaction with •OH or peroxynitrite (ONOO−), 150-fold with NO, 67-fold with O2−, and 2000-fold upon light-induced autoxidation.
Figure 1.

Fluorescence response of 5 μM PF1 to 100 μM H2O2 after 30 min. The dashed and solid line spectra were recorded before and after H2O2 addition, respectively. Spectra were acquired in 20 mM HEPES, pH 7 (λexc = 450 nm).
Figure 2.

Fluorescence response of 5 μM PR1 to 100 μM H2O2 after 30 min. The dashed and solid line spectra were recorded before and after H2O2 addition, respectively. Spectra were acquired in 20 mM HEPES, pH 7 (λexc = 530 nm).
Figure 3.

Fluorescence response of 20 μM PX1 to 100 μM H2O2 after 30 min. The dashed and solid line spectra were recorded before and after H2O2 addition, respectively. Spectra were acquired in 20 mM HEPES, pH 7 (λexc = 350 nm).
The fluorescence responses of the Peroxysensor platforms are highly H2O2 selective. Figures 4, 5, and 6 compare the relative reactivities of boronate-based PF1, PR1, and PX1, respectively, toward various ROS. Selectivity data are displayed at several time points over a period of 60 min. As shown in Figure 4, PF1 exhibits a >500-fold higher response for H2O2 over similar ROS such as superoxide (O2−), tert-butyl hydroperoxide (TBHP), or hypochlorite ion (−OCl). The xanthenone probe is also >500-fold more responsive to H2O2 than S-nitrosocysteine (SNOC), an NO+ donor in vitro, and >6-fold more responsive to H2O2 over nitric oxide gas (NO). PF1 is >100-fold more selective for H2O2 over singlet oxygen (1O2) and ozone (O3), and the green-fluorescent reagent also displays good selectivity for H2O2 over highly oxidizing ROS such as hydroxyl radical (•OH) and tert-butoxy radical (•OtBu). PR1 is >1000 times more responsive to H2O2 than O2− and shows a >200-fold higher response for H2O2 over NO, NO+, O3, and reactive radicals •OH and •OtBu (Figure 5). This red-fluorescent reagent is also >25-fold more selective for H2O2 over either TBHP or −OCl, and >15-fold more selective for H2O2 over 1O2. PX1 also shows notable discrimination for H2O2 over other ROS (Figure 6). This blue-fluorescent reporter shows a >500-fold higher response for H2O2 over O2− and the oxygen radicals •OH and •OtBu and is >100-fold more reactive toward H2O2 over TBHP or O3. PX1 is also >60-fold more responsive to H2O2 than 1O2, >25-fold more selective for H2O2 over −OCl and NO gas, and ca. 6-fold more responsive to H2O2 over NO+. The values measured for the Peroxysensor platforms represent a 10- to 100-fold improvement in H2O2 selectivity compared to previously reported probes,24,34-36 establishing that chemoselective boronate deprotection provides a general and effective mechanism for detecting H2O2 selectively over other more oxidizing ROS.
Figure 4.
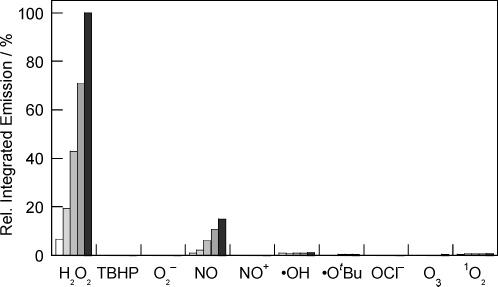
Fluorescence responses of 5 μM PF1 to various reactive oxygen species (ROS). Data shown are for 10 mM for O2−, 2mM for 1O2, and 100 μM for all other ROS. Hydrogen peroxide (H2O2), tert-butyl hydroperoxide (TBHP), and hypochlorite (OCl−) were delivered from 30%, 70%, and 5% aqueous solutions, respectively. Superoxide (O2−) was added as solid KO2. Hydroxyl radical (•OH) and tert-butoxy radical (•OtBu) were generated by reaction of 1 mM Fe2+ with 100 μM H2O2 or 100 μM TBHP, respectively. Nitric oxide (NO) was added using NO gas, and NO+ was delivered using S-nitrosocysteine (SNOC). Ozone (O3) was generated by photolysis of O2. Singlet oxygen (1O2) was generated by photolysis of Sensitox II (polymer-supported Rose Bengal). Concentrations given for highly reactive ROS including •OH, •OtBu, and 1O2 are cumulative. Spectra were acquired in 20 mM HEPES, pH 7, and all data were obtained after incubation with the appropriate ROS at 25 °C. Collected emission was integrated between 460 and 700 nm (λexc ) 450 nm), and bars represent relative responses at 5 (white), 15 (light gray), 30 (gray), 45 (dark gray), and 60 min (black) after addition of the appropriate ROS.
Figure 5.
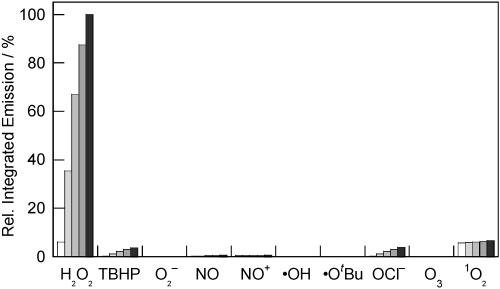
Fluorescence responses of 5 μM PR1 to various reactive oxygen species (ROS). Data shown are for 10 mM for O2−, 2 mM for 1O2, and 100 μM for all other ROS. ROS were delivered as described in the caption to Figure 4. Spectra were acquired in 20 mM HEPES, pH 7, and all data were obtained after incubation with the appropriate ROS at 25 °C. Collected emission was integrated between 570 and 800 nm (λexc = 560 nm), and bars represent relative responses at 5 (white), 15 (light gray), 30 (gray), 45 (dark gray), and 60 min (black) after addition of the appropriate ROS.
Figure 6.
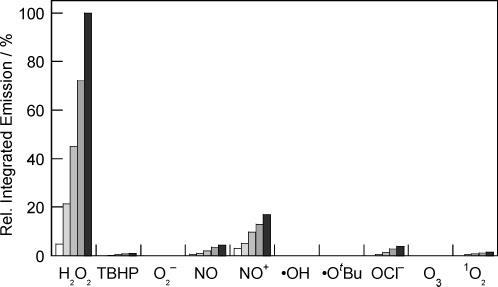
Fluorescence responses of 5μM PX1 to various reactive oxygen species (ROS). Data shown are for 10 mM for O2−, 2 mM for 1O2, and 100 μM for all other ROS. ROS were delivered as described in the caption to Figure 4. Spectra were acquired in 20 mM HEPES, pH 7, and all data were obtained after incubation with the appropriate ROS at 25 °C. Collected emission was integrated between 370 and 600 nm (λexc = 350 nm), and bars represent relative responses at 5 (white), 15 (light gray), 30 (gray), 45 (dark gray), and 60 min (black) after addition of the appropriate ROS.
The fluorescence responses of the Peroxysensor reagents were characterized over a wide range of H2O2 concentrations. Figure 7 displays a calibration plot for PF1 that shows a linear correlation between initial H2O2 concentrations added and observed fluorescence responses after 15 min. Deprotections of PF1 are kinetically controlled and are not complete at this time point, affording an expanded concentration range of H2O2 detection with a substoichiometric amount of dye. For example, the data in Figure 7 show a linear fluorescence response over a H2O2 concentration range of 0–50 μM with 5 μM dye. Similar data are obtained using PR1 and PX1. Under these conditions, all three boronate probes can reliably detect down to 100–200 nM H2O2 in aqueous solution. Finally, time-course kinetics measurements of the fluorescence responses of PF1, PR1, and PX1 to H2O2 were performed. Pseudo-first-order conditions were employed (1 μM dye, 1 mM H2O2). Figure 8 displays a representative kinetics plot for PF1. Observed rate constants for H2O2-mediated deprotection of PF1, PR1, and PX1 are kobs = 5.4 (1) × 10−4 s−1, kobs = 1.0 (1) × 10−3 s−1, and kobs = 6.1 (1) × 10−44 s−1, respectively.
Figure 7.

Fluorescence responses of 5μM PF1 to various concentrations of added H2O2. Data were collected after incubation of PF1 with H2O2 at 25 °C for 15 min. Deprotections of PF1 with H2O2 are not complete at this time point, affording an expanded concentration range of detection with a linear fluorescence response. Spectra were acquired in 20 mM HEPES, pH 7. Collected emission was integrated between 460 and 700 nm (λexc = 450 nm).
Figure 8.

Time-course kinetic measurement of the fluorescence response of PF1 to H2O2. Data were collected under under pseudo-first-order conditions (1 μM PF1, 1 mM H2O2). Spectra were acquired in 20 mM HEPES, pH 7, at 25 °C. Collected emission was integrated between 460 and 700 nm (λexc = 450 nm).
Fluorescence Detection of H2O2 in Living Cells using Confocal Microscopy and Two-Photon Microscopy
With a solid understanding of the spectroscopic properties and H2O2-specific fluorescence responses of the Peroxysensor platforms in hand, we sought to apply this family of red-, green-, and blue-fluorescent reagents for the optical detection of H2O2 in living biological samples. Initial imaging studies demonstrate the ability of PF1 to respond to changes in H2O2 concentrations within living mammalian cells in culture. Incubation of HEK cells with 5 μM PF1 for 5 min at 25 °C results in negligible intracellular background fluorescence from the uncaged dye, as determined from scanning confocal microscopy measurements on live samples with one-photon excitation at 488 nm (Figure 9a). Upon addition of physiologically relevant concentrations of H2O2 to the PF1-loaded cells (10–100 μM, Figure 9b), prompt increases in intracellular green fluorescence are observed. Control experiments performed without dye or H2O2 give no fluorescence responses over background. In addition, washing cells between PF1 loading and H2O2 stimulation results in a similar observed fluorescence intensity of intracellular staining compared to no washing between PF1 and H2O2 additions, and the deprotected product fluorescein is not membrane-permeable under these conditions. Moreover, bright-field transmission measurements (not shown) after PF1 incubation and H2O2 treatment confirm that the cells are viable throughout the imaging experiments. The foregoing experiments establish that PF1 can passively enter live cells and monitor changes in intracellular H2O2 concentrations.
Figure 9.
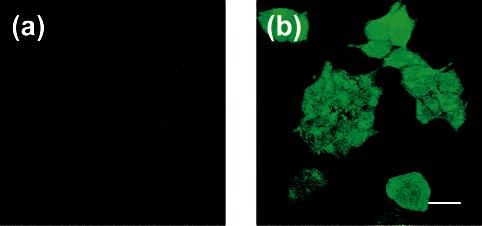
Confocal fluorescence images of live HEK cells. (a) Fluorescence image of HEK cells incubated with 5 μM PF1 for 5 min at 25 °C. (b) Fluorescence image of PF1-stained HEK cells treated with 100 μM H2O2 for 11 min at 25 °C. Excitation was provided at 488 nm, and emission was collected in a window from 505 to 580 nm. Scale bar = 27 μm.
An analogous set of experiments reveals that PR1 provides a useful red-fluorescent complement to PF1 for imaging H2O2 in biological samples. Live HEK cells incubated with 10 μM PR1 for 10 min at 25 °C show virtually no background fluorescence from the boronate-protected probe upon scanning with one-photon excitation at 543 nm (Figure 10a). Striking increases in intracellular red fluorescence are observed upon treatment of the PR1-loaded cells with 100 μM H2O2 (Figure 10b). Control experiments with cells excluding probe or H2O2 addition give negligible fluorescence responses, and the cells are viable throughout the experiments. The results show that PR1 is membrane-permeable and can respond to changes in intracellular H2O2 concentrations.
Figure 10.
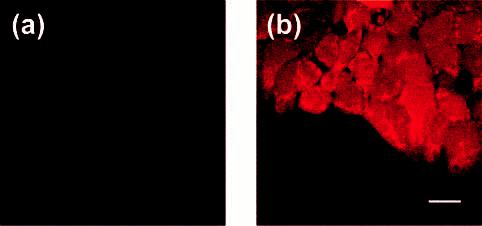
Confocal fluorescence images of live HEK cells. (a) Fluorescence image of HEK cells incubated with 10 μM PR1 for 10 min at 25 °C. (b) Fluorescence image of PR1-stained HEK cells treated with 100 μM H2O2 for 30 min at 25 °C. Excitation was provided at 543 nm, and emission was collected in a window from 548 to 644 nm. Scale bar = 18 μm.
We sought to explore alternative methods for applying the blue-fluorescent PX1 reporter toward intracellular H2O2 detection, reasoning that its short ultraviolet excitation maximum (∼350 nm) would promote interfering absorbance, scattering, and background autofluorescence from native cellular species. In this regard, two-photon microscopy is a technique that has facilitated the investigation of living systems with fluorescent reporters.44-46 Whereas one-photon fluorescence microscopy uses a single photon to excite a fluorophore into its excited state, two-photon fluorescence microscopy uses two photons of lower energy light to generate a fluorophore excited state. Advantages of two-photon excitation include reduced photodamage to living biological samples and fluorophore, minimized background absorption and scattering, improved spatial resolution and sensitivity, and the ability to image thicker specimens. We performed a series of experiments to evaluate the utility of PX1 for intracellular H2O2 imaging using two-photon microscopy. Incubation of live HEK cells with 10 μM PX1 for 2–3 min at 25 °C gave minimal intracellular background fluorescence as determined from scanning two-photon microscopy measurements with 704-nm excitation (Figure 11a). Control cells without probe give the same fluorescence response, establishing that the observed background signal is from endogenous cellular species. Prompt increases in intracellular blue fluorescence are observed upon the addition of 100 μM concentrations of exogenous H2O2 to the PX1-stained cells (Figure 11b). Control experiments carried out without fluorophore or H2O2 do not show any fluorescence enhancements. These data establish that PX1 undergoes effective two-photon excitation and is capable of imaging changes in intracellular H2O2 concentrations within living cells using two-photon microscopy.
Figure 11.
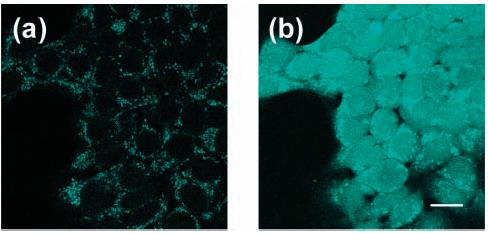
Two-photon fluorescence images of live HEK cells. (a) Fluorescence image of HEK cells incubated with 10 μM PX1 for 2–3 min at 25 °C. (b) Fluorescence image of PX1-stained HEK cells treated with 100 μM H2O2 for 30 min at 25 °C. Two-photon excitation was provided at 704 nm, and emission was collected in a window from 420 to 500 nm. Scale bar = 18 μm.
Finally, the successful use of the Peroxysensor probes for monitoring changes in intracellular H2O2 concentrations in mammalian cell lines using either confocal or two-photon microscopy led us to evaluate their utility in primary culture systems. Cultured embryonic rat hippocampal neurons (E18) were incubated with 10 μM PF1 for 5 min at 25 °C and show negligible background fluorescence (Figure 12a) due to the unreacted probe. Placing these PF1-loaded neurons under simulated conditions of oxidative stress (300 μM H2O2 for 30 min at 25 °C) triggers notable increases in intracellular fluorescence (Figure 12b). Control neurons without PF1 and/or H2O2 treatment show no detectable fluorescence enhancements. These experiments confirm that PF1 can be used in living neurons to detect oxidative stress events.
Figure 12.
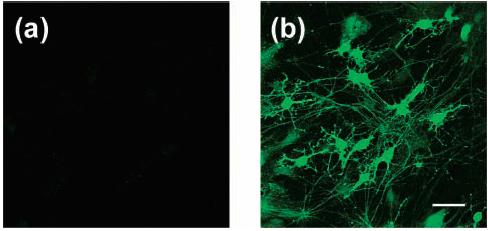
Confocal fluorescence images of live rat hippocampal neurons. (a) Fluorescence image of neurons incubated with 10 μM PF1 for 5 min at 25 °C. (b) Fluorescence image of PF1-stained neurons treated with 300 μM H2O2 for 30 min at 25 °C. Excitation was provided at 488 nm, and emission was collected in a window from 505 to 580 nm. Scale bar = 50 μm.
Concluding Remarks
We have described the synthesis, properties, and biological applications of the Peroxysensor family, a new class of boronate-based fluorescent probes for imaging H2O2 in biological environments. Boronate deprotection provides a general, chemoselective strategy for developing fluorescent reporters with unprecedented selectivity for H2O2 over competing cellular ROS; red-fluorescent PR1, green-fluorescent PF1, and blue-fluorescent PX1 afford a homologous series of reagents with excitation and emission profiles spanning the ultraviolet through visible region. The Peroxysensor probes feature excellent dynamic response ranges and submicromolar detection limits for H2O2. PF1 and PR1 show particularly large fluorescence enhancements upon H2O2 recognition (>1000-fold) owing to their binary absorption/emission responses. Furthermore, we have demonstrated the utility of the Peroxysensor probes for biological imaging applications. The boronate dyes are all membrane-permeable and can be used to measure micromolar changes in intracellular H2O2 concentrations in living cells using confocal microscopy and two-photon fluorescence microscopy, as well as nanomolar concentrations of H2O2 in vitro. In this regard, the relevant global and local concentrations of H2O2 in cellular environments are a subject of much interest and range greatly under physiological and pathological conditions. For example, exposure of cells to low concentrations of H2O2 (<50 μM) lead to apoptosis, whereas higher concentrations can lead to necrosis.47 In contrast, estimates of extracellular H2O2 generated during normal signaling are in the range of 2– 8μM, giving intracellular concentrations of 0.001–0.7 μM.11 Such estimated values remain insufficiently defined, however, and direct measurement of H2O2 concentrations using cell-compatible fluorescent probes and related chemical tools is an important future avenue of study. Finally, PF1 is also capable of detecting peroxide-triggered oxidative stress in living hippocampal neurons, showing the value of these reagents in primary cultures. Taken together, these findings establish boronate deprotection as an effective chemical approach for probing H2O2 in living biological systems. Ongoing efforts are focused on studying the physiology and pathology of H2O2 with the Peroxysensors and related probes, with particular interest in neural systems.
Experimental Section
Synthetic Materials and Methods
Silica gel 60 (230–400 mesh, Fisher) was used for column chromatography. Analytical thin layer chromatography was performed using Fisher 60 F254 silica gel (precoated sheets, 0.25 mm thick). Dichloro[1,1′-bis(diphenylphosphino)ferrocene]palladium(II), Pd(dppf)Cl2, and 1,1′-bis(diphenylphosphino)ferrocene, dppf, were purchased from Strem Chemicals (Newburyport, MA), anhydrous DMF and anhydrous 1,4-dioxane were purchased from Acros Organics (Morris Plains, NJ), and these reagents were used as received. All other chemicals were purchased from Sigma-Aldrich (St. Louis, MO) and were used as received. Tetrahydrofuran was dried and distilled over sodium/benzophenone using standard methods.48 3′,6′-Bis(pinacolatoboron)fluoran (Peroxyfluor-1, PF1, 1) was prepared as described previously,37 and 3,6-dihydroxyxanthone 4 was synthesized according to a literature method.42 1H NMR and 19F NMR spectra were collected in CDCl3, CD3OD, d6-DMSO, or d6-acetone (Cambridge Isotope Laboratories, Cambridge, MA) at 25 °C using either a Bruker AV-300, Bruker AVQ-400, or Bruker AVB-400 spectrometer at the College of Chemistry NMR Facility at the University of California, Berkeley. All chemical shifts are reported in the standard δ notation of parts per million. High-resolution mass spectral analyses were carried out at the College of Chemistry Mass Spectrometry Facility at the University of California, Berkeley.
3,7-Dibromophenoxazine (2)
Concentrated hydrobromic acid (48% in water, 30 mL) was added to a solution of phenoxazine (2.01 g, 11 mmol) in acetone (17.5 mL), and the resulting purple-colored reaction mixture was stirred at room temperature for 15 min. A saturated aqueous solution of sodium nitrite (2.02 g, 29 mmol) was added dropwise to the mixture over a period of 3 min, and the reaction was stirred at room temperature for an additional 15 min. The resulting precipitate was filtered off, washed with water (200 mL), and redissolved in hot acetone (200 mL). The acetone was removed by rotary evaporation to leave a dark purple residue, which was purified by flash column chromatography (silica gel, 3:1 hexanes/ethyl acetate) to afford dibromo 2 as a metallic blue solid (375 mg, 10% yield). 1H NMR (d6-acetone, 300 MHz): δ 6.90 (2H, dd, J1 = 8.1 Hz, J2 = 2.1 Hz), 6.79 (2H, s), 6.46 (2H, d, J = 8.4 Hz). HRFAB-MS: calculated for [M+] 338.889, found 338.889.
3,7-Bis(pinacolatoboron)phenoxazine (Peroxyresorufin-1, PR1, 3)
Dibromo 2 (202 mg, 0.59 mmol), bis(pinacolato) diboron (465 mg, 1.83 mmol), potassium acetate (362 mg, 3.68 mmol), and Pd(dppf)Cl2 (52 mg, 0.064 mmol) were dried in vacuo in a 50-mL Schlenk flask before adding anhydrous DMF (6 mL) by syringe. The reaction was heated at 80 °C for 2 h under nitrogen. After cooling to room temperature, the dark brown solution was added to 600 mL of ice water. The resulting light-brown precipitate was collected by filtration, redissolved in dichloromethane, and evaporated to dryness. Purification by flash column chromatography (silica gel, 5% methanol/dichloromethane) delivered diboronic ester 3 as a red-orange solid (178 mg, 69% yield). 1H NMR (d6-acetone, 300 MHz): δ 7.12 (2H, d, J = 6.3 Hz), 6.92 (2H, s), 6.49 (2H, d, J = 7.5 Hz), 1.30 (24H, s). HRFAB-MS: calculated for [M+] 435.238, found 435.238.
3,6-Bis(trifluoromethanesulfonyl)xanthone (5)
3,6-Dihydroxyxanthone42 (63 mg, 0.28 mmol) and N-phenyl bis(trifluoromethanesulfonamide) (200 mg, 0.56 mmol) were dissolved in 4 mL of anhydrous THF. N,N-Diisopropylethylamine (Hünig's base, 0.12 mL, 0.69 mmol) was added via syringe, and the resulting solution was stirred at room temperature overnight. The reaction was taken to dryness by rotary evaporation, and purification by flash column chromatography (silica gel, 5% methanol/dichloromethane) gave bis-triflate 5 as a white powder (116 mg, 85% yield). 1H NMR (CDCl3, 400 MHz): δ 8.44 (1H, d, J = 8.8 Hz), 7.49 (1H, s), 7.35 (1H, d, J = 8.8 Hz). 19F NMR (CDCl3, 376 MHz): δ −71.76 (s). HRFAB-MS: calculated for [MH+] 492.949, found 492.949.
3,6-Bis(pinacolatoboron)xanthone (Peroxyxanthone-1, PX1, 6)
In an inert atmosphere glovebox, bis-triflate 5 (200 mg, 0.41 mmol), bis(pinacolato)diboron (226 mg, 0.89 mmol), Pd(dppf)Cl2·CH2Cl2, (23 mg, 0.028 mmol), dppf (16 mg, 0.028 mmol), potassium acetate (120 mg, 1.22 mmol), and anhydrous 1,4-dioxane (6 mL) were combined in a 25-mL Schlenk flask. The vessel was removed from the glovebox and stirred at 100 °C for 12 h under nitrogen. The reaction was then cooled to room temperature, diluted with toluene, and washed three times with brine. The organic layer was dried over Na2SO4 and the solvent was removed by rotary evaporation to leave a brown residue. The residue was washed with methanol to furnish pure boronate 6 as a white powder (94 mg, 51% yield). 1H NMR (CDCl3, 300 MHz): δ 8.31 (1H, d, J = 7.8 Hz), 7.93 (1H, s), 7.16 (1H, d, J = 7.8 Hz). HRFAB-MS: calculated for [MH+] 449.231, found 449.232.
Spectroscopic Materials and Methods
Millipore water was used to prepare all aqueous solutions. All spectroscopic measurements were performed in 20 mM HEPES buffer, pH 7. Absorption spectra were recorded using a Varian Cary 50 spectrophotometer (Walnut Creek, CA). Fluorescence spectra were recorded using a Photon Technology International Quanta Master 4 L-format scanning spectrofluorometer (Lawrenceville, NJ) equipped with an LPS-220B 75-W xenon lamp and power supply, A-1010B lamp housing with integrated igniter, switchable 814 photon-counting/analog photomultiplier detection unit, and MD5020 motor driver. Samples for absorption and fluorescence measurements were contained in 1-cm × 1-cm quartz cuvettes (1.4- or 3.5-mL volume, Starna, Atascadero, CA).
Various reactive oxygen species (ROS) were administered to the PF1, PR1, and PX1 dyes as follows. Experiments employed 10 mM O2−, 2 mM for 1O2, and 100 μM for all other ROS. Superoxide (O2−) was added as solid KO2. Hydrogen peroxide (H2O2), tert-butyl hydroperoxide (TBHP), and hypochlorite (OCl−) were delivered from 30%, 70%, and 5% aqueous solutions, respectively. Hydroxyl radical (•OH) and tert-butoxy radical (•OtBu) were generated by reaction of 1 mM Fe2+ with 100 μM H2O2 or 100 μM TBHP, respectively. Nitric oxide (NO) was added using NO gas (Matheson), and NO+ was delivered using S-nitrosocysteine (SNOC).49 Ozone (O3) was generated by photolysis of O2 using a Welsbach Ozonator (Philadelphia, PA). Singlet oxygen (1O2) was generated by photolysis of Sensitox II (polymer-supported Rose Bengal).50 Briefly, 1 mg of Sensitox II was suspended in a 5 μM solution of dye in 20 mM HEPES, pH 7. The mixture was irradiated for 5 min at 25 °C with a 450 W mercury arc lamp powered by an Aceglass power supply. Production of 1O2 under these conditions was calibrated using a colorimetric histidine assay according to a literature protocol.51 Assuming that each molecule of 1O2 generated oxidizes one molecule of histidine, a lower limit of 2 mM 1O2 is produced within 5 min of irradiation. Caution: Reactive oxygen species such as singlet oxygen and ozone are highly oxidizing and should be handled with care.
Preparation and Staining of Cell Cultures
HEK 293T cells were cultured in Dulbecco's Modified Eagle Medium (DMEM, Invitrogen, Carlsbad, CA) supplemented with 10% fetal bovine serum (FBS, Invitrogen), glutamine (2 mM), and penicillin/streptomycin (50 μg/mL, Invitrogen). One day before imaging, cells were passed and plated on 18-mm glass coverslips coated with poly-l-lysine (50μg/mL, Sigma, St. Louis, MO). Immediately before the experiments, cells were washed with PBS buffer, incubated with the probe in PBS, and imaged.
Hippocampal primary cultures were prepared from embryonic day 18 (E18) rat embryos according to a previously reported protocol.52 Briefly, hippocampi were dissociated by treatment with trypsin for 20 min at 37 °C followed by washing. The neuronal cells were plated on glass coverslips (Carolina Biological, Burlington, NC) coated with poly-l-lysine (50 μg/mL, Sigma) and cultured in neurobasal medium supplemented with 2 mM Glutamax and 2% B-27 (Invitrogen). After 10 days in vitro, the cultures were washed with PBS, incubated with the probe in PBS, and imaged.
Fluorescence Imaging Experiments
Confocal fluorescence imaging was performed with a Zeiss LSM510 META laser scanning microscope containing an Axioplan 2 MOT upright microscope and a 40 × water-immersion objective lens. Excitation of PF1-loaded cells at 488 nm was carried out with an argon ion laser, and emission was collected in a window from 505 to 580 nm using a META detection system. Excitation of PR1-loaded cells at 543 nm was carried out with a HeNe laser, and emission was collected in a window from 548 to 644 nm using a META detector. PF1 or PR1 was incubated with live cell samples for 5–10 min. Addition of H2O2 (10-100 μM) to cell samples was performed directly on the microscope stage by bath application to the media.
Two-photon fluorescence imaging of PX1 was carried out using an inverted Zeiss LSM510 Axiovert 200M microscope with a NeoFLUAR 40×/1.3 NA oil-immersion objective lens. Samples were excited by 704-nm pulses from a mode-locked Ti:sapphire laser (Tsunami, SpectraPhysics, 120–150 fs pulse width, 80 MHz repetition rate). The emission light was filtered with a 80-nm-wide band-pass filter centered at 460 nm (460BP40, Chroma) and detected with the non-descanned detector (NDD) of the LSM510.
Acknowledgment
We thank the University of California, Berkeley, the Camille and Henry Dreyfus Foundation (New Faculty Award), the Arnold and Mabel Beckman Foundation (Young Investigator Award), and the American Federation for Aging Research for support of this work. E.W.M. was supported by a Chemical Biology Interface Training Grant from the National Institutes of Health (T32 GM066698). A.E.A. is also a trainee of the Chemical Biology Graduate Program and acknowledges a Berkeley Chancellor's Opportunity Fellowship. We thank Hanson Lee for preparing neuronal cell cultures, Prof. Kris McNeill and Ann McNally for a kind gift of Sensitox II, Prof. Dean Toste for use of an ozonator, and Prof. Richmond Sarpong for use of a mercury arc lamp.
References
- 1.Ohshima H, Tatemichi M, Sawa T. Arch. Biochem. Biophys. 2003;417:3–11. doi: 10.1016/s0003-9861(03)00283-2. [DOI] [PubMed] [Google Scholar]
- 2.Shah AM, Channon KM. Heart. 2004;90:486–487. doi: 10.1136/hrt.2003.029389. [DOI] [PMC free article] [PubMed] [Google Scholar]
- 3.Barnham KJ, Masters CL, Bush AI. Nat. Rev. Drug Discovery. 2004;3:205–214. doi: 10.1038/nrd1330. [DOI] [PubMed] [Google Scholar]
- 4.Connor JR, editor. Metals and Oxidative Damage in Neurological Disorders. Plenum Press; New York: 1997. [Google Scholar]
- 5.Aruoma OI, Halliwell B, editors. Molecular Biology of Free Radicals in Human Diseases. OICA International; Micoud, St. Lucia: 1998. [Google Scholar]
- 6.Balaban RS, Nemoto S, Finkel T. Cell. 2005;120:483–495. doi: 10.1016/j.cell.2005.02.001. [DOI] [PubMed] [Google Scholar]
- 7.Finkel T, Holbrook NJ. Nature. 2000;408:239–247. doi: 10.1038/35041687. [DOI] [PubMed] [Google Scholar]
- 8.Beckman KB, Ames BN. Physiol. Rev. 1998;78:547–581. doi: 10.1152/physrev.1998.78.2.547. [DOI] [PubMed] [Google Scholar]
- 9.Rhee SG, Kang SW, Jeong W, Chang T-S, Yang K-S, Woo HA. Curr. Opin. Cell Biol. 2005;17:183–189. doi: 10.1016/j.ceb.2005.02.004. [DOI] [PubMed] [Google Scholar]
- 10.Finkel T. Curr. Opin. Cell Biol. 2003;15:247–254. doi: 10.1016/s0955-0674(03)00002-4. [DOI] [PubMed] [Google Scholar]
- 11.Stone JR. Arch. Biochem. Biophys. 2004;422:119–124. doi: 10.1016/j.abb.2003.12.029. [DOI] [PubMed] [Google Scholar]
- 12.Wood ZA, Poole LB, Karplus PA. Science. 2003;300:650–653. doi: 10.1126/science.1080405. [DOI] [PubMed] [Google Scholar]
- 13.Guyton KZ, Liu Y, Gorospe M, Xu Q, Holbrook NJ. J. Biol. Chem. 1996;271:4138–4142. doi: 10.1074/jbc.271.8.4138. [DOI] [PubMed] [Google Scholar]
- 14.Schmidt KN, Amstad P, Cerutti P, Baeuerle PA. Chem. Biol. 1995;2:13–22. doi: 10.1016/1074-5521(95)90076-4. [DOI] [PubMed] [Google Scholar]
- 15.Lo YYC, Cruz TF. J. Biol. Chem. 1995;270:11727–11730. doi: 10.1074/jbc.270.20.11727. [DOI] [PubMed] [Google Scholar]
- 16.Lee S-R, Kwon K-S, Kim S-R, Rhee SG. J. Biol. Chem. 1998;273:15366–15372. doi: 10.1074/jbc.273.25.15366. [DOI] [PubMed] [Google Scholar]
- 17.Kwon J, Lee S-R, Yang K-S, Ahn Y, Kim YJ, Stadtman ER, Rhee SG. Proc. Natl. Acad. Sci. U.S.A. 2004;101:16419–16424. doi: 10.1073/pnas.0407396101. [DOI] [PMC free article] [PubMed] [Google Scholar]
- 18.Leslie NR, Bennett D, Lindsay YE, Stewart H, Gray A, Downes CP. EMBO J. 2003;22:5501–5510. doi: 10.1093/emboj/cdg513. [DOI] [PMC free article] [PubMed] [Google Scholar]
- 19.Avshalumov MV, Rice ME. Proc. Natl. Acad. Sci. U.S.A. 2003;100:11729–11734. doi: 10.1073/pnas.1834314100. [DOI] [PMC free article] [PubMed] [Google Scholar]
- 20.Avshalumov MV, Chen BT, Koos T, Tepper JM, Rice ME. J. Neurosci. 2005;25:4222–4231. doi: 10.1523/JNEUROSCI.4701-04.2005. [DOI] [PMC free article] [PubMed] [Google Scholar]
- 21.Veal EA, Findlay VJ, Day AM, Bozonet SM, Evans JM, Quinn J, Morgan BA. Mol. Cell. 2004;15:129–139. doi: 10.1016/j.molcel.2004.06.021. [DOI] [PubMed] [Google Scholar]
- 22.Tsien RW, Tsien RY. Annu. Rev. Cell Biol. 1990;6:715–760. doi: 10.1146/annurev.cb.06.110190.003435. [DOI] [PubMed] [Google Scholar]
- 23.Nègre-Salvayre A, Auge N, Duval C, Robbesyn F, Thiers J-C, Nazzal D, Benoist H, Salvayre R. Methods Enzymol. 2002;352:62–71. doi: 10.1016/s0076-6879(02)52007-3. [DOI] [PubMed] [Google Scholar]
- 24.Hempel SL, Buettner GR, O'Malley YQ, Wessels DA, Flaherty DM. Free Radical Biol. Med. 1999;27:146–159. doi: 10.1016/s0891-5849(99)00061-1. [DOI] [PubMed] [Google Scholar]
- 25.Keston AS, Brandt R. Anal. Biochem. 1965;11:1–5. doi: 10.1016/0003-2697(65)90034-5. [DOI] [PubMed] [Google Scholar]
- 26.Haugland RP. The Handbook: A Guide to Fluorescent Probes and Labeling Technologies. 10th Invitrogen/Molecular Probes; Carlsbad, CA: 2005. [Google Scholar]
- 27.Zhou M, Diwu Z, Panchuk-Voloshina N, Haugland RP. Anal. Biochem. 1997;253:162–168. doi: 10.1006/abio.1997.2391. [DOI] [PubMed] [Google Scholar]
- 28.Akasaka K, Suzuki T, Ohrui H, Meguro H. Anal. Lett. 1987;20:797–807. [Google Scholar]
- 29.Onoda M, Uchiyama S, Endo A, Tokuyama H, Santa T, Imai K. Org. Lett. 2003;5:1459–1461. doi: 10.1021/ol0342150. [DOI] [PubMed] [Google Scholar]
- 30.Onoda M, Tokuyama H, Uchiyama S, Mawatari K.-i., Santa T, Kaneko K, Imai K, Nakagomi K. Chem. Commun. 2005:1848–1850. doi: 10.1039/b500419e. [DOI] [PubMed] [Google Scholar]
- 31.Soh N, Sakawaki O, Makihara K, Odo Y, Fukaminato T, Kawai T, Irie M, Imato T. Bioorg. Med. Chem. 2005;13:1131–1139. doi: 10.1016/j.bmc.2004.11.023. [DOI] [PubMed] [Google Scholar]
- 32.Wolfbeis OS, Duerkop A, Wu M, Lin Z. Angew. Chem., Int. Ed. 2002;41:4495–4498. doi: 10.1002/1521-3773(20021202)41:23<4495::AID-ANIE4495>3.0.CO;2-I. [DOI] [PubMed] [Google Scholar]
- 33.Kozhevnikov VN, Mandl C, Miltschitzky S, Duerkop A, Wolfbeis OS, Koenig B. Inorg. Chim. Acta. 2005;358:2445–2448. [Google Scholar]
- 34.Maeda H, Fukuyasu Y, Yoshida S, Fukuda M, Saeki K, Matsuno H, Yamauchi Y, Yoshida K, Hirata K, Miyamoto K. Angew. Chem., Int. Ed. 2004;43:2389–2391. doi: 10.1002/anie.200452381. [DOI] [PubMed] [Google Scholar]
- 35.Lo L-C, Chu C-Y. Chem. Commun. 2003:2728–2729. doi: 10.1039/b309393j. [DOI] [PubMed] [Google Scholar]
- 36.Setsukinai K.-i., Urano Y, Kakinuma K, Majima HJ, Nagano T. J. Biol. Chem. 2003;278:3170–3175. doi: 10.1074/jbc.M209264200. [DOI] [PubMed] [Google Scholar]
- 37.Chang MCY, Pralle A, Isacoff EY, Chang CJ. J. Am. Chem. Soc. 2004;126:15392–15393. doi: 10.1021/ja0441716. [DOI] [PMC free article] [PubMed] [Google Scholar]
- 38.Kuivila HG, Armour AG. J. Am. Chem. Soc. 1957;79:5659–5662. [Google Scholar]
- 39.Kuivila HG, Wiles RA. J. Am. Chem. Soc. 1955;77:4830–4834. [Google Scholar]
- 40.Lakowicz JR. Principles of Fluorescence Spectroscopy. 2nd Kluwer Academic/Plenum; New York: 1999. [Google Scholar]
- 41.Ishiyama T, Murata M, Miyaura N. J. Org. Chem. 1995;60:7508–7510. [Google Scholar]
- 42.Grover PK, Shah GD, Shah RC. J. Chem. Soc. 1955:3982–3985. [Google Scholar]
- 43.Flamigni L, Venuti E, Camaioni N, Barigelletti F. J. Chem. Soc., Faraday Trans. 2. 1989;85:1935–1943. [Google Scholar]
- 44.Zipfel WR, Williams RM, Webb WW. Nat. Biotechnol. 2003;21:1369–1377. doi: 10.1038/nbt899. [DOI] [PubMed] [Google Scholar]
- 45.Mainen ZF, Maletic-Savatic M, Shi SH, Hayashi Y, Malinow R, Svoboda K. Methods. 1999;18:231–239. doi: 10.1006/meth.1999.0776. [DOI] [PubMed] [Google Scholar]
- 46.Helmchen F, Denk W. Curr. Opin. Neurobiol. 2002;12:593–601. doi: 10.1016/s0959-4388(02)00362-8. [DOI] [PubMed] [Google Scholar]
- 47.Hampton MB, Orrenius S. FEBS Lett. 1997;414:552–556. doi: 10.1016/s0014-5793(97)01068-5. [DOI] [PubMed] [Google Scholar]
- 48.Armarego WLF, Perrin DD. Purification of Laboratory Chemicals. 4th Pergamon; Oxford, UK: 1997. [Google Scholar]
- 49.Kröncke KD, Kolb-Bachofen V. Methods Enzymol. 1999;301:126–135. doi: 10.1016/s0076-6879(99)01075-7. [DOI] [PubMed] [Google Scholar]
- 50.Prat F, Foote CS. Photochem. Photobiol. 1998;67:626–627. [Google Scholar]
- 51.Macpherson HT. Biochem. J. 1942;36:59–63. doi: 10.1042/bj0360059. [DOI] [PMC free article] [PubMed] [Google Scholar]
- 52.Brewer GJ, Torricelli JR, Evege EK, Price PJ. J. Neurosci. Res. 1993;35:567–576. doi: 10.1002/jnr.490350513. [DOI] [PubMed] [Google Scholar]