

Abstract
Objectives. The link between income disparities and health has been studied mostly in developed nations. This study assesses the relationship between income disparities and life expectancy in Brazil and measures the impact of illiteracy rates on the association.
Methods. The units of analysis (n = 27) are all the Brazilian states and the federal capital. Simple and multiple linear regressions were performed to measure the association between income disparity, measured by the Gini coefficient, gross domestic product (GDP) per capita, and illiteracy rate. Data came from publicly available sources at the Brazilian Ministry of Health and the Brazilian Institute of Geography and Statistics.
Results. Income disparities and illiteracy rates were negatively associated with life expectancy in Brazil. GDP per capita was positively associated with life expectancy. The inclusion of illiteracy rates in the regression model removed the effect of income disparities.
Conclusions. Illiteracy rate is strongly associated with life expectancy in Brazil. This finding is in accord with reports from the United States and has implications for health policy and planning for both developed and developing countries.
The report of an association between income inequality and health indicators has caused considerable debate recently,1–4 and has spurred the development of other studies attempting to replicate this finding and understand its causal pathways. A limitation to the generalizability (external validity) of such studies is the fact that the great majority of them have been performed in developed countries. Also, a more recent international study involving 16 countries has shown that explanations of between-country differences are complex and that the reported associations, from multicountry comparisons, may be misleading.5 Compared with international studies, reports of the association between income inequality and health within the United States—using individual states as units of analysis—have shown a more consistent pattern of association, and education has been proposed as one of the pathways.4 Comparing data from Canada with those from the United States has also shown that the effects of income inequality may be balanced by other putative societal factors.6
Although Brazil has large population and great geographical variation, few studies have been performed there assessing the impact of income distribution and health outcomes. A study comparing cities within a state in northeast Brazil has shown an association between female illiteracy, gross domestic product (GDP) per capita, and child mortality.7 Another study in a city in southeast Brazil has shown an association between social class, income distribution, and child mortality.8
The present study tests the hypothesis that the association between income inequalities and health is present in Brazil, and that educational level is part of the pathway for this association.
METHODS
Data were taken from public data sets from the Brazilian Ministry of Health and the Brazilian Institute of Geography and Statistics. Simple and multiple linear regressions were used to assess associations, with each state weighted according to its population size. The 27 units of the federation—26 states and the federal district (the nation’s capital, Brasilia)—were the units of analysis. Life expectancy at birth for each state was the health outcome. Predictors included were GDP per capita, illiteracy rate, and the Gini coefficient.
GDP per capita, illiteracy rate, and life expectancy data came from figures released by the Brazilian Ministry of Health.9 The data are for the years 1998 (GDP) and 2000 (life expectancy and illiteracy). The Gini coefficient for each unit of the federation came from the 2000 census released by the Brazilian Institute of Geography and Statistics.10 The Gini coefficient has been extensively used in studies of income inequality and is based on the equivalent household disposable income. It provides a unified measure of income inequality, ranging from zero (no difference among households) to 1 (greatest level of disparity).1 Both databases are available online.9,10 Analyses were performed using Stata 7.0.11
RESULTS
Brazil presents very high levels of income disparities: the Gini coefficient among the states ranged from .548 (Santa Catarina) to .628 (Ceará). Life expectancy ranged from 63.16 years (Alagoas) to 71.34 years (Santa Catarina). Illiteracy rates ranged from 6.3% (Santa Catarina) to 33.4% (Alagoas). Study data are available from the authors upon request.
Figure 1 ▶ shows the association between life expectancy and income inequality among the Brazilian states. The simple linear regression of life expectancy on income inequality yielded a significant and negative association (P = .024), resulting in a drop of 0.6 years in life expectancy for each 0.01 increase in the Gini coefficient.
FIGURE 1—

Life expectancy and income inequality: Brazil, 2000.
Note. Each square represents a state and is proportional to the size of its population.
As inequality may be inversely associated to GDP per capita—i.e., states with a lower Gini coefficient present higher GDP per capita—I investigated its association with life expectancy. There was a positive and significant association between GDP per capita and life expectancy in Brazil (P = .002). The regression shows an increase of 1 year of life expectancy for each increase of US$1000 in GDP per capita.
Figure 2 ▶ presents the significant and negative association between illiteracy and life expectancy for each Brazilian state. The regression result showed a 2.2-year decrease in life expectancy for a 10-unit increase in illiteracy rate (P < .001). In the figures, each state is represented by a square proportional to the population size of the state.
FIGURE 2—

Life expectancy and illiteracy rate: Brazil, 2000.
Note. Each square represents a state and is proportional to the size of its population.
When the variables were combined in a multiple linear regression, illiteracy rate continued to be significantly associated with life expectancy, whereas income inequality became nonsignificant. Figure 3 ▶ shows the percentage of the variation in life expectancy explained by the simple linear regression with illiteracy and income inequality, the amount explained by the multiple regression combining inequality and GDP, and the amount explained by all 3 variables together. All regression models were statistically significant at the P = .05 level. Results for each multiple regression are presented in Table 1 ▶.
FIGURE 3—
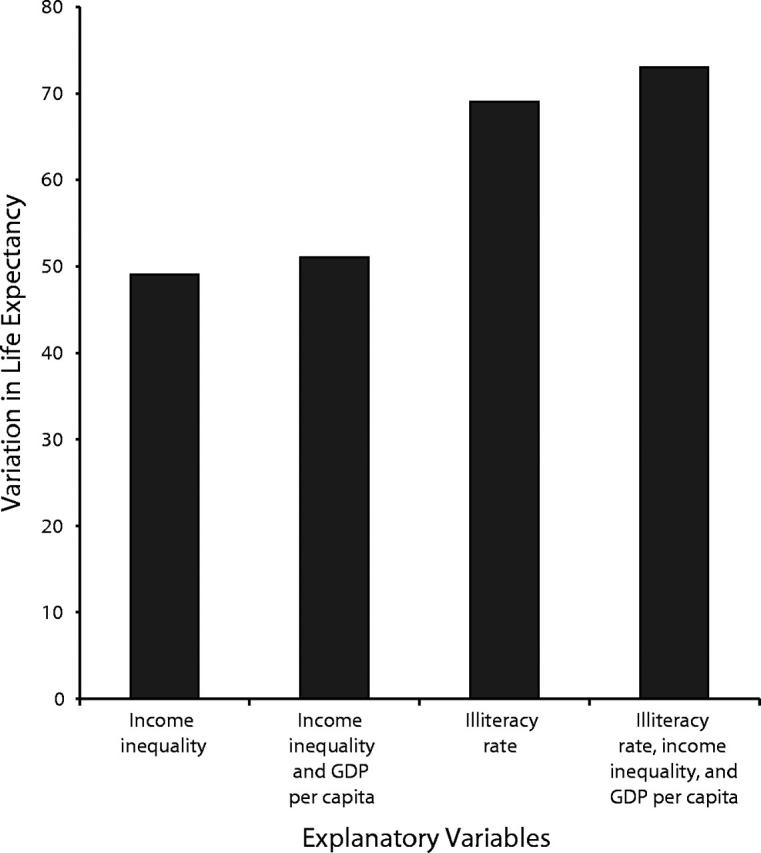
Percentage of variation in life expectancy explained by education and income variables: Brazil, 2000
Note. GDP = gross domestic product.
TABLE 1—
Association Between Socioeconomic Factors and Life Expectancy at Birth in Brazil
| Variable | Coefficient | Robust Standard Error | P | R2 |
| Simple linear regression | ||||
| Gini coefficient | −79.13 | 14.8 | .001 | .49 |
| GDP per capita | .001 | .0002 | .001 | .39 |
| Illiteracy rate | −.22 | .03 | .001 | .69 |
| Multiple linear regression | ||||
| Gini coefficient and GDP per capita | . . . | . . . | . . . | .51 |
| Gini coefficient | −59.8 | 23.8 | .002 | . . . |
| GDP per capita | .0004 | .0003 | .164 | . . . |
| Gini coefficient and illiteracy rate | . . . | . . . | . . . | .68 |
| Gini coefficient | −8.7 | 23.9 | .72 | . . . |
| Illiteracy rate | −.21 | .07 | .006 | . . . |
| GDP per capita and illiteracy | . . . | . . . | . . . | .72 |
| GDP per capita | −.0006 | .0002 | .007 | . . . |
| Illiteracy rate | −31 | .06 | .0001 | . . . |
| All 3 variables combined | . . . | . . . | . . . | .73 |
| Gini coefficient | −14.6 | 21.6 | .51 | . . . |
| GDP per capita | −.0006 | .0002 | .004 | . . . |
| Illiteracy rate | −.29 | .08 | .002 | . . . |
Note. GDP = gross domestic product.
DISCUSSION
Income inequality, GDP per capita, and illiteracy rate among Brazilian states are associated with life expectancy. Variation in life expectancy is most strongly associated with illiteracy rate.
The findings of this study should be considered in light of the limitations of the approach used. The major problem of aggregate studies is the “ecological fallacy,” defined as “the bias that may occur because an association observed between variables on an aggregate level does not necessarily represent an association at the individual level.”12(p40) This is particularly important in this study, as the population within each Brazilian state presents marked variability in income and health. This limitation emphasizes the need for studies using data at the individual level. One possible argument against this study’s ecological bias is a study looking at US states that found an effect of income disparity after adjusting for individual income.13 Other theoretical limitations of this approach have been discussed elsewhere.14 Another potential confounder of this association is race.15 Differential measurement error also plays a role in this association. This might explain, in part, why stronger correlations are found with illiteracy than with income inequalities.
Findings of an association between income and mortality, possibly mediated by education, seem to be in accord with previous studies performed in Brazil. As described earlier in this article, economic factors have been linked to child mortality in Brazil.7,8 Furthermore, low social class has been associated with relapse from acute leukemia in Brazilian children.16 Social inequality has been associated with violence in 2 Brazilian cities.17,18 The distribution of causes of death has been linked to income.19 Associations between the value of the minimum wage and child mortality have also been reported in Brazil.20
Different pathways, from income discrepancies to health outcomes, have been proposed elsewhere to explain this association. Psychosocial distress, caused by inequality, in individuals at the bottom of the social ladder is one theory.21 Chronic lack of resources in areas with greater income disparity has also been proposed as a putative mechanism.22 Another potential pathway from income inequality to health is disinvestments in social capital.23 Future studies should clarify the reported association at the individual level and assess the possible mechanisms and ways to intervene in the pathway from income inequality to mortality, by addressing issues such as employment level, urban violence, income distribution, and education.
Foremost, these results stress the importance of education in public health. Policymakers in both developed and developing countries should take this into account when planning funding for education.
Acknowledgments
Human Participant Protection
No institutional review board approval was needed for this study.
Peer Reviewed
References
- 1.Shibuya K, Hashimoto H, Yano E. Individual income, income distribution, and self rated health in Japan: cross sectional analysis of nationally representative sample. BMJ. 2002;324:16–19. [DOI] [PMC free article] [PubMed] [Google Scholar]
- 2.Rodgers GB. Income and inequality as determinants of mortality: an international cross-section analysis. Int J Epidemiol. 2002;31:533–538. [DOI] [PubMed] [Google Scholar]
- 3.Osler M, Prescott E, Gronbaek M, Christensen U, Due P, Engholm G. Income inequality, individual income, and mortality in Danish adults: analysis of pooled data from two cohort studies. BMJ. 2002;324:13–16. [DOI] [PMC free article] [PubMed] [Google Scholar]
- 4.Muller A. Education, income inequality, and mortality: a multiple regression analysis. BMJ. 2002;324:23–25. [DOI] [PMC free article] [PubMed] [Google Scholar]
- 5.Lynch J, Smith GD, Hillemeier M, Shaw M, Raghunathan T, Kaplan G. Income inequality, the psychosocial environment, and health: comparisons of wealthy nations. Lancet. 2001;358:194–200. [DOI] [PubMed] [Google Scholar]
- 6.Ross NA, Wolfson MC, Dunn JR, Berthelot JM, Kaplan GA, Lynch JW. Relation between income inequality and mortality in Canada and in the United States: cross sectional assessment using census data and vital statistics. BMJ. 2000;320:898–902. [DOI] [PMC free article] [PubMed] [Google Scholar]
- 7.Terra de Souza AC, Cufino E, Peterson KE, Gardner J, Vasconcelos do Amaral MI, Ascherio A. Variations in infant mortality rates among municipalities in the state of Ceara, Northeast Brazil: an ecological analysis. Int J Epidemiol. 1999;28:267–275. [DOI] [PubMed] [Google Scholar]
- 8.Goldani MZ, Barbieri MA, Bettiol H, Barbieri MR, Tomkins A. Infant mortality rates according to socioeconomic status in a Brazilian city. Rev Saúde Pública. 2001;35:256–261. [DOI] [PubMed] [Google Scholar]
- 9.Brazilian Ministry of Health. Indicadores e dados básicos—Brasil—2001. IDB-2001. Available at: http://tabnet.datasus.gov.br/cgi/idb2001/matriz.htm. Accessed April 10, 2003.
- 10.Brazilian Institute for Geography and Statistics. Censo demográfico de 2000. Available at: http://www.sidra.ibge.gov.br/bda/. Accessed April 10, 2003.
- 11.Stata, Version 7.0 [computer program]. College Station, Tex: Stata Corp; 2000.
- 12.Last JM, ed. A Dictionary of Epidemiology. 3rd ed. New York, NY: Oxford University Press; 1995.
- 13.Lochner K, Pamuk E, Makuc D, Kennedy BP, Kawachi I. State-level income inequality and individual mortality risk: a prospective, multilevel study. Am J Public Health. 2001;91:385–391. [DOI] [PMC free article] [PubMed] [Google Scholar]
- 14.Gravelle H, Wildman J, Sutton M. Income, income inequality and health: what can we learn from aggregate data? Soc Sci Med. 2002;54:577–589. [DOI] [PubMed] [Google Scholar]
- 15.McLaughlin DK, Stokes CS. Income inequality and mortality in US counties: does minority racial concentration matter? Am J Public Health. 2002;92:99–104. [DOI] [PMC free article] [PubMed] [Google Scholar]
- 16.Viana MB, Fernandes RA, de Carvalho RI, Murao M. Low socioeconomic status is a strong independent predictor of relapse in childhood acute lymphoblastic leukemia. Int J Cancer Suppl. 1998;11:56–61. [PubMed] [Google Scholar]
- 17.Barata RB, Ribeiro MC, Guedes MB, de Moraes JC. Intra-urban differentials in death rates from homicide in the city of Sao Paulo, Brazil, 1988–1994. Soc Sci Med. 1998;47:19–23. [DOI] [PubMed] [Google Scholar]
- 18.Macedo AC, Paim JS, Silva LM, Costa MCN. Violence and social inequalities: mortality rates due to homicides and life conditions in Salvador, Brazil [in Portuguese]. Rev Saúde Pública. 2001;35:515–522. [DOI] [PubMed] [Google Scholar]
- 19.Sichieri R, de Lolio CA, Correia VR, Everhart JE. Geographical patterns of proportionate mortality for the most common causes of death in Brazil. Rev Saúde Pública. 1992;26:424–430. [DOI] [PubMed] [Google Scholar]
- 20.Wood CH. The political economy of infant mortality in Sao Paulo, Brazil. Int J Health Serv. 1982;12:215–229. [DOI] [PubMed] [Google Scholar]
- 21.Wilkinson RG. Comment: income, inequality, and social cohesion. Am J Public Health. 1997;87:1504–1506. [DOI] [PMC free article] [PubMed] [Google Scholar]
- 22.Lynch JW, Smith GD, Kaplan GA, House JS. Income inequality and mortality: importance to health of individual income, psychosocial environment, or material conditions. BMJ. 2000;320:1200–1204. [DOI] [PMC free article] [PubMed] [Google Scholar]
- 23.Kawachi I, Kennedy BP, Lochner K, Prothrow-Stith D. Social capital, income inequality, and mortality. Am J Public Health. 1997;87:1491–1498. [DOI] [PMC free article] [PubMed] [Google Scholar]