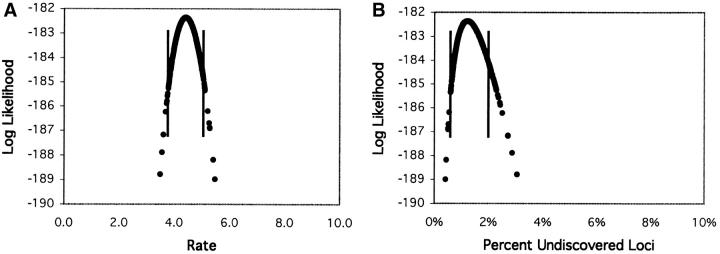
Figure 3.—
Log-likelihood (natural log; ln L) values for sampled points in the Markov chain Monte Carlo simulation for the Nüsslein-Volhard data set under the Poisson model. Distributions are shown for (A) the rate (λ) and (B) the percentage of undiscovered loci (the fraction of all loci predicted to exist that was not detected in the experiment). The data shown are for 100,000 points from a chain sampled every 100 generations, with the first 50 points removed as “burn-in.” The bounds of the 95% credible regions are depicted with vertical lines, and the maximum-likelihood value is at the top of the curve.

