

Abstract
In Escherichia coli, the expression of the RpoS regulon is known to be crucial for survival in liquid cultures during stationary phase. By measuring cell viability and by transcriptome analysis, here we show that rpoS cells as well as wild-type cells survive when they form colonies on solid media.
ESCHERICHIA coli possess seven RNA polymerase σ-factors, which compete for association with the core polymerase subunit, each coordinating the transcription of a set of genes, which allows fine control of adaptation to different physiological conditions (Record et al. 1996). In cells that approach stationary phase, the σ-factor σ38 (RpoS) competes with the primary σ-factor σ70 (RpoD) for association with the core polymerase subunit. To date ∼100 genes have been reported to belong to the RpoS regulon whose induction results in physiological and morphological modifications that increase resistance to various stresses such as heat shock, cold shock, acid shock, oxidative stress, osmotic stress, and UV light (Storz and Hengge-Aronis 2000).
Paradoxically, mutations and even inactivation of the rpoS gene might be tolerated or advantageous in nature, despite the partial or complete loss of RpoS-dependent resistance to environmental challenges, as suggested by the high degree of allelic variation of the rpoS genes from E. coli natural isolates (Herbelin et al. 2000; Jorgensen et al. 2000). Several studies have shown that the fitness of rpoS mutants depends on environmental conditions (Ferenci 2001; Farrell and Finkel 2003). However, the influence of the structured environment on fitness of the rpoS mutant is unknown. In nature, E. coli is often found in structured environments, e.g., microcolonies, aggregates, or biofilms. Hence, in this study we have tested how a structured environment influences the survival of an E. coli rpoS mutant to determine whether the selection of rpoS alleles found in nature can occur in such environments.
While the decrease in the number of colony forming units (CFUs) obtained from planktonic cells between 1 day (D1) and 7 days (D7) in culture was 200-fold for rpoS mutant and 10-fold for wild-type strain (wt), there was little difference in colonies between D1 and D7 for each strain as well as between the two strains (Table 1a). Furthermore, the measurements of the cell viability in aging colonies, as well as of the colony area, show that the rpoS mutant had difficulties relative to wt during the first 24 hr (D1) but there was no difference between the two strains after 7 days (D7; Table 1b), indicating better survival of rpoS cells at D7 than at D1, and/or increased cell turnover. To identify the functions that might be responsible for fitness modifications of rpoS mutants in structured environments, we established genome-wide transcription profiles of cells in aging colonies of wt and rpoS strains using macroarray technology.
TABLE 1.
Growth and death within wild-type andrpoS colonies
| a | CFU per milliliter of liquid LB |
SD | CFU per colony | SD |
|---|---|---|---|---|
| wt D1 | 2.74 × 10⁹ | 4.1 × 10⁸ | 2.19 × 10⁹ | 1.14 × 10⁹ |
| wt D7 | 2.98 × 10⁸ | 1.4 × 10⁸ | 4.05 × 10⁹ | 2.15 × 10⁹ |
| rpoS D1 | 3.11 × 10⁹ | 6.3 × 10⁸ | 1.9 × 10⁹ | 0.7 × 10⁹ |
| rpoS D7 | 2.96 × 10⁷ | 3.2 × 10⁷ | 4.32 × 10⁹ | 1.7 × 10⁹ |
| Colony area (mm2)
|
% of dead cells per colony
|
|||
| b | D1 | D7 | D1 | D7 |
| wt | 1.76 | 136 | 2.94 | 58 |
| rpoS | 1.56 | 147 | 7.2 | 59 |
| P-value | 0.003 | 0.36 | 5.1 × 10⁻⁵ | 0.56 |
We used the E. coli K12 MG1655 strain (wt) and the derived rpoS mutant strain (the rpoS359::Tn10 allele was kindly provided by M. E. Winkler, Indiana University, Bloomington, IN). Bacteria were grown in agitated Luria-Bertani broth (LB) liquid medium at 37° for 1 day or 7 days. For colony analysis, 102–103 cells from an overnight liquid culture were inoculated onto nitrocellulose filters (NC 45 from Schleicher & Schuell, Keene, NH), laid on fresh LB plates (agar 15 g/liter), and incubated at 37° for 1 day (D1) or 7 days (D7). Afterward, the filter with the growing colony was put in 1 ml of LB and vortexed, which enabled the recovery of all the cells. To calculate the number of CFUs per milliliter of liquid culture or per colony, aliquots of diluted cells were plated on LB and the CFUs were counted 1 day after plating. The average number of CFUs and the standard deviation (SD) from six experiments are indicated in a. The areas of 22 wt colonies and 22 rpoS colonies at D1 and D7 were measured using the software Ellix (Microvision, Evry, France). Percentages of dead cells within 7 wt colonies and 7 rpoS colonies at D1 and D7 were estimated by flow cytometry analysis (FASCscan, Becton Dickinson) using the two-color fluorescence (syto 9 green/propidium iodide) assay from Molecular Probes (Eugene, OR; live/dead Baclight bacterial viability kits). The null hypothesis of equal mean surface and equal mean percentage of dead cells (H1) between the two strains at each time was tested by calculating the t-test and the P-value (significant when P < 0.05). The area averages, the percentage of dead cell averages, and P-value are reported in b.
The transcriptome analysis supports the observation that the rpoS colonies have more difficulties at D1 compared to wt colonies (Tables 1b and 2). For example, at D1, we observed a lower expression of genes coding for translation apparatus [ribosomal proteins (50S and 30S subunits)] in rpoS than in wt colonies, which may indicate that the rpoS cells have a lower growth rate than wt cells (Gausing 1977). Furthermore, at D1, we observed a higher expression of the oxyR and soxR genes (coding for transcriptional regulators involved in the response to hydrogen peroxide and superoxide, respectively; Storz and Imlay 1999) in rpoS colonies than in wt colonies, indicating that oxidative stress might be the major problem for rpoS cells (Table 2). The induction of these two stress responses in rpoS mutant may be the consequence of the deficiency in RpoS-mediated protection against oxidants (Dps, KatE; Hengge-Aronis 2002) and/or an increase in production of reactive oxygen species. Moreover, some genes that are not regulated by OxyR but are induced by H2O2 treatment (Zheng et al. 2001)—such as the ydcH (unknown function) and the yfiA gene encoding a protein associated with 70S ribosomes in stationary phase (Maki et al. 2000)—were also upregulated in rpoS compared to wt at D1. The decrease in viability of rpoS cells at D1 could also result from the absence of downregulation of the ompF gene (coding for major outer membrane porin; Liu and Ferenci 2001), which is observed in wt. The downregulation of the ompF gene reduces membrane permeability and consequently the entry of toxic compounds into cells (Martinez-Martinez et al. 2000).
TABLE 2.
Genes with altered expression inrpoS compared to wt colonies
| Functional categories and gene products | Genes | Fold wt D7 vs. wt D1 |
Fold rpoS D1 vs. wt D1 |
Fold rpoS D7 vs. wt D7 |
Fold rpoS D7 vs. rpoS D1 |
|---|---|---|---|---|---|
| Adaptations: atypical conditions | |||||
| Heat-shock protein | htgA | −1.06 | −2.55 | 1.27 | 3.04 |
| Heat-shock protein | htpX | 1.25 | −1.05 | 1.43 | 1.88 |
| Heat-shock protein | ibpB | 1.26 | −4.69 | −1.09 | 5.41 |
| Heat-shock protein | ibpA | 1.31 | −1.96 | −1.19 | 2.16 |
| Heat-shock protein | groES | −1.83 | −1.37 | 2.06 | 1.54 |
| Heat-shock protein | hslV | 1.13 | −1.95 | 1.33 | 2.93 |
| H2O2-inducible genes activator | oxyR | 1.14 | 2.38 | −1.01 | −2.11 |
| Manganese superoxide dismutase | sodA | −1.15 | −2.64 | 1.35 | 3.11 |
| Regulatory protein of SoxRS regulon | soxR | −1.12 | 2.00 | 1.08 | −2.09 |
| Ribosome binding protein, H2O2 inducible | yfiA | 1.54 | 4.74 | −1.37 | −4.23 |
| RNA polymerase σ-32 subunit | rpoH | −1.01 | −1.64 | 1.23 | 1.99 |
| Unknown, H2O2 inducible | ydcH | −1.01 | 2.7 | 1.64 | −1.66 |
| DNA repair | |||||
| Damage-inducible protein J | dinJ | 1.43 | −2.14 | −1.01 | 3.02 |
| DNA-damage-inducible protein G | dinG | 1.68 | −1.14 | 1.05 | 2.00 |
| Endonuclease IV | nfo | 1.52 | −2.01 | 1.13 | 2.50 |
| Exodeoxyribonuclease I | sbcB | −1.04 | −1.90 | 1.15 | 2.11 |
| Exodeoxyribonuclease small subunit | xseB | 1.01 | −1.78 | 1.63 | 2.92 |
| Exonuclease V subunit | recB | −1.15 | −1.55 | 1.42 | 1.92 |
| Uracil-DNA glycosylase | ung | −1.03 | −1.26 | 1.56 | 1.90 |
| Replication-transcription | |||||
| DNA polymerase III, χ-subunit | holC | −1.60 | −2.78 | 1.10 | 1.90 |
| Factor for inversion stimulation | fis | −1.89 | −1.55 | 1.74 | 1.43 |
| RNA polymerase, α-subunit | rpoA | −1.89 | −1.58 | 1.82 | 1.52 |
| RNA polymerase, β-subunit | rpoB | −2.01 | −2.74 | 1.63 | 2.23 |
| RNA polymerase, β′-subunit | rpoC | −1.51 | −3.13 | 1.25 | 2.59 |
| TCA cycle | |||||
| 2-Oxoglutarate dehydrogenase | sucA | 1.19 | 1.03 | 2.31 | 2.65 |
| Aconitate hydratase 2 | acnB | −1.19 | −2.61 | −1.11 | 1.97 |
| Citrate hydro-lyase 1 | acnA | 1.01 | −2.04 | 1.04 | 2.15 |
| Citrate synthase | gltA | −1.15 | 1.06 | 2.08 | 1.71 |
| Dihydrolipoamide succinyltransferase | sucB | 1.02 | 1.02 | 1.81 | 1.82 |
| Fumarate hydratase class II | fumC | 2.45 | −1.09 | 1.43 | 3.85 |
| Malate dehydrogenase | mdh | −1.07 | −2.08 | 1.20 | 2.32 |
| Succinate dehydrogenase | sdhC | 1.67 | −1.08 | 1.18 | 2.13 |
| Succinate dehydrogenase | sdhD | 1.23 | −1.02 | 2.78 | 3.51 |
| Succinate dehydrogenase flavoprotein | sdhA | 1.03 | −1.05 | 1.69 | 1.83 |
| Succinate dehydrogenase iron-sulfur protein | sdhB | −1.09 | 1.02 | 1.93 | 1.73 |
| Succinyl-coA synthetase α-chain | sucD | −1.02 | 1.96 | 3.40 | 1.70 |
| Succinyl-coA synthetase β-chain | sucC | 1.09 | −1.19 | 1.90 | 2.47 |
| Outer membrane constituents | |||||
| Outer membrane porin F | ompF | −1.11 | 3.21 | −9.32 | −33.19 |
| Phage shock proteins | |||||
| Phage shock protein A | pspA | 3.18 | 2.06 | 1.18 | 1.82 |
| Phage shock protein B | pspB | 1.62 | −1.16 | 2.26 | 4.25 |
| Phage shock protein C | pspC | −1.13 | 1.07 | 2.56 | 2.11 |
| Phage shock protein D | pspD | 2.17 | −1.06 | 1.71 | 3.94 |
| Ribosomal proteins | |||||
| 30S subunit protein S3 | rpsC | −1.81 | −2.02 | 1.64 | 1.83 |
| 30S subunit protein S5 | rpsE | −1.70 | −1.75 | 2.16 | 2.21 |
| 30S subunit protein S7 | rpsG | −2.57 | −3.26 | 1.51 | 1.92 |
| 30S subunit protein S8 | rpsH | −1.92 | −2.50 | 1.43 | 1.86 |
| 30S subunit protein S14 | rpsN | −1.45 | −1.97 | 1.92 | 2.61 |
| 30S subunit protein S16 | rpsP | −1.26 | −1.30 | 1.66 | 1.71 |
| 30S subunit protein S19 | rpsS | −1.31 | −1.98 | 1.37 | 2.07 |
| 50S subunit protein L1 | rplA | −2.07 | −3.15 | 1.44 | 2.19 |
| 50S subunit protein L2 | rplB | −1.49 | −2.48 | 1.43 | 2.38 |
| 50S subunit protein L3 | rplC | −1.83 | −2.53 | 1.19 | 1.64 |
| 50S subunit protein L6 | rplF | −1.76 | −1.81 | 2.00 | 2.06 |
| 50S subunit protein L10 | rplJ | −1.79 | −2.55 | 1.24 | 1.77 |
| 50S subunit protein L11 | rplK | −1.51 | −2.98 | 1.13 | 2.23 |
| 50S subunit protein L7/L12 | rplL | −1.42 | −2.36 | 1.22 | 2.03 |
| 50S subunit protein L15 | rplO | −1.44 | −2.24 | 1.81 | 2.81 |
| 50S subunit protein L16 | rplP | −1.55 | −2.01 | 1.56 | 2.01 |
| 50S subunit protein L19 | rplS | −1.61 | −1.33 | 1.81 | 1.50 |
| 50S subunit protein L23 | rplW | −1.53 | −1.80 | 1.37 | 1.61 |
| 50S subunit protein L24 | rplX | −1.18 | −1.58 | 1.51 | 2.02 |
| 50s subunit protein L25 | rplY | −1.63 | −2.21 | 1.28 | 1.74 |
| 50S subunit protein L29 | rpmC | −1.54 | −1.76 | 1.78 | 2.03 |
| Ribosomal protein L11 | prmA | −1.60 | −1.88 | 1.78 | 2.08 |
After 1 day (D1) and 7 days (D7), total RNA was extracted from several colonies (∼109 cells) and 2 μg was used for production of [α-33P]dCTP-labeled cDNA probe. Panorama arrays (Sigma-Genosis) containing the PCR-amplified 4290 ORFs of E. coli genes printed in duplicate were hybridized with the entire labeled cDNA probe following the recommendation of the furnisher. The software XdotsReader (Cose, Dugny, France) was used to calculate the pixel density for each spot. Each hybridization experiment was repeated four times with independent RNA preparation. The eight values for each gene have been used to test the null hypothesis of equal mean expression between the two strains and two different times by calculating the t-test and the Wilcoxon test. To analyze the fold change in transcript abundance, the (wt D7/wt D1), (rpoS D1/wt D1), (rpoS D7/wt D7), and (rpoS D7/rpoS D1) mRNA ratios were calculated. When the ratio was <1, the inverse ratio was reported with a negative value. This allows a symmetric view of the data (hence the direct value shift from +1 to −1). Genes with the (rpoS D1/wt D1) or (rpoS D7/rposS D1) ratios >1.5 and with a P-value ≤0.01 for both the t-test and the Wilcoxon test were considered to have significant difference of expression and are reported in this table. Genes upregulated in the rpoS strain compared to the wt strain at D1 are underlined. For the other genes listed, an increase in mRNA level was observed in the rpoS strain between D1 and D7. (For gene annotation, see http://www.genome.wisc.edu)
Between D1 and D7, the fraction of dead cells within wt and rpoS colonies reached 60%. The difficulties faced by both strains were reflected by the increase in expression of RpoS-independent genes involved in stress resistance and DNA repair: e.g., the σ32 (RpoH)/RpoN-regulated heat-shock genes ibpA, ibpB (Kitagawa et al. 2002), the psp genes (phage shock proteins; Model et al. 1997), some SOS genes (dinJ, dinG; Courcelle et al. 2001), and the nfo gene encoding endonuclease IV (Hosfield et al. 1999). We also observed, but only in rpoS, an increase in transcripts of RpoH-regulated genes (groES and htgA; Missiakas and Raina 1997), as well as the sbcB, recB (respectively, the exodeoxyribonuclease I and the exonuclease V subunit; Seigneur et al. 1999), xseB (exonuclease subunit; Viswanathan et al. 2001), sodA (manganese superoxide dismutase; Compan and Touati 1993), and ung (uracil-N-glycosylase; D'souza and Harrison 2003) genes. Therefore, rpoS cells in aging colonies appear to face various stresses that damage DNA and proteins. However, the fact that the rpoS strain does not show an increase in mortality relative to wt at D7 suggests that it succeeds in coping with the stresses encountered in aging colonies.
Remarkably, the expression of genes coding for ribosomal proteins globally decreases between D1 and D7 in the wt strain, while it increases in rpoS colonies (Figure 1). A similar tendency was observed for genes coding for RNA (rpoB, rpoC, and rpoH) and DNA (holC) polymerase subunits (Record et al. 1996). Finally, the expression of fis (Appleman et al. 1998), a gene coding for a protein required for adaptation of cells to rapid growth conditions, increases in rpoS D7 colonies relative to rpoS D1, as well as compared to wt D7. The resulting increase in transcription, protein, and DNA synthesis in aging rpoS colonies may simply be a side effect due to the absence of RpoS regulation. However, this global change may be the result of rpoS cell turnover, as some cells grow and divide while others die.
Figure 1.—
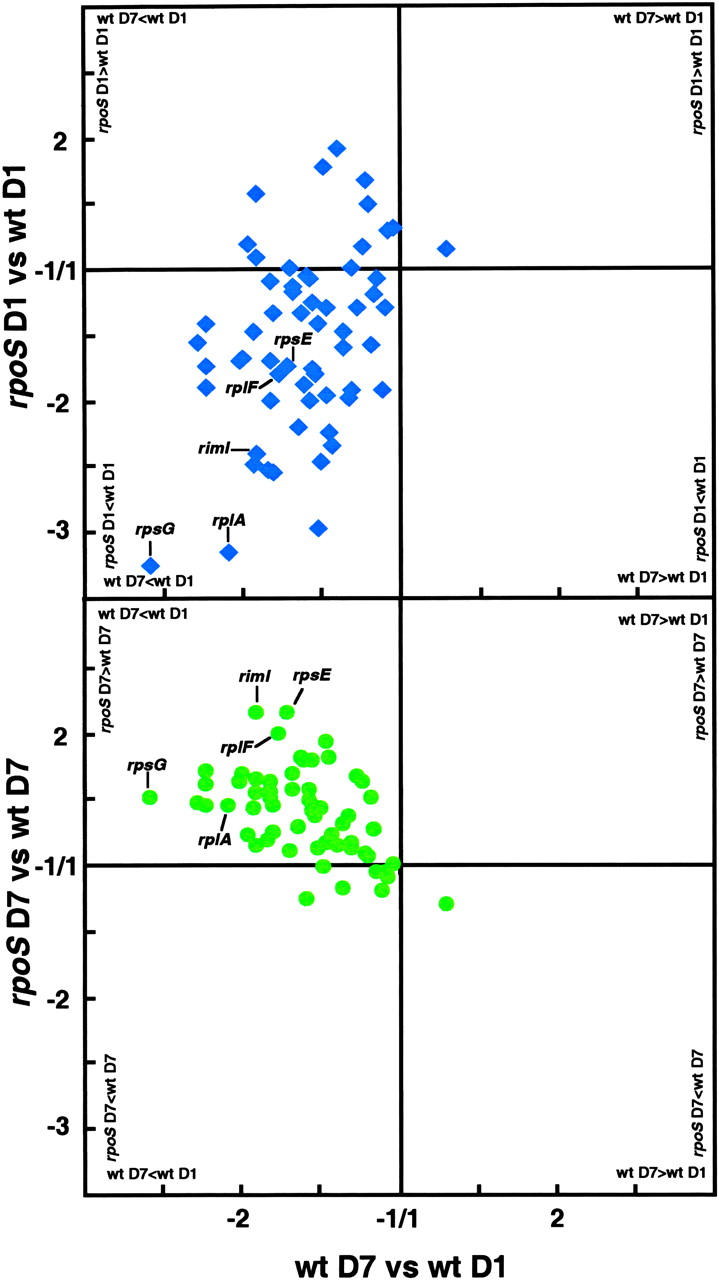
Fold change in transcript abundance of genes coding for ribosomal proteins. The two graphs compare expression of the 60 genes encoding ribosomal proteins in the rpoS strain to wt strain: top after 1 day (D1; blue) and bottom after 7 days (D7; green). The mRNA ratios for each gene between D1 and D7 in the wt strain [(wtD7/wtD1) or if wtD1 > wtD7 (−wtD1/wtD7)] are reported on the x-axis. mRNA ratios of the same genes for D1 and D7 between the wt strain and the rpoS strain [(rpoS/wt) or if wt > rpoS (−wt/rpoS)] are reported on the y-axis. At D1, most of the values are in the bottom left quadrant, corresponding to wt D7 < wt D1 and rpoS < wt. At D7, most of the values are in the top left quadrant, corresponding to wt D7 < wtD1 and rpoS > wt.
In conclusion, our study shows that RpoS-independent stress responses may be sufficient to ensure the survival of an rpoS population in aging colonies, which may not be the case in planktonic cells where the level of stress may be higher, particularly in oxidative stress (Dukan and Nystrom 1998). Furthermore, besides providing a collective defense against antagonists (Ma and Eaton 1992), the cellular aggregation may facilitate access to resources that cannot be efficiently utilized by isolated cells in suspension. This may be the case for reutilization of nutrients from the dead cells concentrated inside the colony (Shapiro 1992). Under such conditions, rpoS cells might use the available nutrients more efficiently than wt as suggested by the significant differences in transcriptional modifications of energy-producing pathways between the two strains. A compensatory transcription in rpoS colonies is suggested by the expression of genes involved in energy salvage: transcription of the psp operon and genes belonging to the tricarboxilic acid and the glyoxylate cycles (Cronan and LaPorte 1996), which are, respectively, RpoN and RpoD dependent, was higher in rpoS than in wt D7 colonies (Table 2). Therefore, it may be that the structured environments are favoring the observed enrichment for modified or null rpoS alleles in nature by providing an environmental niche in which the handicap resulting from the lack of various RpoS-dependent functions is attenuated through compensation.
Acknowledgments
We thank Bénédicte Gérard for help in transcriptome analysis, and Marie-Agnès Petit, Miroslav Radman, Eric Stewart, and Marin Vulic for critical reading of the manuscript. This work was supported by a grant from the Indo-French Center for the Promotion of Advanced Research.
References
- Appleman, J. A., W. Ross, J. Salomon and R. L. Gourse, 1998. Activation of Escherichia coli rRNA transcription by FIS during a growth cycle. J. Bacteriol. 180: 1525–1532. [DOI] [PMC free article] [PubMed] [Google Scholar]
- Compan, I., and D. Touati, 1993. Interaction of six global transcription regulators in expression of manganese superoxide dismutase in Escherichia coli K-12. J. Bacteriol. 175: 1687–1696. [DOI] [PMC free article] [PubMed] [Google Scholar]
- Courcelle, J., A. Khodursky, B. Peter, P. O. Brown and P. C. Hanawalt, 2001. Comparative gene expression profiles following UV exposure in wild-type and SOS-deficient Escherichia coli. Genetics 158: 41–64. [DOI] [PMC free article] [PubMed] [Google Scholar]
- Cronan, J. E., and D. C. LaPorte, 1996 Tricarboxylic acid cycle and glyoxylate bypass, pp. 206–216 in Escherichia coli and Salmonella: Cellular and Molecular Biology, edited by F. C. Neidhardt, R. Curtiss III, J. L. Ingraham, E. C. C. Lin, K. B. Low et al. ASM Press, Washington, DC.
- D'souza, D. I., and L. Harrison, 2003. Repair of clustered uracil DNA damages in Escherichia coli. Nucleic Acids Res. 31: 4573–4581. [DOI] [PMC free article] [PubMed] [Google Scholar]
- Dukan, S., and T. Nystrom, 1998. Bacterial senescence: stasis results in increased and differential oxidation of cytoplasmic proteins leading to developmental induction of the heat shock regulon. Genes Dev. 12: 3431–3441. [DOI] [PMC free article] [PubMed] [Google Scholar]
- Farrell, M. J., and S. E. Finkel, 2003. The growth advantage in stationary-phase phenotype conferred by rpoS mutations is dependent on the pH and nutrient environment. J. Bacteriol. 185: 7044–7052. [DOI] [PMC free article] [PubMed] [Google Scholar]
- Ferenci, T., 2001. Hungry bacteria—definition and properties of a nutritional state. Environ. Microbiol. 3: 605–611. [DOI] [PubMed] [Google Scholar]
- Gausing, K., 1977. Regulation of ribosome production in Escherichia coli: synthesis and stability of ribosomal RNA and of ribosomal protein messenger RNA at different growth rates. J. Mol. Biol. 115: 335–354. [DOI] [PubMed] [Google Scholar]
- Hengge-Aronis, R., 2002. Recent insights into the general stress response regulatory network in Escherichia coli. J. Mol. Microbiol. Biotechnol. 4: 341–346. [PubMed] [Google Scholar]
- Herbelin, C. J., S. C. Chirillo, K. A. Melnick and T. S. Whittam, 2000. Gene conservation and loss in the mutS-rpoS genomic region of pathogenic Escherichia coli. J. Bacteriol. 182: 5381–5390. [DOI] [PMC free article] [PubMed] [Google Scholar]
- Hosfield, D. J., Y. Guan, B. J. Haas, R. P. Cunningham and J. A. Tainer, 1999. Structure of the DNA repair enzyme endonuclease IV and its DNA complex: double-nucleotide flipping at a basic sites and three-metal-ion catalysis. Cell 98: 397–408. [DOI] [PubMed] [Google Scholar]
- Jorgensen, F., S. Leach, S. J. Wilde, A. Davies, G. S. Stewart et al., 2000. Invasiveness in chickens, stress resistance and RpoS status of wild-type Salmonella enterica subsp. enterica serovar Typhimurium definitive type 104 and serovar Enteritidis phage type 4 strains. Microbiology 146: 3227–3235. [DOI] [PubMed] [Google Scholar]
- Kitagawa, M., M. Miyakawa, Y. Matsumura and T. Tsuchido, 2002. Escherichia coli small heat shock proteins, IbpA and IbpB, protect enzymes from inactivation by heat and oxidants. Eur. J. Biochem. 269: 2907–2917. [DOI] [PubMed] [Google Scholar]
- Liu, X., and T. Ferenci, 2001. An analysis of multifactorial influences on the transcriptional control of ompF and ompC porin expression under nutrient limitation. Microbiology 147: 2981–2989. [DOI] [PubMed] [Google Scholar]
- Ma, M., and J. W. Eaton, 1992. Multicellular oxidant defense in unicellular organisms. Proc. Natl. Acad. Sci. USA 89: 7924–7928. [DOI] [PMC free article] [PubMed] [Google Scholar]
- Maki, Y., H. Yoshida and A. Wada, 2000. Two proteins, YfiA and YhbH, associated with resting ribosomes in stationary phase Escherichia coli. Genes Cells 5: 965–974. [DOI] [PubMed] [Google Scholar]
- Martinez-Martinez, L., M. C. Conejo, A. Pascual, S. Hernandez-Alles, S. Ballesta et al., 2000. Activities of imipenem and cephalosporins against clonally related strains of Escherichia coli hyperproducing chromosomal beta-lactamase and showing altered porin profiles. Antimicrob. Agents Chemother. 44: 2534–2536. [DOI] [PMC free article] [PubMed] [Google Scholar]
- Missiakas, D., and S. Raina, 1997. Protein misfolding in the cell envelope of Escherichia coli: new signaling pathways. Trends Biochem. Sci. 22: 59–63. [DOI] [PubMed] [Google Scholar]
- Model, P., G. Jovanovic and J. Dworkin, 1997. The Escherichia coli phage-shock-protein (psp) operon. Mol. Microbiol. 24: 255–261. [DOI] [PubMed] [Google Scholar]
- Record, M. T., W. S. Reznikoff, M. L. Craig, K. L. McQuade and P. J. Schlax, 1996 Escherichia coli polymerase (Eσ70), promoters, and the kinetics of the steps of transcription initiation, pp. 792–821 in Escherichia coli and Salmonella: Cellular and Molecular Biology, edited by F. C. Neidhardt and R. Curtiss. ASM Press, Washington, DC.
- Seigneur, M., S. D. Ehrlich and B. Michel, 1999. recD sbcB sbcD mutants are deficient in recombinational repair of UV lesions by RecBC. J. Bacteriol. 181: 6220–6221. [DOI] [PMC free article] [PubMed] [Google Scholar]
- Shapiro, J. A., 1992. Pattern and control in bacterial colony development. Sci. Prog. 76: 399–424. [PubMed] [Google Scholar]
- Storz, G., and R. Hengge-Aronis, 2000 Bacterial Stress Responses. ASM Press, Washington, DC.
- Storz, G., and J. A. Imlay, 1999. Oxidative stress. Curr. Opin. Microbiol. 2: 188–194. [DOI] [PubMed] [Google Scholar]
- Viswanathan, M., V. Burdett, C. Baitinger, P. Modrich and S. T. Lovett, 2001. Redundant exonuclease involvement in Escherichia coli methyl-directed mismatch repair. J. Biol. Chem. 276: 31053–31058. [DOI] [PubMed] [Google Scholar]
- Zheng, M., X. Wang, L. J. Templeton, D. R. Smulski, R. A. LaRossa et al., 2001. DNA microarray-mediated transcriptional profiling of the Escherichia coli response to hydrogen peroxide. J. Bacteriol. 183: 4562–4570. [DOI] [PMC free article] [PubMed] [Google Scholar]