Abstract
Colias eurytheme and C. philodice are sister species with broad sympatry in North America. They hybridize frequently and likely share a significant portion of their genomes through introgression. Both taxa have been ecologically well characterized and exploited to address a broad spectrum of evolutionary issues. Using AFLP markers, we constructed the first linkage map of Colias butterflies. The map is composed of 452 markers spanning 2541.7 cM distributed over 51 linkage groups (40 major groups and 11 small groups with 2–4 markers). Statistical tests indicate that these AFLP markers tend to cluster over the map, with the coefficient of variation of interval sizes being 1.236 (95% C.I. is 1.234–1.240). This nonrandom marker distribution can account for the nonequivalence between the number of linkage groups and the actual haploid chromosome number (N = 31). This study presents the initial step for further marker-assisted research on Colias butterflies, including QTL and introgression analyses. Further investigation of the genomes will help us understand better the roles of introgression and natural selection in the evolution of hybridizing species and devise more appropriate strategies to control these pests.
THE sulfur butterflies, Colias philodice and C. eurytheme (Pieridae), are economic pests of alfalfa and clover crops. They are sympatric and widely distributed over large areas of the United States and Southern Canada (Ferris and Brown 1981; Opler 1992). These two butterflies can be distinguished easily by their wing color (wings of C. philodice are yellow, whereas those of C. eurytheme are orange). They also differ in several other traits including body size, the size of outer wing band, male ultraviolet reflectance pattern, pheromone production, and female mating preferences (Silberglied and Taylor 1973, 1978; Grula and Taylor 1979, 1980a,b). Remarkably, almost all of these traits map genetically to the X chromosome (Grula and Taylor 1979, 1980a,b). This so-called “large X-effect” may play a major role in the evolution of Lepidoptera, in which females are the heterogametic (XY; often referred to as ZW) sex (Sperling 1994; Prowell 1998).
Colias butterflies have drawn researchers' attention for decades, especially in the field of evolutionary and functional ecology. Much is known of their basic biology, including population ecology (Watt et al. 1977, 1979; Tabashnik 1980), phylogenetic relationships (Brunton 1998; Pollock et al. 1998), thermoregulation (Kingsolver 1983; Kingsolver and Watt 1983, 1984; Tsuji et al. 1986), seasonal and spatial variation (Hoffmann 1974, 1978; Ellers and Boggs 2002), oviposition behavior (Stern and Smith 1960; Stanton 1979, 1982, 1984), larval ecology (Ae 1958; Sherman and Watt 1973), mating system (Gerould 1946; Hovanitz 1949; Silberglied and Taylor 1973; Graham et al. 1980; Grula et al. 1980; Grula and Taylor 1980b; Rutowski 1980; Boggs and Watt 1981; Rutowski et al. 1981; Marshall 1982a,b), and adaptation at allozyme loci (Watt 1977, 1983, 1992; Watt et al. 1983, 1985; Carter and Watt 1988). These studies of Colias have melded ecology, genetics, and physiology and have significantly contributed to our understanding of natural selection and adaptation in field settings.
One important feature of Colias butterflies is that several sympatric species pairs, including C. philodice and C. eurytheme, hybridize wherever they are found together (Gerould 1946; Taylor 1972). Although this species pair generally has strong assortative mating, driven largely by female mate choice (Silberglied and Taylor 1978; Grula and Taylor 1980b), hybridization occurs when females, right after eclosing, have not hardened sufficiently to reject heterospecific males (Taylor 1972; Silberglied and Taylor 1978). Hybridization rate is therefore density dependent, increasing to near random at high densities (Taylor 1972). At more typical densities, hybrids constitute ∼2–10% of the combined natural population. Laboratory studies showed F1 intercross families usually have lower fitness, which rebounds in most F2 and backcross families (Grula and Taylor 1980b). These results clearly demonstrate that a pathway exists for introgression, allowing the sharing of neutral and adaptive traits between the taxa. The Colias system, therefore, offers a great opportunity to study the roles of introgression and selection in the organization of closely related genomes.
Although Colias butterflies have been studied for nearly a century and have already been ecologically well characterized, information about nuclear DNA markers, the molecular basis of their species-diagnostic traits, and genetic linkage is still lacking. Amplified fragment length polymorphism (AFLP; Vos et al. 1995), a powerful DNA marker system that has recently gained attention (reviewed by Blears et al. 1998; Mueller and Wolfenbarger 1999), presents an ideal method to study less-known organisms such as Colias. This PCR-based technique is highly reliable and informative, allowing a large number of DNA markers to be generated rapidly with no prior knowledge of DNA sequence. AFLP markers are highly reproducible, with low between-laboratory errors (Jones et al. 1997), and effective in a wide range of organisms. The method has been applied broadly in a variety of studies and proven useful for resolving genetic differences and relatedness among not only individuals or populations, but also independently evolving lineages, especially closely related taxa (Mueller and Wolfenbarger 1999).
The goal of our study was to develop polymorphic AFLP markers and build a comprehensive linkage map of C. eurytheme and C. philodice. We performed the linkage mapping on the basis of a backcross design, given the feasibility of obtaining large F1 and backcross families. Such an interspecific map serves as the foundation for a simultaneous analysis of both genomes. It will allow us to identify markers exhibiting strong species differentiation and to locate genes involved in maintaining species identity. This study provides the initial step toward carrying out further marker-assisted genetic and population studies on a genome-wide basis, which will help us better understand roles of ecological forces and natural selection in the population dynamics of these economic pests and the evolution of adaptive genetic variation.
MATERIALS AND METHODS
Insect materials:
Our genetic analysis was performed on a backcross (BC) family since backcross designs give the best resolution for assessing dominant marker frequencies (Hawthorne 2001; Tan et al. 2001) and therefore yield the most reliable maps. In addition, the F2 method suggested by Yasukochi (1998) is not valid here since, unlike many other Lepidopteran species, female Colias do recombine (Carter and Watt 1988) and therefore maternal-derived markers do not give the chromosome print as seen in silkworm mapping studies. Populations of C. eurytheme and C. philodice were established from wild females collected locally at Amherst and Sunderland, Massachusetts. Individuals from pure-breeding families of the two species were hybridized to produce F1 families. One of the F1 males (of eurytheme female × philodice male) was crossed to a virgin C. eurytheme female to generate the BC1 population for mapping. The offspring were reared in petri dishes supplied with fresh-cut alfalfa as a food source. The rearing conditions were 27° with a photoperiod of 14 L:10 D. Adult butterflies were frozen right after they emerged and kept at −80° until DNA isolation. A total of 58 backcross individuals (31 females and 27 males) were genotyped using the AFLP method. This number was found to be suitable for linkage analysis with a sufficient level of statistical confidence (Ky et al. 2000; Tan et al. 2001).
AFLP analysis:
Genomic DNA was isolated using a modified CTAB method as described by Del Sal et al. (1989) and Gustincich et al. (1991). The DNA was purified by extraction with phenol/chloroform, precipitated by ethanol, and resuspended in TE buffer (10 mm Tris-HCl, pH 8.0, 1 mm EDTA). AFLP analysis was conducted according to the procedures and reaction conditions described by Vos et al. (1995) with modifications as described below.
Restriction/ligation reactions were performed in an 11-μl single-tube reaction with 250 ng of genomic DNA, 0.5 units of MseI, 5 units of EcoRI, 4 units of T4 DNA ligase (New England Biolabs, Beverly, MA), 4.5 μm MseI adapter, 0.45 μm EcoRI adapter, 0.05 mg/ml BSA, 50 mm NaCl, and T4 ligase buffer (50 mm Tris-HCl, 10 mm MgCl2, 10 mm DTT, 1 mm ATP, and 25 μg/ml BSA) for 3 hr at 37°. Preamplifications were run in 20-μl reactions containing 3 μl of the diluted (1:4) restriction/ligation product, 300 mm of both primer EcoRI+A and primer MseI+C, 1 unit Taq polymerase, 0.2 mm dNTPs, and PCR buffer (15 mm MgCl2, 500 mm KCl, and 100 mm Tris-HCl, pH 8.3). The cycling conditions for preamplifications were 20 cycles of 94° for 30 sec, 56° for 30 sec, and 72° for 2 min. Selective amplifications were run in 20-μl reactions containing 3 μl of the diluted (1:10) preamplification reaction product, 50 mm of EcoRI+3 primer (labeled with fluorescent dyes), 250 mm of MseI+3 primer, 1 unit AmpliTaq Gold polymerase (Applied Biosystems, Foster City, CA), 0.2 mm dNTPs, and GeneAmp PCR buffer (15 mm MgCl2, 500 mm KCl, 100 mm Tris-HCl, pH 8.3, and 0.01% w/v gelatin). Selective PCR conditions were 10 cycles of 94° for 30 sec, 65° (−1°/cycle) for 30 sec, and 72° for 2 min followed by 35 cycles of 94° for 30 sec, 56° for 30 sec, and 72° for 2 min. All PCR reactions were carried out in a Perkin Elmer thermocycler 9700 (Applied Biosystems). PCR products from three primer pairs labeled with different dyes were pooled and analyzed on a 96-lane sequencing gel using an ABI Prism 377 DNA sequencer (Applied Biosystems).
Genotype analysis:
AFLP gels were visualized and analyzed using GeneScan software v. 2.1 (Applied BioSystems). Fragment size data were downloaded and sorted using BinThere software (N. Garnhart, University of New Hampshire). All the data points were then checked manually to match the corresponding bands on the gel. Misassigned data were corrected and ambiguous fragments were counted as missing data. Therefore, all markers were ultimately scored as presence (+) or absence (−) of the amplification (band), or unknown (missing data).
AFLP markers were sorted into three categories with independent segregation patterns: (1) amplification present only in the mother (C. eurytheme), (2) amplification present only in the father (F1 hybrid), and (3) amplification found in both parents. Results of linkage analysis using markers from only the second category are reported here since those markers give the linkage of both autosomes and the X chromosome (in Lepidoptera, females are the heterogametic sex) and thus give the best representation of the genome. Information on other markers and their linkage will be provided by the authors upon request.
Linkage map construction:
Segregating AFLP markers were tested for deviation from expected 1:1 segregation ratios by chi-square analysis (P < 0.05), with significance levels corrected for multiple comparisons (Rice 1989). AFLP data showing no significant deviation were used to calculate linkage. Their segregation type was coded as backcross with the banded genotype as heterozygous (H) and nonbanded as homozygous recessive (A). Linkage analysis was performed using the mapping software MapMaker/Exp v. 3.0 (Lander et al. 1987) and confirmed using Map Manager QTX (Manly et al. 2001). Linkage was determined with the criteria of LOD ≥ 3.0 (P = 0.001 for Map Manager QTX) and a maximum recombination fraction of 0.35 (see Lander et al. 1987; Beckmann 1994; and Liu 1997 for discussion of the criteria used). Marker orders were estimated using the Kosambi (1944) mapping function. To study the marker distribution along the map, we used the chi-square test for goodness of fit as described by Rouppe van der Voort et al. (1997) to test if the AFLP markers were randomly distributed within a linkage group. We also used the Kolmogorov-Smirnov and Lilliefors one-sample test (Kolmogoroff 1941; Lilliefors 1967) (on standardized data) to compare the distribution of marker intervals between consecutive loci along the map against the null expectation that they follow a normal distribution.
RESULTS AND DISCUSSION
AFLP genotypes and segregation distortion:
A total of 1871 AFLP bands ranging from 65 to 600 bp (mostly between 100 and 300 bp) were scored within the backcross family. A total of 64 primer combinations were used, which gave an average of 29 bands per primer combination. Reactions with several pairs of primers produced >40 bands, but one reaction (ACC/CTC) gave only seven markers (Table 1). The AFLP marker system generally shows a high multiplex ratio. The number of amplified products generated in a single reaction, however, depends on the number of selective nucleotides, type of labels, and the combination of the primers used (Lin et al. 1996, 1997; Han et al. 1999; Liu et al. 2003). It also varies among organisms since the multiplex ratio is affected by the genome size, the GC content of the genomic DNA, and the rates of substitutional variation (Lin et al. 1996; Primrose 1998).
TABLE 1.
AFLP primer combinations used, number of markers generated with each primer combination, and number of polymorphic markers selected for linkage analysis (in parentheses)
|
MseI
|
||||||||||
|---|---|---|---|---|---|---|---|---|---|---|
| CAA | CAC | CAG | CAT | CTA | CTC | CTG | CTT | Total | ||
| AAC | 50 (9) | 37 (12) | 40 (8) | 37 (6) | 37 (10) | 27 (9) | 40 (6) | 29 (6) | 297 (66) | |
| AAG | 47 (5) | 33 (9) | 23 (4) | 48 (13) | 36 (9) | 25 (7) | 27 (3) | 47 (13) | 286 (63) | |
| ACA | 62 (24) | 27 (7) | 18 (6) | 49 (16) | 47 (17) | 21 (8) | 39 (6) | 21 (10) | 284 (94) | |
| EcoRI | ACC | 17 (3) | 22 (6) | 31 (11) | 13 (3) | 23 (4) | 7 (1) | 15 (3) | 19 (7) | 147 (38) |
| ACG | 25 (5) | 36 (11) | 24 (8) | 15 (4) | 32 (6) | 30 (8) | 16 (4) | 21 (5) | 199 (51) | |
| ACT | 50 (8) | 24 (13) | 22 (5) | 34 (8) | 42 (11) | 15 (3) | 26 (6) | 29 (7) | 242 (61) | |
| AGC | 44 (14) | 22 (3) | 12 (4) | 48 (11) | 17 (4) | 25 (7) | 33 (7) | 38 (8) | 239 (58) | |
| AGG | 20 (6) | 16 (3) | 21 (3) | 33 (5) | 19 (4) | 23 (8) | 25 (8) | 20 (2) | 177 (39) | |
| Total | 315 (74) | 217 (64) | 191 (49) | 277 (66) | 253 (65) | 173 (51) | 221 (43) | 224 (58) | 1871 (470) | |
Only 3′-end selective nucleotides of the primers are shown.
A total of 1242 bands (69.3%) showed presence/absence of polymorphisms, indicating a substantial amount of molecular variation. High levels of polymorphism were previously observed at several allozyme loci within wild Colias populations, also suggesting Colias are highly polymorphic (Burns and Johnson 1967; Watt et al. 1985; Watt 1992). Among those polymorphic AFLP markers, 510 followed amplification pattern 2, with father banded and mother unbanded. Of these, 470 showed no deviation from the expected 1:1 ratio and were selected for the linkage analysis. For each primer combination, the number of bands used for mapping varied from 1 to 24 (Table 1), with an average of 7 mappable bands per primer combination.
The overall frequency of our AFLP loci showing segregation distortions was ∼12% (149/1242), lower than the rate reported between strains in silkworm (Tan et al. 2001). Skewed segregation ratios have been observed commonly in AFLP loci, but the frequency of distorted loci is highly variable (Kocher et al. 1998; Virk et al. 1998; Ky et al. 2000; Katengam et al. 2002; Liu et al. 2003). Segregation distortion of AFLPs can be caused by comigrating fragment complexes, linkage to lethal genes, variations in genomic DNA isolation, or simply vagaries of PCR (Virk et al. 1998; Nikaido et al. 1999; Ky et al. 2000; Tan et al. 2001). Lack of modifiers to suppress meiotic drive in hybrids might also be responsible for some of the distortions observed in interspecific crosses (Dermitzakis et al. 2000; Schwarz-Sommer et al. 2003; Wilkinson et al. 2003). In Colias butterflies, this scenario is perhaps less likely to occur since the genomes of these two species are homogenized by frequent hybridization. Introgression and high similarity between the two species may also account for the low distortion rate we observed.
Genetic linkage map:
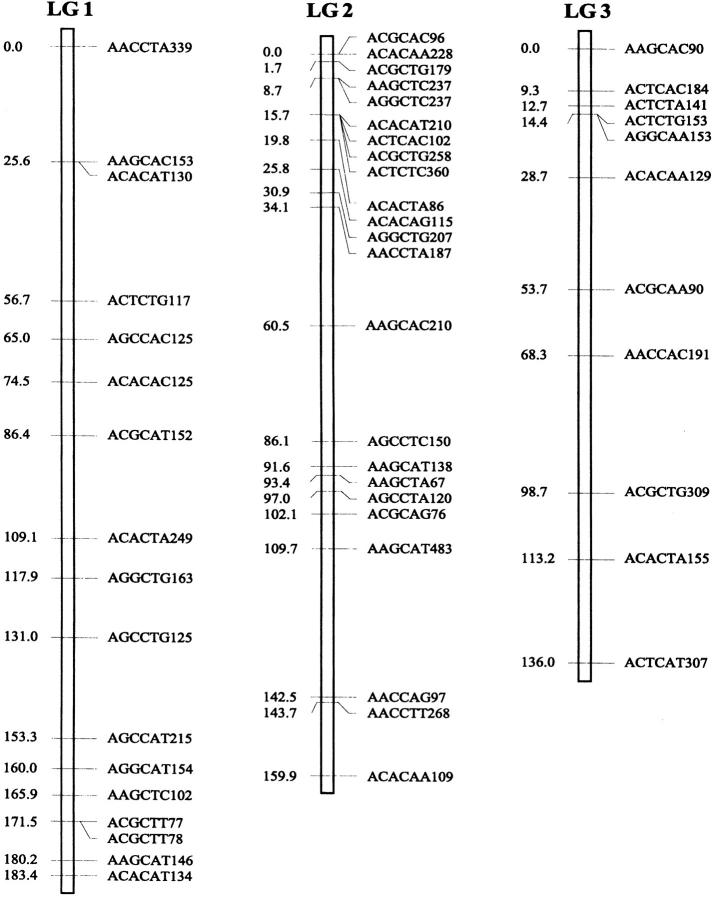
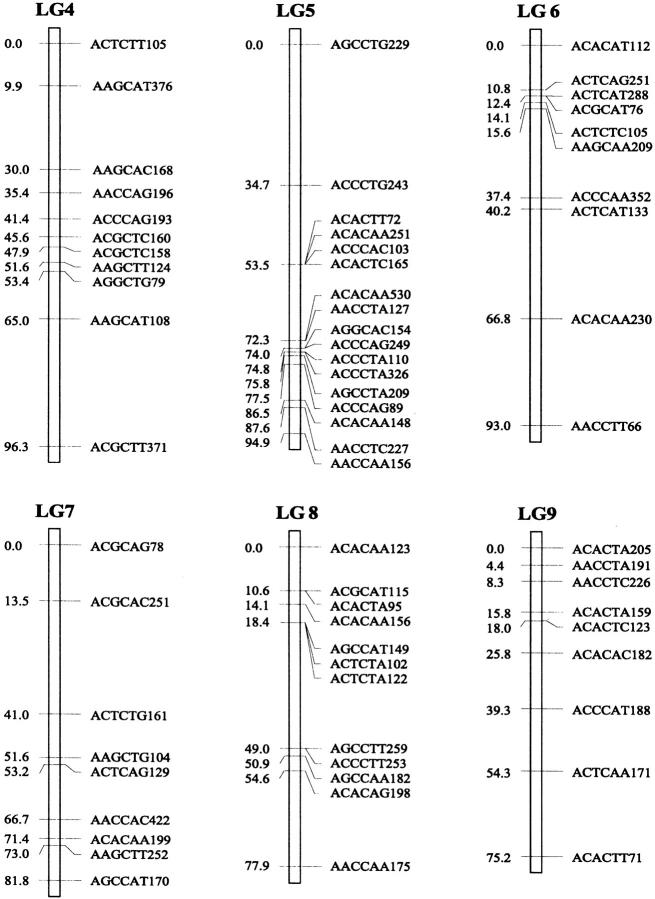
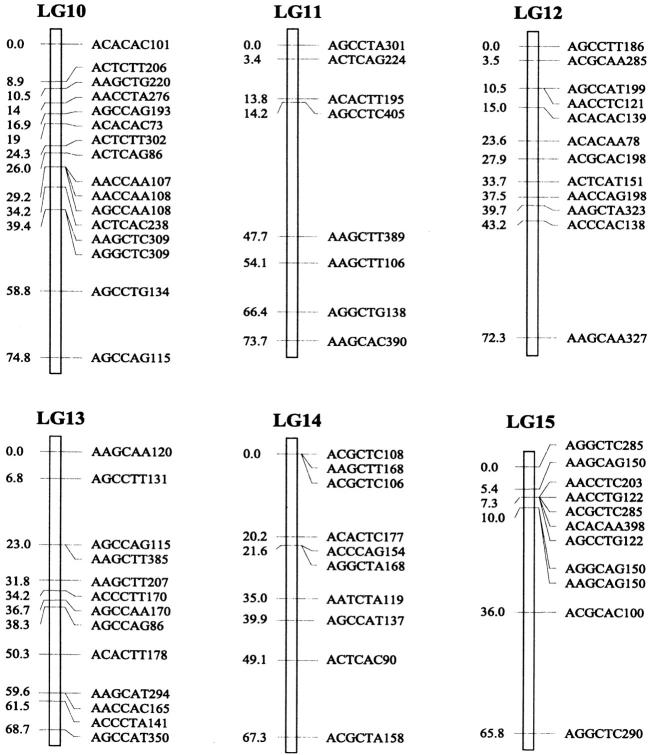
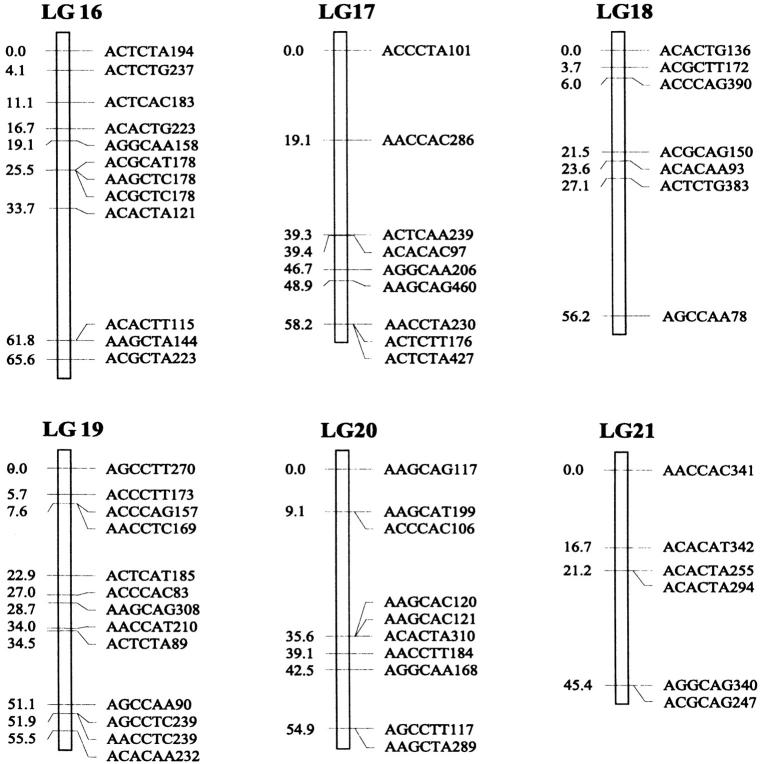
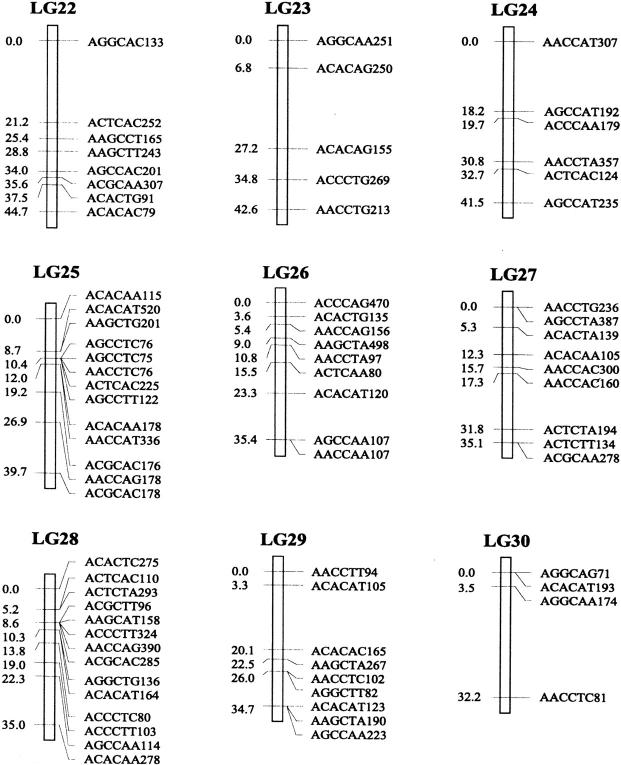
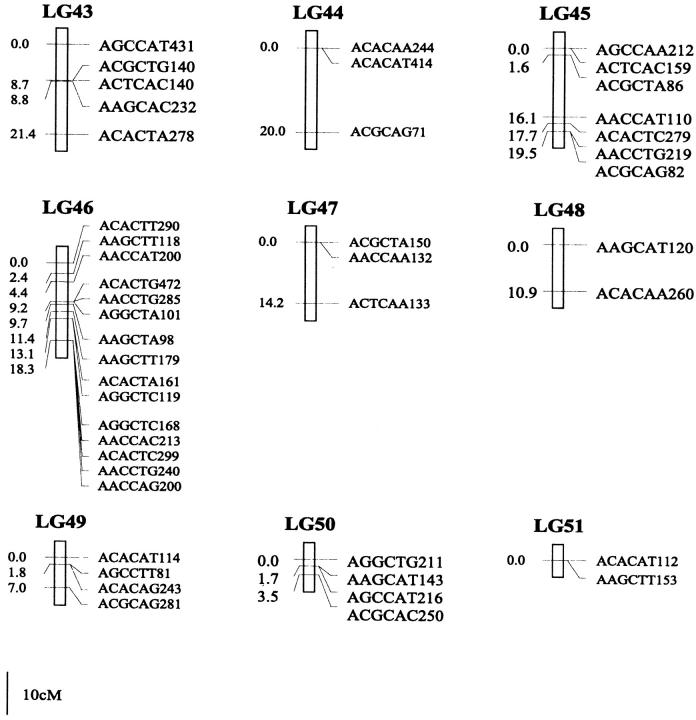
Of the 470 segregating markers tested, 452 (96%) showed detectable linkage to another polymorphism, and 18 markers remained unassigned. The final linkage map comprised 51 linkage groups (Figure 1), encompassing a total of 2541.7 cM. Our linkage groups ranged in size from 0 to 183.4 cM (mean, 49.8 cM). The number of AFLP markers per group varied from 2 to 23, with an average of 9 markers. There were 40 major linkage groups with 5–21 markers and 11 small groups with <5 markers. The mean distance between adjacent loci was 6.3 cM (±0.4). There were seven gaps >30 cM in length distributed among 7 linkage groups. The longest was 34.7 cM on linkage group 37, approaching the maximum recombination fraction of 0.35.
Figure 1.—
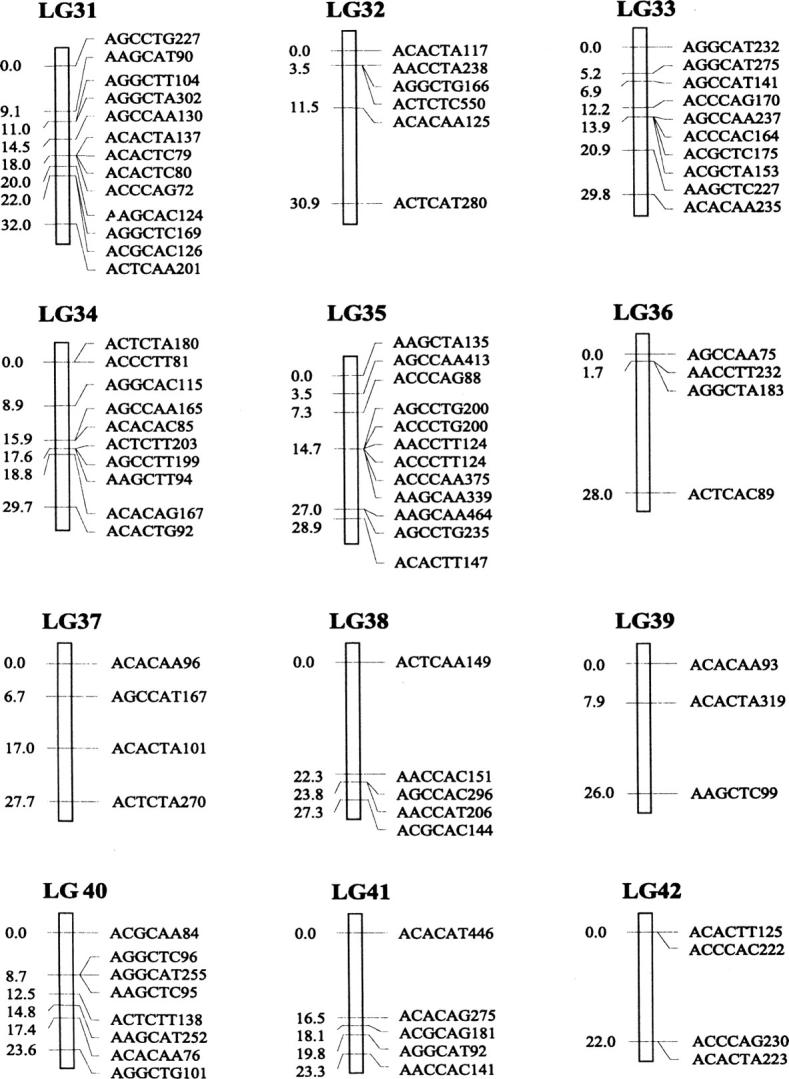
Linkage map of Colias butterflies constructed from 58 backcross hybrids derived from the interspecific cross [eurytheme × (eurytheme × philodice)]. A total of 452 AFLP markers are described in terms of the selective nucleotides used and the fragment size; for example, AACCTA339—the EcoRI primer (AAC), the MseI primer (CTA), and the size of the band (339 bp). Recombination distances from the origin (in centimorgans) are given on the left side of each linkage group (LG) and marker names are to the right.
The genome of C. eurytheme and C. philodice is characterized by numerous small chromosomes, often similar in size (Maeki and Remington 1960; Grula and Taylor 1980b). Mapping genomes that have a large number of chromosomes is often difficult (Yasukochi 1998; Liu et al. 2003). Both taxa have a haploid number of 31, typical of the Lepidoptera (Remington 1954; Maeki and Remington 1960), but much smaller than our AFLP map of 51 linkage groups. Obviously, some of the linkage groups are located on the same chromosomes and large gaps exist between those groups; additional markers are needed to bridge those gaps. Matching the linkage group number to a high chromosome number usually requires many more markers or a combination of dominant and codominant markers (Yasukochi 1998). In some cases, an insufficient number of markers may still give a similar number of linkage groups to the actual chromosomal number, but likely without one-to-one correspondence due to missing information on a subset of the chromosomes.
Since our linkage map contains 20 linkage groups more than the actual haploid chromosomal number, the complete recombination length of the genome should be higher than the map length (2541.7 cM) after adding the flanking regions of the extra linkage groups. This accounts for at least an additional 700 cM (20 LGs × 35 cM/LG). Therefore, it seems that the total recombination length of Colias is substantially higher than that of the silkworm, which was estimated to be ∼2000 cM (Yasukochi 1998). The longer length shown in Colias may reflect a larger genome size or, we suspect, higher rates of crossing over than in silkworm. High rates of recombination in some regions of the genome may also generate large gaps, causing markers on the same chromosomes to be spuriously assigned to two or more linkage groups.
AFLP marker distribution:
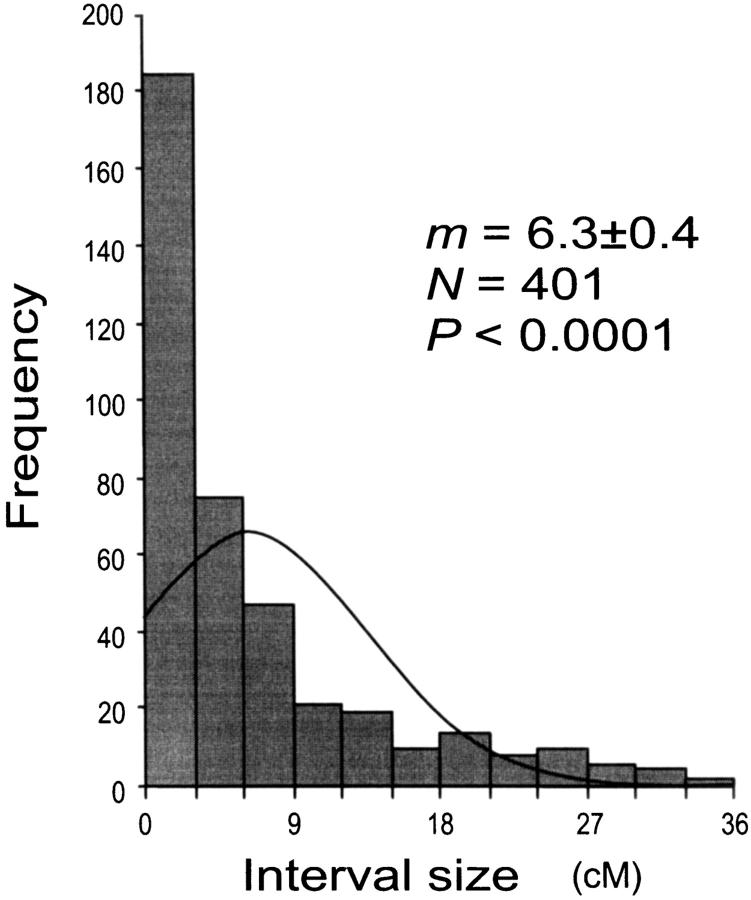
Our AFLP markers placed on the linkage map deviated significantly from a random distribution as suggested by two different statistical tests. Clustering of AFLP markers on linkage groups 2, 15, and 25 was revealed by the chi-square test for goodness of fit (P ≤ 0.05). The test, however, is effective only for groups with >10 markers, which is not the case for a majority of our linkage groups. Therefore, clustering of our AFLP markers may occur more frequently than shown by the test. The Kolmogorov-Smirnov and Lilliefors one-sample test indicated that the distribution of intervals between consecutive markers significantly deviated from a normal distribution (P ≤ 0.001, Figure 2). The coefficient of variation of interval sizes was 1.236 (95% C.I. is 1.234–1.240, calculated using a jackknife method), >1. This also suggests our AFLP markers were not distributed at random but aggregated spatially over the map.
Figure 2.—
Size distribution of linkage intervals between two successive markers in the interspecific linkage map of Colias butterflies. m, mean distance between adjacent markers ±SE; N, number of intervals; P, probability in the Kolmogorov-Smirnov and Lilliefors one-sample test (on standardized data) to compare the distribution of marker intervals against the null expectation of a normal distribution.
AFLP markers tend to cluster around regions where recombination is suppressed, usually corresponding to centromere and telomere regions (Tanksley et al. 1992; Rouppe van der Voort et al. 1997; Alonso-Blanco et al. 1998; Qi et al. 1998; Miklas et al. 2001). Since Lepidopteran chromosomes are holocentric (centromeres spread over >70% of the genome; Murakami and Imai 1974; Padhy 1986; Marec et al. 2001), dense clusters are expected to be observed in large portions of the map if suppressed recombination occurs at the centromeric regions. To obtain a saturated map of a 3000-cM genome (probability of coverage, 0.95), only 279 polymorphic markers would be needed if they were randomly distributed (Krutovskii et al. 1998). But for markers that are not distributed at random, a substantially higher number is required to achieve the same level of coverage. Therefore, it is not surprising that with 470 markers placed on the Colias map, we still observed a large number of gaps, causing our number of linkage groups to be more than the actual number of chromosomes.
Perspectives:
Our AFLP map of Colias butterflies is one of the few linkage maps that have been reported in Lepidoptera. Although this order represents an extremely diverse and economically important group of insects, mapping studies have been conducted only in the silkworm, Bombyx mori. Several highly saturated linkage maps (Doira 1992; Yasukochi 1998; Tan et al. 2001) and a draft whole-genome sequence (Mita et al. 2004) of the silkworm have been published. Mapping studies are currently ongoing in at least two other groups of Lepidoptera (McMillan et al. 2002), which will further increase our knowledge about lepidopteran genomes.
This study presents the starting point for further molecular-based research on Colias butterflies. The map builds the foundation for thoroughly exploring the entire genome represented by a large number of mapped AFLP markers. It creates a framework for anchoring morphological or other molecular markers and identifying quantitative trait loci (QTL) for taxon-diagnostic, geographically varying, and economically important traits. This map also can be utilized to locate genes of interest and to develop DNA probes, SNPs, STS/expressed sequence tags, or other codominant DNA markers with a wider range of applications. Further investigation of the Colias genome will allow us to identify factors that maintain their species integrity, to understand the trade-offs between introgression and adaptation, and to measure quantitatively the species boundary. Ultimately, it will help us to predict the population and evolutionary dynamics of these hybridizing agricultural pests and design more appropriate control strategies.
Acknowledgments
We thank G. Gibson, C. Jiggins, L. Katz, B. Normark, and W. Watt for helpful discussions and critical reading of the manuscript. We also thank M. Henshaw for providing AFLP technical assistance, E. Levin and M. Sei for assisting with butterfly rearing, and an anonymous reviewer for additional constructive suggestions. This work was supported by grants from the National Science Foundation (DEB-0129234) and the U.S. Department of Agriculture, Cooperative State Research Extension and Education Service, awarded through the Massachusetts Agricultural Experiment Station under project no. MAS00789, paper no. 3345.
References
- Ae, S. A., 1958. Comparative studies of the developmental rates, hibernation, and food plants in North American Colias (Lepidoptera, Pieridae). Am. Midl. Nat. 60: 84–96. [Google Scholar]
- Alonso-Blanco, C., A. J. M. Peeters, M. Koornneef, C. Lister, C. Dean et al., 1998. Development of an AFLP based linkage map of Ler, Col and Cvi Arabidopsis thaliana ecotypes and construction of a Ler/Cvi recombinant inbred line population. Plant J. 14: 259–271. [DOI] [PubMed] [Google Scholar]
- Beckmann, J., 1994 Genetic mapping, an overview, pp. 75–84 in Computational Methods in Genome Research, edited by S. Suhai. Plenum Press, New York.
- Blears, M. J., S. A. de Grandis, H. Lee and J. T. Trevors, 1998. Amplified fragment length polymorphism (AFLP): a review of the procedure and its applications. J. Ind. Microbiol. Biotechnol. 21: 99–114. [Google Scholar]
- Boggs, C. L., and W. B. Watt, 1981. Population structure of pierid butterflies. IV. Genetic and physiological investment in offspring by male Colias. Oecologia 50: 320–324. [DOI] [PubMed] [Google Scholar]
- Brunton, C. F., 1998. The evolution of ultraviolet patterns in European Colias butterflies (Lepidoptera, Pieridae): a phylogeny using mitochondrial DNA. Heredity 80: 611–616. [Google Scholar]
- Burns, J. M., and F. M. Johnson, 1967. Esterase polymorphism in natural populations of a sulfur butterfly, Colias eurytheme. Science 156: 93–97. [DOI] [PubMed] [Google Scholar]
- Carter, P. A., and W. B. Watt, 1988. Adaptation at specific loci. V. Metabolically adjacent enzyme loci may have very distinct experiences of selective pressures. Genetics 119: 913–924. [DOI] [PMC free article] [PubMed] [Google Scholar]
- Del Sal, G., G. Manfioletti and C. Schneider, 1989. The CTAB-DNA precipitation method: a common mini-scale preparation of template DNA from phagemids, phages or plasmids suitable for sequencing. Biotechniques 7: 514–520. [PubMed] [Google Scholar]
- Dermitzakis, E. T., J. P. Masly, H. M. Waldrip and A. G. Clark, 2000. Non-Mendelian segregation of sex chromosomes in heterospecific Drosophila males. Genetics 154: 687–694. [DOI] [PMC free article] [PubMed] [Google Scholar]
- Doira, H., 1992 Genetical Stocks and Mutations of Bombyx mori: Important Genetic Resources. Linkage Maps and List of Genetical Stocks Maintained in Kyushu University. Institute of Genetic Resources, Kyushu University, Fukuoka, Japan.
- Ellers, J., and C. L. Boggs, 2002. The evolution of wing color in Colias butterflies: heritability, sex-linkage, and population divergence. Evolution 56: 836–840. [DOI] [PubMed] [Google Scholar]
- Ferris, C. D., and F. M. Brown, 1981 Butterflies of the Rocky Mountain States. University of Oklahoma Press, Norman, OK.
- Gerould, J. H., 1946. Hybridization and female albinism in Colias philodice and C. eurytheme. A New Hampshire survey in 1943 with subsequent data. Ann. Entomol. Soc. Am. 39: 383–396. [Google Scholar]
- Graham, S. M., W. B. Watt and L. F. Gall, 1980. Metabolic resource allocation vs. mating attractiveness: adaptive pressures on the “alba” polymorphism of Colias butterflies. Proc. Natl. Acad. Sci. USA 77: 3615–3619. [DOI] [PMC free article] [PubMed] [Google Scholar]
- Grula, J. W., and O. R. Taylor, Jr., 1979. The inheritance of pheromone production in the sulfur butterflies, Colias eurytheme and C. philodice. Heredity 42: 359–371. [Google Scholar]
- Grula, J. W., and O. R. Taylor, Jr., 1980. a Some characteristics of hybrids derived from the sulfur butterflies, Colias eurytheme and C. philodice: phenotypic effects of the X-chromosome. Evolution 34: 673–687. [DOI] [PubMed] [Google Scholar]
- Grula, J. W., and O. R. Taylor, Jr., 1980. b The effect of X-chromosome inheritance on mate-selection behavior in the sulfur butterflies, Colias eurytheme and C. philodice. Evolution 34: 688–695. [DOI] [PubMed] [Google Scholar]
- Grula, J. W., J. D. McChesney and O. R. Taylor, Jr., 1980. Aphrodisiac pheromones of the sulfur butterflies Colias eurytheme and C. philodice (Lepidoptera, Pieridae). J. Chem. Ecol. 6: 241–256. [Google Scholar]
- Gustincich, S., G. Manfioletti, G. Del Sal, C. Schnider and P. Carninci, 1991. A fast method for high-quality genomic DNA extraction from whole human blood. Biotechniques 11: 298–302. [PubMed] [Google Scholar]
- Han, T. H., H. J. van Eck, M. J. De Jeu and E. Jacobsen, 1999. Optimization of AFLP fingerprinting of organisms with a large-sized genome: a study on Alstroemeria spp. Theor. Appl. Genet. 98: 465–471. [Google Scholar]
- Hoffmann, R. J., 1974. Environmental control of seasonal variation in the butterfly Colias eurytheme: effects of photoperiod and temperature on pteridine pigmentation. J. Insect Physiol. 20: 1913–1924. [DOI] [PubMed] [Google Scholar]
- Hoffmann, R. J., 1978. Environmental uncertainty and evolution of physiological adaptation in Colias butterflies. Am. Nat. 112: 999–1015. [Google Scholar]
- Hovanitz, W., 1949. Interspecific matings between Colias eurytheme and Colias philodice in wild populations. Evolution 3: 170–173. [DOI] [PubMed] [Google Scholar]
- Hawthorne, D. J., 2001. AFLP-based genetic linkage map of the Colorado potato beetle Leptinotarsa decemlineata: sex chromosomes and a pyrethroid-resistance candidate gene. Genetics 158: 695–700. [DOI] [PMC free article] [PubMed] [Google Scholar]
- Jones, C. J., K. J. Edwards, S. Castaglione, M. O. Winfield, F. Sala et al., 1997. Reproducibility testing of RAPD, AFLP and SSR markers in plants by a network of European laboratories. Mol. Breed. 3: 381–390. [Google Scholar]
- Katengam, S., J. M. Crane and S. J. Knapp, 2002. The development of a genetic map for meadowfoam comprised of amplified fragment length polymorphisms. Theor. Appl. Genet. 104: 92–96. [DOI] [PubMed] [Google Scholar]
- Kingsolver, J. G., 1983. Thermoregulation and flight in Colias butterflies: elevational patterns and mechanistic limitations. Ecology 64: 534–545. [Google Scholar]
- Kingsolver, J. G., and W. B. Watt, 1983. Thermoregulatory strategies in Colias butterflies: thermal stress and the limits to adaptation in temporally varying environments. Am. Nat. 121: 32–55. [Google Scholar]
- Kingsolver, J. G., and W. B. Watt, 1984. Mechanistic constraints and optimality models: thermoregulatory strategies in Colias butterflies. Ecology 65: 1835–1839. [Google Scholar]
- Kocher, T. D., W.-J. Lee, H. Sobolewska, D. Penman and B. McAndrew, 1998. A genetic linkage map of a Cichlid fish, the Tilapia (Oreochromis niloticus). Genetics 148: 1225–1232. [DOI] [PMC free article] [PubMed] [Google Scholar]
- Kolmogoroff, A., 1941. Confidence limits for an unknown distribution function. Ann. Math. Stat. 12: 461–463. [Google Scholar]
- Kosambi, D. D., 1944. The estimation of map distances from recombination values. Ann. Eugen. 12: 172–175. [Google Scholar]
- Krutovskii, K. V., S. S. Vollmer, F. C. Sorensen, W. T. Adams, S. J. Knapp et al., 1998. RAPD genome maps of Douglas-fir. J. Hered. 89: 197–205. [Google Scholar]
- Ky, C. L., P. Barre, M. Lorieux, P. Trouslot, S. Akaffou et al., 2000. Interspecific genetic linkage map, segregation distortion and genetic conversion in coffee (Coffea sp.). Theor. Appl. Genet. 101: 669–676. [Google Scholar]
- Lander, E. S., P. Green, J. Abrahamson, A. Barlow, M. J. Daly et al., 1987. MAPMAKER: an interactive computer package of constructing primary genetic linkage maps of experimental and natural populations. Genomics 1: 174–181. [DOI] [PubMed] [Google Scholar]
- Lilliefors, H. W., 1967. On the Kolmogorov-Smirnov test for normality with mean and variance unknown. J. Am. Stat. Assoc. 62: 399–402. [Google Scholar]
- Lin, J.-J., J. Kuo and J. Ma, 1996. Effect of different primer combinations on the resolution of ALFP in plants with small genomes. Focus 18: 68–69. [Google Scholar]
- Lin, J.-J., J. Ma, M. Ambrose and J. Kuo, 1997. Chemiluminescent detection of AFLP fingerprints. Focus 19: 36–38. [Google Scholar]
- Liu, B. H., 1997 Statistical Genomics: Linkage, Mapping, and QTL Analysis. CRC Press, New York.
- Liu, Z., A. Karsi, P. Li, D. Cao and R. Dunham, 2003. An AFLP-based genetic linkage map of channel catfish (Ictalurus punctatus) constructed by using an interspecific hybrid resource family. Genetics 165: 687–694. [DOI] [PMC free article] [PubMed] [Google Scholar]
- Maeki, K., and C. L. Remington, 1960. Studies on the chromosomes of North American Rhopalocera. II. Hersperiidae, Megathymidae, and Pieridae. J. Lepid. Soc. 14: 37–57. [Google Scholar]
- Manly, K. F., R. H. Cudmore, Jr. and J. M. Meer, 2001. Map Manager QTX, cross-platform software for genetic mapping. Mamm. Genome 12: 930–932. [DOI] [PubMed] [Google Scholar]
- Marec, F., A. Tothová, K. Sahara and W. Traut, 2001. Meiotic pairing of sex chromosome fragments and its relation to atypical transmission of a sex-linked marker in Ephestia kuehniella (Insecta: Lepidoptera). Heredity 87: 659–671. [DOI] [PubMed] [Google Scholar]
- Marshall, L., 1982. a Male nutrient investment in the Lepidoptera: What nutrients should males invest? Am. Nat. 120: 273–279. [Google Scholar]
- Marshall, L., 1982. b Male courtship persistence in Colias philodice and C. eurytheme (Lepidoptera: Pieridae). J. Kans. Entomol. Soc. 55: 729–736. [Google Scholar]
- McMillan, W. O., A. Monteiro and D. D. Kapan, 2002. Development and evolution on the wing. Trends Ecol. Evol. 17: 125–133. [Google Scholar]
- Miklas, P. N., W. C. Johnson, R. Delorme and P. Gepts, 2001. QTL conditioning physiological resistance and avoidance to white mold in dry bean. Crop Sci. 41: 309–315. [Google Scholar]
- Mita, K., M. Kasahara, S. Sasaki, Y. Nagayasu, T. Yamada et al., 2004. The genome sequence of silkworm, Bombyx mori. DNA Res. 11: 27–35. [DOI] [PubMed] [Google Scholar]
- Mueller, U. G., and L. L. Wolfenbarger, 1999. AFLP genotyping and fingerprinting. Trends Ecol. Evol. 14: 389–394. [DOI] [PubMed] [Google Scholar]
- Murakami, A., and H. T. Imai, 1974. Cytological evidence of holocentric chromosomes of silkworms, Bombyx mori and B. mandarina, (Bombycidae, Lepidoptera). Chromosoma 47: 167–178. [DOI] [PubMed] [Google Scholar]
- Nikaido, A., H. Yoshimaru, Y. Tsumura, Y. Suyama, M. Murai et al., 1999. A segregation-distorting factor in AFLP mapping of Cryptomerica joponica. Gene Genet. Syst. 74: 55–59. [Google Scholar]
- Opler, R. A., 1992 A Field Guide to Eastern Butterflies. Houghton-Mifflin, New York.
- Padhy, K. B., 1986. Chromosome aberrations in the holocentric chromosomes of Philosamia ricini (Saturnidae). J. Res. Lepid. 25: 63–66. [Google Scholar]
- Pollock, D. D., W. B. Watt, V. K. Rashbrook and E. V. Iyengar, 1998. Molecular phylogeny for Colias butterflies and their relatives (Lepidoptera: Pieridae). Ann. Entomol. Soc. Am. 91: 524–531. [Google Scholar]
- Primrose, S. B., 1998 Principles of Genome Analysis. A Guide to Mapping and Sequencing DNA From Different Organisms. Blackwell Science, Oxford.
- Prowell, D. P., 1998 Sex linkage and speciation in Lepidoptera, pp. 309–319 in Endless Forms: Species and Speciation, edited by D. J. Howard and S. T. Berlocher. Oxford University Press, Oxford.
- Qi, X., P. Stam and P. Lindhout, 1998. Use of locus-specific AFLP markers to construct a high-density molecular map in barley. Theor. Appl. Genet. 96: 376–384. [DOI] [PubMed] [Google Scholar]
- Remington, C. L., 1954. The genetics of Colias (Lepidoptera). Adv. Genet. 6: 403–450. [DOI] [PubMed] [Google Scholar]
- Rice, W. R., 1989. Analyzing tables of statistical tests. Evolution 43: 223–225. [DOI] [PubMed] [Google Scholar]
- Rouppe van der Voort, J. N. A. M., P. van Zandvoort, H. J. van Eck, F. T. Folkertsma, R. C. B. Hutten et al., 1997. Use of allele specificity of comigrating AFLP markers to align genetic maps from different potato genotypes. Mol. Gen. Genet. 255: 438–447. [DOI] [PubMed] [Google Scholar]
- Rutowski, R. L., 1980. Male scent-producing structures in Colias butterflies: function, localization, and adaptive features. J. Chem. Ecol. 6: 13–26. [Google Scholar]
- Rutowski, R. L., C. E. Long, L. D. Marshall and R. S. Vetter, 1981. Courtship solicitation by Colias females (Lepidoptera: Pieridae). Am. Midl. Nat. 105: 334–340. [Google Scholar]
- Schwarz-Sommer, Z., E. de Andrade Silva, R. Berndtgen, W.-E. Lönnig, A. Müller et al., 2003. A linkage map of an F2 hybrid population of Antirrhinum majus and A. molle. Genetics 163: 699–710. [DOI] [PMC free article] [PubMed] [Google Scholar]
- Sherman, P. W., and W. B. Watt, 1973. Thermal ecology of some Colias butterfly larvae. J. Comp. Physiol. 83: 25–40. [Google Scholar]
- Silberglied, R. E., and O. R. Taylor, Jr., 1973. Ultraviolet differences between the sulfur butterflies, Coilas eurytheme and C. philodice, and a possible isolating mechanism. Nature 241: 406–408. [DOI] [PubMed] [Google Scholar]
- Silberglied, R. E., and O. R. Taylor, Jr., 1978. Ultraviolet reflectance and its behavioral role in the courtship of the sulfur butterflies, Coilas eurytheme and C. philodice (Lepidoptera, Pieridae). Behav. Ecol. Sociobiol. 3: 203–243. [Google Scholar]
- Sperling, F. A. H., 1994. Sex-linked genes and species differences in Lepidoptera. Can. Entomol. 126: 807–818. [Google Scholar]
- Stanton, M. L., 1979. The role of chemotactile stimuli in the oviposition preferences of Colias butterflies. Oecologia 39: 79–91. [DOI] [PubMed] [Google Scholar]
- Stanton, M. L., 1982 Searching in a patchy environment: foodplant selection by Colias p. eriphyle butterflies. Ecology 63: 839–853.
- Stanton, M. L., 1984. Short-term learning and the searching accuracy of egg-laying butterflies. Animal Behav. 32: 33–40. [Google Scholar]
- Stern, V. M., and R. F. Smith, 1960. Factors affecting egg production and oviposition in populations of Colias philodice eurytheme Boisduval (Lepidoptera: Pieridae). Hilgardia 29: 411–454. [Google Scholar]
- Tabashnik, B. E., 1980. Population structure of pierid butterflies. III. Pest populations of Colias philodice eriphyle. Oecologia 47: 175–183. [DOI] [PubMed] [Google Scholar]
- Tan, Y.-D., C. Wan, Y. Zhu, C. Lu, Z. Xiang et al., 2001. An amplified fragment length polymorphism map of the silkworm. Genetics 157: 1277–1284. [DOI] [PMC free article] [PubMed] [Google Scholar]
- Tanksley, S. D., M. W. Ganal, J. P. Prince and M. C. de-Vicente, M. W. Bonierbale et al., 1992. High density molecular linkage maps of the tomato and potato genomes. Genetics 132: 1141–1160. [DOI] [PMC free article] [PubMed] [Google Scholar]
- Taylor, O. R., Jr., 1972. Random vs. non-random mating in the sulfur butterflies, Coilas eurytheme and Colias philodice (Lepidoptera: Pieridae). Evolution 26: 344–356. [DOI] [PubMed] [Google Scholar]
- Tsuji, J. S., J. G. Kingsolver and W. B. Watt, 1986. Thermal physiological ecology of Colias butterflies in flight. Oecologia 69: 161–170. [DOI] [PubMed] [Google Scholar]
- Virk, P. S., B. V. Ford-Lloyd and H. J. Newbury, 1998. Mapping AFLP markers associated with subspecific differentiation of Oryza sativa (rice) and an investigation of segregation distortion. Heredity 81: 613–620. [Google Scholar]
- Vos, P, R. Hogers, M. Bleeker, M. Reijans, T. van de Lee et al., 1995. AFLP: a new technique for DNA fingerprinting. Nucleic Acids Res. 23: 4407–4414. [DOI] [PMC free article] [PubMed] [Google Scholar]
- Watt, W. B., 1977. Adaptation at specific loci. I. Natural selection on phosphoglucose isomerase of Colias butterflies: biochemical and population aspects. Genetics 87: 177–194. [DOI] [PMC free article] [PubMed] [Google Scholar]
- Watt, W. B., 1983. Adaptation at specific loci. II. Demographic and biochemical elements in the maintenance of the Colias PGI polymorphism. Genetics 103: 691–724. [DOI] [PMC free article] [PubMed] [Google Scholar]
- Watt, W. B., 1992. Eggs, enzymes, and evolution—natural genetic variants change insect fecundity. Proc. Natl. Acad. Sci. USA 89: 10608–10612. [DOI] [PMC free article] [PubMed] [Google Scholar]
- Watt, W. B., F. S. Chew, L. R. G. Snyder, A. G. Watt and D. E. Rothschild, 1977. Population structure of pierid butterflies. I. Numbers and movements of some montane Colias species. Oecologia 27: 1–22. [DOI] [PubMed] [Google Scholar]
- Watt, W. B., D. Han and B. E. Tabashnik, 1979. Population structure of pierid butterflies. II. A “native” population of Colias philodice eriphyle in Colorado. Oecologia 44: 44–52. [DOI] [PubMed] [Google Scholar]
- Watt, W. B., R. C. Cassin and M. S. Swan, 1983. Adaptation at specific loci. III. Field behavior and survivorship differences among Colias PGI genotypes are predictable from in vitro biochemistry. Genetics 103: 725–739. [DOI] [PMC free article] [PubMed] [Google Scholar]
- Watt, W. B., P. A. Carter and S. M. Blower, 1985. Adaptation at specific loci. IV. Differential mating success among glycolytic allozyme genotypes of Colias butterflies. Genetics 109: 157–175. [DOI] [PMC free article] [PubMed] [Google Scholar]
- Wilkinson, G. S., J. G. Swallow, S. J. Christensen and K. Madden, 2003. Phylogeography of sex ratio and multiple mating in stalk-eyed flies from southeast Asia. Genetica 117: 37–46. [DOI] [PubMed] [Google Scholar]
- Yasukochi, Y., 1998. A dense genetic map of the silkworm, Bombyx mori, covering all chromosomes based on 1018 molecular markers. Genetics 150: 1513–1525. [DOI] [PMC free article] [PubMed] [Google Scholar]


