

Abstract
Natural selection leaves its footprints on protein-coding sequences by modulating their silent and replacement evolutionary rates. In highly expressed genes in invertebrates, these footprints are seen in the higher codon usage bias and lower synonymous divergence. In mammals, the highly expressed genes have a shorter gene length in the genome and the breadth of expression is known to constrain the rate of protein evolution. Here we have examined how the rates of evolution of proteins encoded by the vertebrate genomes are modulated by the amount (intensity) of gene expression. To understand how natural selection operates on proteins that appear to have arisen in earlier and later phases of animal evolution, we have contrasted patterns of mouse proteins that have homologs in invertebrate and protist genomes (Precambrian genes) with those that do not have such detectable homologs (vertebrate-specific genes). We find that the intensity of gene expression relates inversely to the rate of protein sequence evolution on a genomic scale. The most highly expressed genes actually show the lowest total number of substitutions per polypeptide, consistent with cumulative effects of purifying selection on individual amino acid replacements. Precambrian genes exhibit a more pronounced difference in protein evolutionary rates (up to three times) between the genes with high and low expression levels as compared to the vertebrate-specific genes, which appears to be due to the narrower breadth of expression of the vertebrate-specific genes. These results provide insights into the differential relationship and effect of the increasing complexity of animal body form on evolutionary rates of proteins.
NATURAL selection acts on the molecular evolution of protein and DNA sequences in many different ways. Selection on mutations that do not alter amino acids (synonymous substitutions) is evident in the codon usage bias, which enhances the translational efficiency in invertebrates (Shields et al. 1988; Sharp and Li 1989; Powell and Moriyama 1997). The effect of selection exerted by the gene expression level is revealed by the negative relationship between transcript abundance and protein length in yeast (Coghlan and Wolfe 2000; Akashi 2003). This relationship is less clear in invertebrates (see contrasting findings in Duret and Mouchiroud 1999; Marais and Duret 2001; Castillo-Davis et al. 2002). However, a negative relationship between peptide length and expression level has been observed in humans (Eisenberg and Levanon 2003; Urrutia and Hurst 2003). This points to selection based on polypeptide length, in addition to the classic explanation of selection on individual amino acid sites to ensure protein function (Li 1997; Nei and Kumar 2000). Examination of the relationship of the rate of protein evolution and breadth (in terms of the number of tissues) of gene expression has revealed that the evolutionary rate is low for broadly expressed genes in humans (Duret and Mouchiroud 2000). Similarly, a negative relationship between gene expression level and protein evolution has been reported for some eukaryotic genomes (Pal et al. 2001; Krylov et al. 2003). This is consistent with a general expectation of having larger negative fitness effects of replacement changes in highly expressed genes.
However, how the rate of protein sequence evolution in vertebrates and other animals is modulated by the intensity of gene expression remains unknown. Furthermore, vertebrate genomes consist of a large number of genes with no discernible homology to genes from other animal phyla; e.g., 22% of human genes have no homologs in invertebrates and lower eukaryotes (Lander et al. 2001). Are there differences in patterns of the protein evolutionary rates of these putatively vertebrate-specific genes as compared to those that have descended from our Precambrian animal ancestor? The answer to this question may provide insight into the mechanisms responsible for evolution of animal complexity, because vertebrate-specific genes arose after the Cambrian explosion that led to an immense increase in the morphological complexities of animal body forms (Valentine 1994; Ohno 1996).
Here we report results from our examination of the relationships of protein evolution with the level of gene expression in human (Homo sapiens), mouse (Mus musculus), fugu (Takifugu rubripes), and fruit fly (Drosophila melanogaster). Complete genome sequences are available for these species and they represent major speciation events in the history of animal evolution (see review in Hedges and Kumar 2003). Our focus is on the amount of gene expression because genes expressed in large quantities will experience higher selective pressure (Pal et al. 2001). The relative intensity of gene expression is measured by the frequency of the expressed sequence tags (ESTs) of a given gene in the early stage embryonic libraries. Both vertebrate (mouse) and invertebrate (fruit fly) embryonic EST libraries were used to examine the congruence of patterns using data from independent and highly diverse species. Gene expression data from the embryonic stage are expected to be more comparable among diverse and distantly related species than the tissue-specific libraries. We also used high-density oligo-nucleotide array data from 45 mouse tissues to obtain the average intensity as well as breadth of expression for analyzing patterns from the adult stages (Su et al. 2002).
MATERIALS AND METHODS
Protein sequence collections and distances:
Protein sequences of fruit fly (D. melanogaster) and fugu (T. rubripes) were obtained from http://www.fruitfly.org/sequence/dlMfasta.shtml and http://www.fugu-sg.org/downloads/downloads3.html, respectively. Protein sequences of human (H. sapiens), mouse (M. musculus), worm (Caenorabditis elegans), yeast (Saccharomyces cerevisiae), plant (Arabidopsis thaliana) and bacteria (Escherichia coli) were obtained from GenBank (ftp://ftp.ncbi.nih.gov/genomes/). We used the mouse genome as a reference in all comparisons and only the genes for which expression data were available were included in the analyses. This produced a data set containing 6893, 4626, and 2757 gene pairs for human-mouse, fugu-mouse, and fruit fly-mouse comparisons, respectively. Information on multigene gene family and alternative splice variant counts for mouse and human were obtained using the Ensmart view of the Ensembl genome browser (http://www.ensembl.org). Protein sequence alignments were carried out with CLUSTAL-W using default settings (Thompson et al. 1994). Evolutionary divergence at the amino acid level was estimated using the Poisson corrected, JTT, and gamma distances (Jones et al. 1992; Nei and Kumar 2000), because the rate of evolution among sites for each protein is known to vary considerably (gamma distribution) and the pattern of amino acid substitution is complex. For computing gamma distances, we estimated the shape parameter (describing rate variation among sites) using a maximum-likelihood approach (PAML; Yang 1995) for proteins for which the orthologous sequences from fruit fly, fugu, human, and mouse were available. We found that relative values and trends observed for Poisson, JTT, and gamma distances were similar, whenever a comparison was possible. Therefore, for the sake of brevity we have presented only results from the Poisson correction distances and because these distances have the smallest variance.
Determination of orthology:
Putative orthologous genes for any species pair were identified using a local BLASTP search with BLOSUM62 substitution matrix (Altschul et al. 1990). Only the protein sequence pairs with >50% aligned common sites were included. The threshold score (bit score S in BLASTP program) was set according to protein length (L) following Duret et al. (1994): S = 150 for L ≥ 170 amino acids, S = L − 20 for 55 < L < 170 and S = 35 for L ≤ 55 amino acids. We used the reciprocal BLASTP search in which a pair of genes were considered orthologous only if they were mutually the best matches in their respective counterpart genomes (Waterston et al. 2002). We took a stringent approach in identifying the orthologous genes by including the protein sequences from both the species in the BLAST subject database. When a protein sequence from species 1 was used as the query sequence and the BLASTP results were sorted on the basis of strength of match, all the significant matches from species 1 were its own lineage specific duplicates (if any) and then the query sequence matched genes from species 2 (and vice versa). This method allowed us to identify the lineage-specific duplicate sets from both species, which were coorthologous to each other (Sonnhammer and Koonin 2002). Each member of this set of genes was expected to contain one orthologous and one or more (if any) lineage-specific paralogous genes (Lander et al. 2001). Reciprocal BLASTP searches were conducted among the co-orthologous sequence sets using each sequence as a query. The sequence pair with the best reciprocal BLAST score was considered as the closest homolog for the given species pair and all other genes were discarded. This procedure is likely to result in the inclusion of only one gene per multigene family in the final data set, and the homologous sequences identified in this way for a given pair of species are referred to as orthologous pairs throughout the description below. (However, the patterns reported remained unchanged even when we used all the reciprocal best matches for a given species pair; results not shown.)
Identification of Precambrian and vertebrate-specific genes:
In the BLASTP searches mentioned above, we find that many genes of a given species show no homologs in other species. If a vertebrate gene belonging to fugu, human, or mouse was found to have a homolog in fruit fly, worm, yeast, plant, or bacterial genomes, we refer to it as a Precambrian gene. Otherwise, it is assumed to be vertebrate specific. [A reanalysis using the complete nonredundant protein sequences from GenBank (ftp://ftp.ncbi.nih.gov/blast/db/nr.z) to find homologs produced results consistent with those presented here.]
Gene expression data:
To estimate the gene expression intensity, we used single early-stage embryonic EST libraries from fruit fly (RE D. melanogaster embryo pFlc-1) and mouse (Soares mouse embryo NbME13.5 14.5, which has gone through one round of normalization; http://www.ncbi.nlm.nih.gov/dbEST/ through the UniLib site http://www.ncbi.nlm.nih.gov/UniLib/). We chose these libraries because they contained the highest number of ESTs: 60,229 and 50,672, respectively. The BLASTN was used to match ESTs with their respective genes and the numbers of matches were counted. This count was taken to represent the level of gene expression. ESTs with a length of 100 nucleotides or more, having at least 95% overall identity, were considered a match. This criterion is considered to be stringent enough to distinguish the genes belonging to the conserved gene families. All analyses were repeated by using a 99% identity score to match ESTs to genes; this reduced the number of genes but led to similar results.
For estimating the breadth of gene expression for EST data, we have used 23 mouse EST libraries belonging to 23 different tissues (blood, brain, colon, heart, hippocampus, kidney, liver, lymph node, mammary gland, muscle, ovary, pancreas, retina, salivary gland, small intestine, spinal cord, skin, spleen, stomach, testis, thymus, tongue, and vein) and the number of tissue libraries in which a gene sequence had a significant match was taken as a measure of the breadth of expression (Duret and Mouchiroud 2000).
Furthermore, high-density oligo-nucleotide array data (http://expression.gnf.org) from 45 mouse tissues was used to obtain the breadth and level of expression for 3977 mouse genes in our data set (Su et al. 2002). The Affymetrix average difference (AD) units of 200 was defined as a conservative threshold to determine the presence (expression) of a gene in a given tissue (Su et al. 2002). The average estimate of the AD values from all the tissues in which the gene was expressed was used to represent the expression level of a gene and the number of tissues was used to represent the breadth of expression.
Gene expression intensity categories:
We used three primary categories of gene expression intensity—high, medium, and low–based on the multigene distribution of EST frequencies (Figure 1, A and B). Both mouse and fruit fly genes show a skewed distribution, with a very large number of genes showing low expression (low EST counts). On the basis of these distributions, we designated approximately the top 3% of genes to be in the high, the next 7% to be in the medium, and the rest to be in the low gene expression category. We used the same procedure to determine the expression categories using oligo-nucleotide array data, as the expression levels from the oligo-nucleotide array and EST were significantly correlated (R = 0.42, P < 0.0001). To categorize the breadth of expression, we used the number of tissues in which a gene is expressed. Genes expressed in >16 tissues, 9–16 tissues, and 1–8 tissues were defined as high, medium, and low breadth, respectively. For comparing the average protein distances statistically and for determining other summary statistics between categories, we used a Mann-Whitney U-test in which the divergence estimates were ranked and the U-statistic was computed, as the individual data points do not distribute normally. The statistical significance of the difference was determined after converting the U-statistic to a Z-score (Sokal and Rohlf 1995).
Figure 1.—

Frequency distribution of the genes with different counts of ESTs in the (A) fruit fly and (B) mouse embryonic libraries.
RESULTS
Relationship of protein divergence with gene expression intensity:
Figure 2A shows the relationship of the evolutionary divergence and gene expression intensity of Precambrian proteins for the mouse-fruit fly comparison when using the fruit fly embryonic EST library. The scatter plot shows that the highly expressed genes almost always evolve slowly, but genes with low expression levels show a large variation in protein divergence. The distributions of protein divergences (Figure 2B) in genes with high (solid bars) and low (open bars) expression levels have distinct shapes as well as central tendencies. For example, the average protein divergence of genes with low expression is two times greater than that for highly expressed genes (Figure 2C); this also is true when the median values are compared (0.34 and 0.74 for genes with high and low expression, respectively). The use of the mammalian (mouse) embryonic EST library for these comparisons also produced similar results (Figure 2D) and the protein sequence comparison of mouse-fugu and mouse-human pairs shows very similar trends (Table 1). This suggests that the observed relationship does not depend on the extent of evolutionary divergence of species and is true for highly diverse animal phyla. Furthermore, the use of oligo-nucleotide array data resulted in relative patterns similar to those obtained from EST data (Table 1).
Figure 2.—

(A) The relationship of protein divergence with the number of EST counts (expression level) for different genes in the fruit fly embryonic library (R = 0.23, P < 0.0001). (B) Multigene distributions of protein divergence of the highly (shaded bars) and lowly (open bars) expressed genes. The relationship between the expression level and average protein divergence for the mouse-fruit fly comparison using the embryonic library from (C) fruit fly and (D) mouse. The number of genes is given in the parentheses and error bars indicate the standard error of the mean. The differences in the average protein divergences between the genes belonging to high and medium or medium and low expression levels are significant at the 1% level using the Mann-Whitney U-test (see also Table 1).
TABLE 1.
Comparison of the evolutionary divergence of Precambrian and vertebrate-specific proteins in different gene expression intensity categories using mouse embryonic EST data and oligo-nucleotide microarray data (in parentheses)
| Divergence per site
|
Length of amino acids
|
Substitutions per protein
|
||||
|---|---|---|---|---|---|---|
| Precambrian | Vertebrate specific | Precambrian | Vertebrate specific | Precambrian | Vertebrate specific | |
| Mouse-humana | ||||||
| Highly expressed | 0.038 (0.034) | 0.155 (0.202) | 276.3 (255.7) | 325.0 (279.9) | 10.0 (5.3) | 45.8 (36.0) |
| Medium expressed | 0.068 (0.062) | 0.144b (0.214b) | 462.4 (479.4) | 445.7 (387.0b) | 33.1 (25.9) | 62.2b (46.8b) |
| Lowly expressed | 0.101 (0.082) | 0.198 (0.167) | 619.6 (546.1) | 493.9 (441.1) | 59.9 (45.8) | 85.5 (67.0b) |
| Low/high ratio | 2.7 (2.4) | 1.3 (0.8) | 2.2 (2.1) | 1.5 (1.5) | 6.0 (8.6) | 1.9 (1.9) |
| Mouse-human (conserved)c | ||||||
| Highly expressed | 0.013 (0.010) | 0.032 (0.027) | 255.6 (214.4) | 255.9 (346.8) | 4.2 (2.1) | 9.9 (9.1) |
| Medium expressed | 0.021 (0.018) | 0.035b (0.034) | 392.9 (407.3) | 383.5b (346.8b) | 10.2 (9.3) | 15.3b (12.6) |
| Lowly expressed | 0.031 (0.029) | 0.037b (0.035b) | 565.8 (510.2) | 450.2 (423.5) | 18.8 (16.1) | 17.5 (15.5b) |
| Low/high ratio | 2.3 (2.8) | 1.2 (1.3) | 2.2 (2.4) | 1.8 (1.2) | 4.5 (7.7) | 1.8 (1.7) |
| Mouse-Fugu | ||||||
| Highly expressed | 0.156 (0.134) | 0.408 (0.427) | 266.0 (234.5) | 274.8 (296.9) | 43.8 (27.5) | 89.3 (104.8) |
| Medium expressed | 0.268 (0.243) | 0.457b (0.478b) | 393.7 (457.8) | 375.6 (361.6b) | 101.9 (103.8) | 156.7 (143.7b) |
| Lowly expressed | 0.337 (0.297) | 0.513 (0.470b) | 547.2 (475.5) | 435.6 (385.8) | 160.5 (127.1) | 177.5 (146.9) |
| Low/high ratio | 2.2 (2.2) | 1.3 (1.1) | 2.1 (2.0) | 1.6 (1.3) | 3.7 (4.6) | 2.0 (1.4) |
| Mouse-fruit fly | ||||||
| Highly expressed | 0.377 (0.371) | — | 238.1 (229.9) | — | 80.1 (71.8) | — |
| Medium expressed | 0.555 (0.551) | — | 436.1 (421.4) | — | 206.3 (184.0) | — |
| Lowly expressed | 0.770 (0.693) | — | 604.9 (522.6) | — | 334.8 (271.4) | — |
| Low/high ratio | 2.0 (1.9) | — | 2.5 (2.3) | — | 4.2 (3.8) | — |
Totals of 6893, 4626, and 2233 genes were used for the mouse-human, mouse-fugu, and mouse fruit fly comparisons, respectively, using EST data and 3977, 2540, and 1298 genes, respectively, using microarray data.
Difference in the average estimates of highly and medium expressed genes (or medium and lowly expressed genes) is not statistically significant at a 5% level using the Mann-Whitney U-test. Difference for other pairs of relevant expression-level comparisons are significant at a 5% level (two-tailed).
All genes showing human-mouse distance ≤0.07 were included (2461 and 1592 genes using EST and microarray data, respectively).
To compare patterns from Precambrian genes with those from vertebrate-specific genes, we estimated the difference in the average protein distances in different expression categories using the protein distance for the mouse-human and mouse-fugu comparisons using the embryonic EST and oligo-nucleotide array data from mouse (Table 1). The observed difference is much less pronounced for vertebrate-specific genes as compared to Precambrian genes. For example, low-intensity vertebrate-specific genes evolve only 30% faster than highly expressed vertebrate-specific genes; this difference is six times smaller than that for the Precambrian genes (Table 1).
The observed difference does not appear to be caused by significant differences in the average EST counts in each intensity category between the vertebrate-specific and Precambrian genes. In the Precambrian genes, the average human-mouse protein divergence for genes with ≥20 ESTs (0.038 ± 0.007) is less than one-third that for genes with 1 EST (0.117 ± 0.006). In contrast, vertebrate-specific genes show very similar values of average protein divergence for these two cases (0.180 ± 0.017 for genes with ≥20 ESTs and 0.213 ± 0.006 for genes with 1 EST). Furthermore, the range of the protein distances for vertebrate-specific and Precambrian genes was also found to be the same for the human-mouse comparison (0.0–2.2), but with a greater proportion of vertebrate-specific genes evolving faster in each of the gene expression categories.
Homology determination and highly and lowly expressed genes:
We designated vertebrate-specific genes as those for which no discernible homologs were found using the BLAST searches in the invertebrate, yeast, and plant genomes (see materials and methods). In this BLAST procedure, it is possible that the fast-evolving mouse Precambrian genes were misclassified due to their lower sequence similarity with the distantly related genomes. If that is true, the procedure would spuriously produce the differences in trends observed for Precambrian and vertebrate-specific genes.
Therefore, we repeated all computations by using only the slowest-evolving proteins. We retained only genes in which the protein divergence (using Poisson-corrected distance) for human-mouse was ≤0.07 substitutions/site. At this divergence level, the maximum divergence between the orthologous Precambrian genes (between chordate and arthropods) is generally not expected to exceed 0.7 substitutions/amino acid (which translates into >50% expected sequence identity), because the primate-rodent divergence is considered to be >10 times younger than the chordate-arthropod divergence (see review in Hedges and Kumar 2003). This divergence level is well within the limits of the high sensitivity for BLAST procedures, which are known to perform well even when the sequence divergence is 1.2 (or >30% sequence identity) substitutions per site (Brenner et al. 1998). Among these slowest-evolving genes, 40% did not have orthologs in fruit fly, worm, yeast, plant, or bacterial genomes and therefore these genes are unambiguously vertebrate-specific genes. Use of these slow-evolving Precambrian and vertebrate-specific genes produced results that are identical with that obtained using all the genes for the human-mouse comparison (Table 1). Similar results were obtained for mouse-fugu and mouse-fruit fly comparisons (data not shown). Therefore the trends observed in our study are unlikely to be due to methodological artifacts.
Effect of mutation rate differences:
Mutation rate may also influence the rate of protein evolution; for example, housekeeping genes are known to be clustered in G + C-rich regions (Lercher et al. 2002), which are associated with higher mutation rates (Hardison et al. 2003; Subramanian and Kumar 2003). Therefore, we investigated the effect of mutation rate on the protein evolution of genes with high and low expression levels. Our analysis using Precambrian genes for the human-mouse comparison shows only a 10% difference in the synonymous divergence (computed using Tamura-Nei correction for fourfold-degenerate sites) between genes that are highly expressed (0.47 base substitutions/site) and those with low expression (0.53 base substitutions/site). Therefore, the synonymous rate difference is much smaller than an ∼150% difference in the protein divergence (Table 1). We also examined if elevated proportions of CpG dinucleotides, which mutate 7–10 times faster than other nucleotides (e.g., Bird 1980; Subramanian and Kumar 2003), might explain the difference between highly and lowly expressed proteins. Exclusion of CpG sites reduced the nonsynonymous divergence for genes with high as well as low expression levels by an approximately equal amount (8%), showing that the proportion of hypermutable CpG sites is not significantly different in the nonsynonymous sites of the genes with large differences in expression intensities.
Effect of the size of multigene families:
Stronger selective constraints could be due to lower genetic redundancy (smaller size of the multigene family) of highly expressed genes compared to genes with low expression level. To examine the overall affect of this attribute, we compared patterns in singletons (1161 genes) with those belonging to multigene families with more than five members (1028 genes). We found that genes belonging to large multigene families (more than five members) show a significantly lower divergence compared to those observed for singletons for the human-mouse comparison (0.08 and 0.11, respectively). However, the negative relationship between the expression level and protein evolutionary rate holds true, as there was a greater than two-times difference in average protein divergence between genes with high and low expression levels for singletons (0.045 ± 0.009 vs. 0.113 ± 0.003) and genes in multigene families (0.030 ± 0.006 vs. 0.083 ± 0.003).
Effect of alternative splicing:
Nonsynonymous divergence of constitutively expressed exons of alternatively spliced genes has been found to be significantly higher than that of the alternatively spliced exons of the same genes (Iida and Akashi 2000). Therefore we analyzed a subset of Precambrian genes, which are not known to have any alternative splice variant (1651 genes). The lowly (0.096 ± 0.002) and highly (0.025 ± 0.004) expressed genes show a more than three-times difference; in fact the absolute difference of 0.071 in this case is quite similar to that observed for all Precambrian genes for the mouse-human comparison (0.063; Table 1).
Effect of energy requirements for amino acid synthesis:
Selection for less costly amino acids, such that lower energy will be required for amino acid synthesis, has been observed in the highly expressed proteins of bacteria (Akashi and Gojobori 2002). To examine whether this phenomenon affects our inference, we estimated this cost as the average number of high-energy phosphate bonds required to synthesize each amino acid for each protein following Akashi and Gojobori (2002) but for the mouse proteins used. We did not see a significant difference in the average costs for proteins of highly (23.5 ± 0.09) and lowly (23.48 ± 0.02) expressed genes. Therefore, differences in this type of energy requirement will not create the patterns reported here.
Relationship of protein length with the expression intensity:
A significant correlation exists between the length of the protein sequence and the gene expression levels (Table 1). The average peptide length of the lowly expressed genes is ∼2.2 times longer than that of the proteins with high expression levels in the Precambrian genes (human-mouse alignments). In contrast, vertebrate-specific proteins show only a 1.5 times difference between proteins encoded by genes with low and high expression levels. This result is obtained by computing the sequence length using only the aligned common sites (excluding indels), but it is similar when the entire length of the protein is used (data not shown). Use of the fugu-mouse and fruit fly-mouse alignments yields similar results (Table 1). These observations establish the ancestral nature of the negative relationship between peptide length and expression intensity level, which was previously observed in the human genome (Urrutia and Hurst 2003).
Shorter peptide lengths and lower evolutionary divergences predict fewer total amino acid replacements per polypeptide in the highly expressed genes. This is indeed the case, as genes with low expression levels show four to nine times more amino acid replacements than the highly expressed Precambrian genes (Table 1). The vertebrate-specific genes show only one-half the difference between the high- and low-expression categories. Interestingly, the difference between the high- and medium-expression categories is very small for vertebrate-specific genes and in fact is not statistically significant.
As stated, the above results suggest that protein evolutionary rates and peptide lengths are modulated by gene expression intensity. However, it is possible that the rate of protein evolution and peptide length are themselves correlated and are independent of gene expression intensity. To reduce such correlations, we divided proteins into three groups of equal sample size on the basis of their length (325 amino acids, 542 amino acids, and >542 amino acids) for the mouse-fruit fly comparison. Analyses from each data set suggested that the rate of protein evolution still has a negative relationship with gene expression level (Figure 3). This result implies that gene expression intensity is an important factor in shaping the protein evolutionary rate as well as peptide length. Furthermore, the observed negative relationship between expression intensity and intron size extends this effect to the genomic sequence level (Castillo-Davis et al. 2002) and suggests that this shortening process acts not only on proteins but also on the whole genomic transcript. Shortening of introns reduces the cost of transcription, whereas shortening of peptides reduces the cost of translation.
Figure 3.—

The correlation between gene expression intensity and protein evolution when genes were grouped into three sets (each with an approximately equal number of genes) on the basis of peptide lengths. Number of genes are given above the bars.
DISCUSSION
There is a strong negative relationship between gene expression intensity and protein evolution rate for the Precambrian, whether we use the mouse or the fruit fly embryonic EST libraries. The similarity of the influence of natural selection on patterns of protein evolution rates appears to be due in part to the significant correlation (R = 0.29; P < 0.01) between relative gene expression intensity in the early embryonic stages of the vertebrate (mouse) and arthropod (fruit fly) embryos. The high correlation, and thus conservation, of the relative expression levels of homologous genes of human and mouse is already known (Su et al. 2002). Our results suggest that the relative expression levels of the homologous genes descended from the Precambrian genome also are significantly conserved, at least at the early embryonic stages.
There also is an inverse relationship between the expression intensity and the number of amino acid substitutions per protein. This is to be expected because the number of amino acid substitutions per peptide combines the effects of natural selection on protein evolution rate and on peptide length. When nonsynonymous substitutions severely affect the fitness of the organism, having a shorter protein reduces the total probability of the random occurrence of at least one replacement mutation. Therefore, shorter proteins will experience fewer mutations with significant negative fitness.
However, compared with the highly expressed genes, genes with low EST counts show a much larger variation in protein divergence, suggesting that not all the genes with a low expression level evolve fast or receive a larger number of total substitutions per protein (Figure 2, A and B). Genes involved in functions such as gene regulation, ligand binding, and carriers are required only in small quantities (lowly expressed), but they are vital for the organism. In those cases, the natural selection preserves the sequence due to functional constraints on retaining the original amino acid at most of the sites and preserving specific motif modules, which determines the evolutionary rate (Akashi 2001). Therefore, while the overall patterns show a strong negative trend, the evolutionary rates of individual proteins are not solely determined or predictable on the basis of gene expression intensity. It does, however, appear that the slow rate of evolution for highly expressed genes cannot be solely attributed to structural and functional constraints on individual amino acids, independent of the gene expression intensity. This is because these structural/functional constraints also cannot explain the shorter intron lengths for highly expressed genes (Castillo-Davis et al. 2002). Therefore, in addition to structural/functional constraints, there are many other genomic, gene, and protein sequence level components to the overall intensity of natural selection. On the basis of the observed correlation between expression intensity and evolutionary rate, expression intensity appears to be one of the major components.
Could the result from gene expression intensity be explained by the fact that genes are broadly expressed? Or vice versa? This is proposed because the negative relationship between the breadth of gene expression (with respect to the number of tissues) and nonsynonymous substitutions in human and mouse genes has been reported (Duret and Mouchiroud 2000). Therefore, we estimated the average breadth of expression for genes in high-, medium-, and low-intensity levels using 23 mouse tissue-specific EST libraries. Both Precambrian as well as vertebrate-specific genes show a positive relationship (Figure 4A), which confirms the finding that the level and breadth of expression are highly correlated (Lercher et al. 2002). Therefore, genes expressed highly in the embryos are also broadly expressed in the adult organism. This could mean that the observed constraint on protein evolution could be explained by either the breadth or level of expression or by a combination of both. We conducted a multiple regression analysis using the EST data for the human-mouse comparison and found that the expression intensity has a highly significant influence on the protein divergence (P < 10−5) as compared to the breadth of expression (P = 0.57).
Figure 4.—
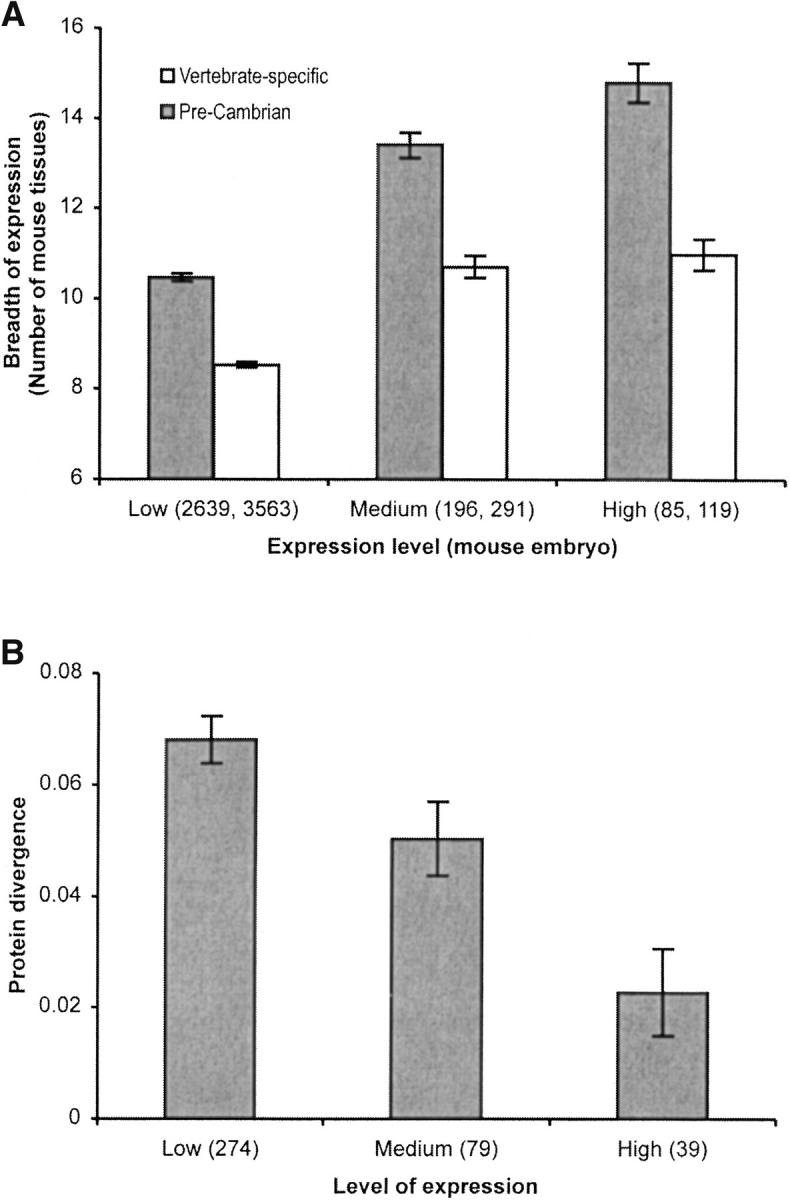
(A) The relationship between the expression intensity (EST count) and breadth (number of tissues) of human and mouse genes. Mouse genes with Precambrian (shaded bars) and later (open bars) origins were grouped on the basis of their level of expression in the mouse embryo. The average breadth of expression was computed for each group. The difference in the average breadth of expression between categories is significant at the 1% level using the Mann-Whitney U-test for the Precambrian genes. For the vertebrate-specific genes, the difference between the breadth of expression for genes belonging to high and medium expression levels is not significant at a 5% level. (B) The relationship of the level of expression (oligo-nucleotide array data) and protein divergence for 392 Precambrian human-mouse genes that are found to be expressed in all 45 mouse tissues. The differences in the average protein divergences between the genes belonging to high and medium or medium and low expression levels are significant at the 1% level using the Mann-Whitney U-test.
Insights into the independent effects of breadth and intensity of expression are provided by an analysis of 392 Precambrian genes, which are expressed in all 45 mouse tissues in the oligo-nucleotide array data (Figure 4B). We designated the top 10% of these genes (sorted on the basis of expression level) as highly expressed, 20% of the genes as medium expressed, and the rest (70%) as genes with low expression levels. There is a 200% difference in average human-mouse protein divergences between the highly and lowly expressed genes, which indicates that the expression intensity alone significantly influences the rate of protein evolution. The strong relationship of the gene expression intensity, independent of the breadth of expression, is also supported by the fact that yeast proteins show lower evolutionary rates for highly expressed genes (Pal et al. 2001), without any influence of the breadth of expression because yeast is a unicellular eukaryote. Therefore the intensity of gene expression is likely to be an ancestral property and a central determinant of the protein evolutionary rates. However, the origin of the breadth of expression caused by increased complexity (in terms of the number of cell and tissue types) of multicellular animals may now be further augmenting the extent of purifying selection.
In fact, differences in the breadth of expression of vertebrate-specific and Precambrian genes might provide an explanation for the differences observed in evolutionary rate. Figure 4A shows that the average breadth of expression of the vertebrate-specific genes is significantly narrower than that of the Precambrian genes, irrespective of the expression-level category. A greater proportion of the Precambrian genes (51%) are broadly expressed (>10 tissues) as compared to the vertebrate-specific genes (33%). Furthermore, the breadth of expression of the vertebrate-specific genes with high and medium expression levels is not significant (Figure 4A, open bars). This might explain why the difference in the protein divergence of the vertebrate-specific genes with high and medium expression levels is insignificant (see Table 1). Therefore, recently emerged genes are more specialized (narrower breadth of expression) and are under lower overall purifying selection as compared to the Precambrian genes.
In conclusion, our approach of contrasting and comparing relationships of gene expression intensity, breadth of expression, and sequence divergence of Precambrian and vertebrate-specific proteins provides glimpses into the relative importance of various sources of purifying selection on genes that have originated at different times in animal evolution. Therefore, when studying the relationships between molecular evolutionary rates and gene expression attributes, it is likely to be useful to consider the major transitions in animal evolutionary history.
Acknowledgments
We thank Michael Rosenberg and Araxi Urrutia for helpful discussions and Hiroshi Akashi, Martin Lercher, and an anonymous reviewer for many insightful comments. This research was supported by research grants from the National Institutes of Health, the National Science Foundation, and the Burroughs-Wellcome Fund to S.K.
References
- Akashi, H., 2001. Gene expression and molecular evolution. Curr. Opin. Genet. Dev. 11: 660–666. [DOI] [PubMed] [Google Scholar]
- Akashi, H., 2003. Translational selection and yeast proteome evolution. Genetics 164: 1291–1303. [DOI] [PMC free article] [PubMed] [Google Scholar]
- Akashi, H., and T. Gojobori, 2002. Metabolic efficiency and amino acid composition in the proteomes of Escherichia coli and Bacillus subtilis. Proc. Natl. Acad. Sci. USA 99: 3695–3700. [DOI] [PMC free article] [PubMed] [Google Scholar]
- Altschul, S. F., W. Gish, W. Miller, E. W. Myers and D. J. Lipman, 1990. Basic local alignment search tool. J. Mol. Biol. 215: 403–410. [DOI] [PubMed] [Google Scholar]
- Bird, A. P., 1980. DNA methylation and the frequency of CpG in animal DNA. Nucleic Acids Res. 8: 1499–1504. [DOI] [PMC free article] [PubMed] [Google Scholar]
- Brenner, S. E., C. Chothia and T. J. Hubbard, 1998. Assessing sequence comparison methods with reliable structurally identified distant evolutionary relationships. Proc. Natl. Acad. Sci. USA 95: 6073–6078. [DOI] [PMC free article] [PubMed] [Google Scholar]
- Castillo-Davis, C. I., S. L. Mekhedov, D. L. Hartl, E. V. Koonin and F. A. Kondrashov, 2002. Selection for short introns in highly expressed genes. Nat. Genet. 31: 415–418. [DOI] [PubMed] [Google Scholar]
- Coghlan, A., and K. H. Wolfe, 2000. Relationship of codon bias to mRNA concentration and protein length in Saccharomyces cerevisiae. Yeast 16: 1131–1145. [DOI] [PubMed] [Google Scholar]
- Duret, L., and D. Mouchiroud, 1999. Expression pattern and, surprisingly, gene length shape codon usage in Caenorhabditis, Drosophila, and Arabidopsis. Proc. Natl. Acad. Sci. USA 96: 4482–4487. [DOI] [PMC free article] [PubMed] [Google Scholar]
- Duret, L., and D. Mouchiroud, 2000. Determinants of substitution rates in mammalian genes: expression pattern affects selection intensity but not mutation rate. Mol. Biol. Evol. 17: 68–74. [DOI] [PubMed] [Google Scholar]
- Duret, L., D. Mouchiroud and M. Gouy, 1994. HOVERGEN: a database of homologous vertebrate genes. Nucleic Acids Res. 22: 2360–2365. [DOI] [PMC free article] [PubMed] [Google Scholar]
- Eisenberg, E., and E. Y. Levanon, 2003. Human housekeeping genes are compact. Trends Genet. 19: 362–365. [DOI] [PubMed] [Google Scholar]
- Hardison, R. C., K. M. Roskin, S. Yang, M. Diekhans, W. J. Kent et al., 2003. Covariation in frequencies of substitution, deletion, transposition, and recombination during eutherian evolution. Genome Res. 13: 13–26. [DOI] [PMC free article] [PubMed] [Google Scholar]
- Hedges, S. B., and S. Kumar, 2003. Genomic clocks and evolutionary timescales. Trends Genet. 19: 200–206. [DOI] [PubMed] [Google Scholar]
- Iida, K., and H. Akashi, 2000. A test of translational selection at ‘silent’ sites in the human genome: base composition comparisons in alternatively spliced genes. Gene 261: 93–105. [DOI] [PubMed] [Google Scholar]
- Jones, D. T., W. R. Taylor and J. M. Thornton, 1992. The rapid generation of mutation data matrices from protein sequences. Comput. Appl. Biosci. 8: 275–282. [DOI] [PubMed] [Google Scholar]
- Krylov, D. M., Y. I. Wolf, I. B. Rogozin and E. V. Koonin, 2003. Gene loss, protein sequence divergence, gene dispensability, expression level, and interactivity are correlated in eukaryotic evolution. Genome Res. 13: 2229–2235. [DOI] [PMC free article] [PubMed] [Google Scholar]
- Lander, E. S., L. M. Linton, B. Birren, C. Nusbaum, M. C. Zody et al., 2001. Initial sequencing and analysis of the human genome. Nature 409: 860–921. [DOI] [PubMed] [Google Scholar]
- Lercher, M. J., A. O. Urrutia and L. D. Hurst, 2002. Clustering of housekeeping genes provides a unified model of gene order in the human genome. Nat. Genet. 31: 180–183. [DOI] [PubMed] [Google Scholar]
- Li, W.-H., 1997 Molecular Evolution. Sinauer Associates, Sunderland, MA.
- Marais, G., and L. Duret, 2001. Synonymous codon usage, accuracy of translation, and gene length in Caenorhabditis elegans. J. Mol. Evol. 52: 275–280. [DOI] [PubMed] [Google Scholar]
- Nei, M., and S. Kumar, 2000 Molecular Evolution and Phylogenetics. Oxford University Press, New York.
- Ohno, S., 1996. The notion of the Cambrian pananimalia genome. Proc. Natl. Acad. Sci. USA 93: 8475–8478. [DOI] [PMC free article] [PubMed] [Google Scholar]
- Pal, C., B. Papp and L. D. Hurst, 2001. Highly expressed genes in yeast evolve slowly. Genetics 158: 927–931. [DOI] [PMC free article] [PubMed] [Google Scholar]
- Powell, J. R., and E. N. Moriyama, 1997. Evolution of codon usage bias in Drosophila. Proc. Natl. Acad. Sci. USA 94: 7784–7790. [DOI] [PMC free article] [PubMed] [Google Scholar]
- Sharp, P. M., and W.-H. Li, 1989. On the rate of DNA sequence evolution in Drosophila. J. Mol. Evol. 28: 398–402. [DOI] [PubMed] [Google Scholar]
- Shields, D. C., P. M. Sharp, D. G. Higgins and F. Wright, 1988. “Silent” sites in Drosophila genes are not neutral: evidence of selection among synonymous codons. Mol. Biol. Evol. 5: 704–716. [DOI] [PubMed] [Google Scholar]
- Sokal, R. R., and F. J. Rohlf, 1995 Biometry. W. H. Freeman, San Francisco.
- Sonnhammer, E. L., and E. V. Koonin, 2002. Orthology, paralogy and proposed classification for paralog subtypes. Trends Genet. 18: 619–620. [DOI] [PubMed] [Google Scholar]
- Su, A. I., M. P. Cooke, K. A. Ching, Y. Hakak, J. R. Walker et al., 2002. Large-scale analysis of the human and mouse transcriptomes. Proc. Natl. Acad. Sci. USA 99: 4465–4470. [DOI] [PMC free article] [PubMed] [Google Scholar]
- Subramanian, S., and S. Kumar, 2003. Neutral substitutions occur at a faster rate in exons than in noncoding DNA in primate genomes. Genome. Res. 13: 838–844. [DOI] [PMC free article] [PubMed] [Google Scholar]
- Thompson, J. D., D. G. Higgins and T. J. Gibson, 1994. CLUSTAL W: improving the sensitivity of progressive multiple sequence alignment through sequence weighting, position-specific gap penalties and weight matrix choice. Nucleic Acids Res. 22: 4673–4680. [DOI] [PMC free article] [PubMed] [Google Scholar]
- Urrutia, A. O., and L. D. Hurst, 2003. The signature of selection mediated by expression on human genes. Genome Res. 13: 2260–2264. [DOI] [PMC free article] [PubMed] [Google Scholar]
- Valentine, J. W., 1994. Late Precambrian bilaterians: grades and clades. Proc. Natl. Acad. Sci. USA 91: 6751–6757. [DOI] [PMC free article] [PubMed] [Google Scholar]
- Waterston, R. H., K. Lindblad-Toh, E. Birney, J. Rogers, J. F. Abril et al., 2002. Initial sequencing and comparative analysis of the mouse genome. Nature 420: 520–562. [DOI] [PubMed] [Google Scholar]
- Yang, Z., 1995 PAML: Phylogenetic Analysis by Maximum Likelihood. Institute of Molecular Evolutionary Genetics, The Pennsylvania State University, University Park, PA.