

Abstract
We investigate the best way to combine into a single genotype a series of target genes identified in different parents (gene pyramiding). Assuming that individuals can be selected and mated according to their genotype, the best method corresponds to an optimal succession of crosses over several generations (pedigree). For each pedigree, we compute the probability of success from the known recombination fractions between the target loci, as well as the number of individuals (population sizes) that should be genotyped over successive generations until the desired genotype is obtained. We provide an algorithm that generates and compares pedigrees on the basis of the population sizes they require and on their total duration (in number of generations) and finds the best gene-pyramiding scheme. Examples are given for eight target genes and are compared to a reference genotype selection method with random mating. The best gene-pyramiding method combines the eight targets in three generations less than the reference method while requiring fewer genotypings.
RECENTLY there have been advances in the mapping of genes involved in the variation of quantitative traits, through quantitative trait loci (QTL) mapping experiments and analysis of genomic data. Such studies on complex traits should lead to the identification of a great number of genetic factors responsible for the heritable variation of these traits. Furthermore, once these genetic factors are mapped, they can be controlled by molecular markers and the corresponding genotypes of individuals can be assessed easily. As a consequence, the identification of individuals carrying favorable alleles at these loci will provide genetic material for the development of new improved varieties.
Most theoretical work on the application of marker-QTL associations in selection has focused on using markers to estimate an individual's breeding value more reliably than when using its phenotype. In practice, a selection index is generally built on the basis of both the marker score and the phenotypic value of individuals (e.g., Lande and Thompson 1990; Hospital et al. 1997; Moreau et al. 1998); individuals are then selected before being mated at random. Such strategies of marker-assisted selection (MAS) aim at increasing population (or line) mean genetic value for one or more traits. Obviously, increasing genetic value rests on increasing the frequency of favorable genes controlling that trait. However, deciphering the genetic architecture of quantitative traits is not the primary objective of MAS nor a prerequisite for its success. In this view, MAS clearly belongs to the field of statistical quantitative genetics, established long before the advent of molecular genetics. Recent developments on increasing the efficiency of MAS indicate that a better estimate of breeding value is obtained by incorporating all markers in the molecular score (Lange and Whittaker 2001; Meuwissen et al. 2001), which is in some way opposite to the fine mapping of QTL. Surely, better methods of gene mapping and estimation of breeding value through markers are still needed and deserve further work.
It must be noted, however, that another aspect of MAS also deserves more theoretical development. If we know the locations of a series of genes of interest (hereafter referred to as target genes), the selection process may be reduced to a “building blocks” problem. What is the “best” way to do the gene pyramiding? Could optimal pairwise mating of individuals on the basis of their known genotypes at target loci be more efficient than selecting individuals on a molecular score and then mating them randomly? These are the questions we address in this article. Note that this problem is more a matter of simple Mendelian genetics extended to multiple loci (probabilities of recombination between known genes) than one of quantitative genetics and statistics.
Suppose an ideal genotype (ideotype) at a series of target genes can be defined prior to selection (the ideotype has favorable alleles at all loci of interest) but that it is not present in the starting population. The marker-assisted selection process is then reduced to genotype building where individuals are selected solely according to their genotype at the target loci (or at linked markers controlling the targets), the goal being to obtain the ideal genotype as cheaply and quickly as possible. The design of optimal breeding schemes aimed at cumulating many genes is a complex problem that few authors have studied so far. When several favorable genes are originally hosted by only two different parents, the simplest strategy involves the production of an F2, F3, recombinant inbred lines (RIL), or doubled-haploid (DH) population. Then, the population is screened on the basis of molecular markers for individuals homozygous at the requested loci. In this context, van Berloo and Stam (1998) considered a set of identified QTL, each controlled by two flanking markers, and studied selection in RIL populations based on flanking markers to produce the best hybrid. If all genes cannot be fixed in a single step of selection, it is necessary to cross again selected individuals with incomplete, but complementary, sets of homozygous loci (Charmet et al. 1999). However, such strategies are limited to small numbers of target loci because the population size necessary to fix the target genes increases exponentially with the number of target loci. To cumulate more loci in a single genotype by selection on markers, Hospital et al. (2000) proposed a marker-based recurrent selection (MBRS) method using a QTL complementation strategy in a randomly mating population. When evaluating this approach using simulations with 50 detected QTL in a population of 200, they found that the frequency of favorable alleles went up to 100% in 10 generations when markers were located exactly on the QTL, but up to only 92% when marker-QTL distance was 5 cM. The reduced efficiency in the latter case comes from the probability of “losing” the QTL during the breeding scheme because of recombination between the markers and the QTL. This effect becomes more severe with increasing duration of the breeding scheme because of the accumulation of meioses; hence, it is important to cumulate and fix the target genes as rapidly as possible. Hospital et al. (2000) concluded that the optimization of pairwise crosses between selected individuals should be the most efficient way to decrease the duration of the breeding scheme at constant cost.
In this study, we present a general framework to optimize breeding schemes to accumulate identified genes from multiple parents into a single genotype (gene-pyramiding schemes). We describe an algorithm that allows us to build every possible succession of pair crosses leading to the target genotype. We show how to compute the probabilities of gene transmission through these crosses and investigate the duration (in terms of number of generations) and the cost (in terms of population sizes) needed to produce the ideal genotype.
METHODS
Definitions:
We want to cumulate into a single genotype genes that have been identified in multiple parents. For this study, we assume that we have n loci of interest and a set of n founding parents labeled {Pi, i ∈ [1, … , n]}, with Pi being homozygous for the favorable allele at the ith locus and homozygous for unfavorable alleles at the remaining n − 1 loci. We assume that the recombination fractions between the loci are known. We want to derive the “ideal” genotype (called ideotype) that is homozygous for the favorable allele at all n loci.
To obtain the ideotype, one must describe a way of crossing the founding parents and their offspring to pass on all the favorable alleles to this ideotype. We call a particular set of crosses allowing this transmission a gene-pyramiding scheme. We assume that every founding parent is involved in only one cross in the gene-pyramiding scheme.
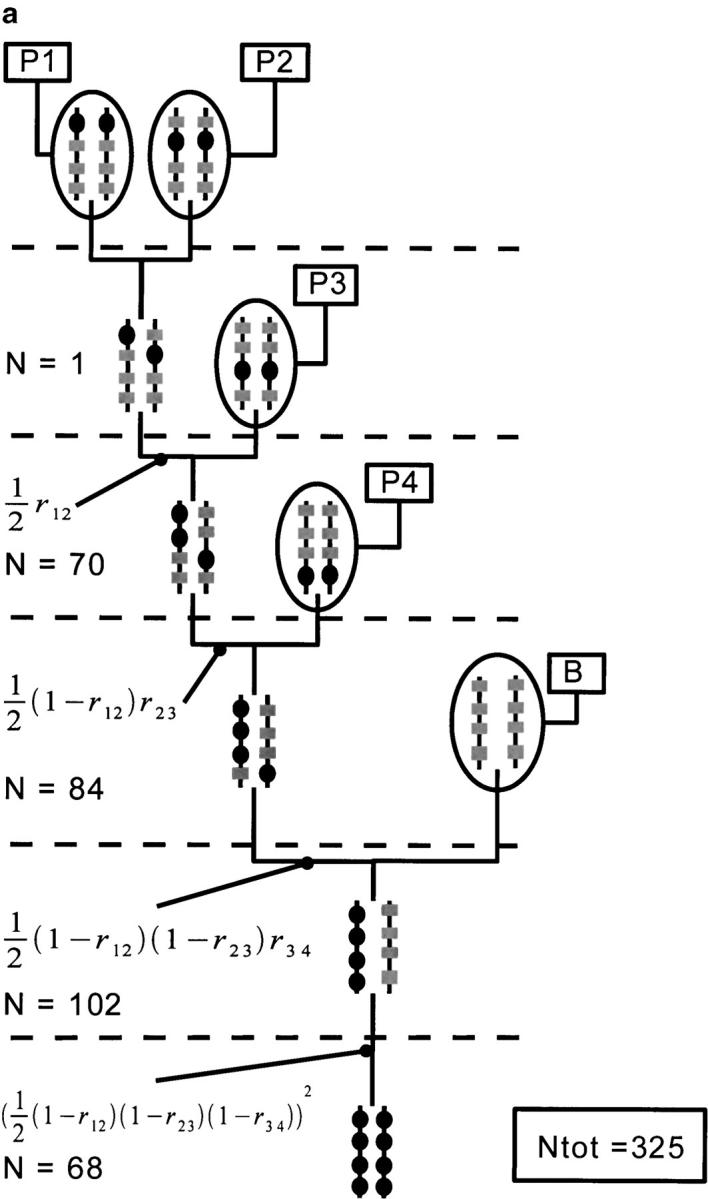
As can be seen in Figure 1, we can distinguish two parts for the gene-pyramiding scheme. The first part is called a pedigree and is aimed at cumulating one copy of all target genes in a single genotype (called root genotype). The second part is called the fixation steps and is aimed at fixing the target genes into a homozygous state, that is, to derive the ideotype from the root genotype.
Figure 1.—

Example of a gene-pyramiding scheme cumulating six target genes. Graphical representation of the objects defined in methods is shown; see text for details.
Pedigree:
A pedigree can be represented by a binary tree; it has n leaves corresponding to the n founding parents (Figure 1) and n − 1 nodes. (We do not count the leaves as nodes.)
Each node of the tree is called an intermediate genotype and has two parents (Figure 2). So we distinguish between founding parents appearing at the top of the pedigree (leaves of the tree) and (ordinary) parents involved in crosses in the rest of the gene-pyramiding scheme. Obviously, each intermediate genotype becomes a parent in the next cross. More importantly, an intermediate genotype is not an arbitrary offspring of a given cross; rather it is a particular genotype selected among the offspring such that all parental target genes are present. The part of a pedigree above a given node (i.e., leading to a given intermediate genotype) is called a subpedigree.
Figure 2.—

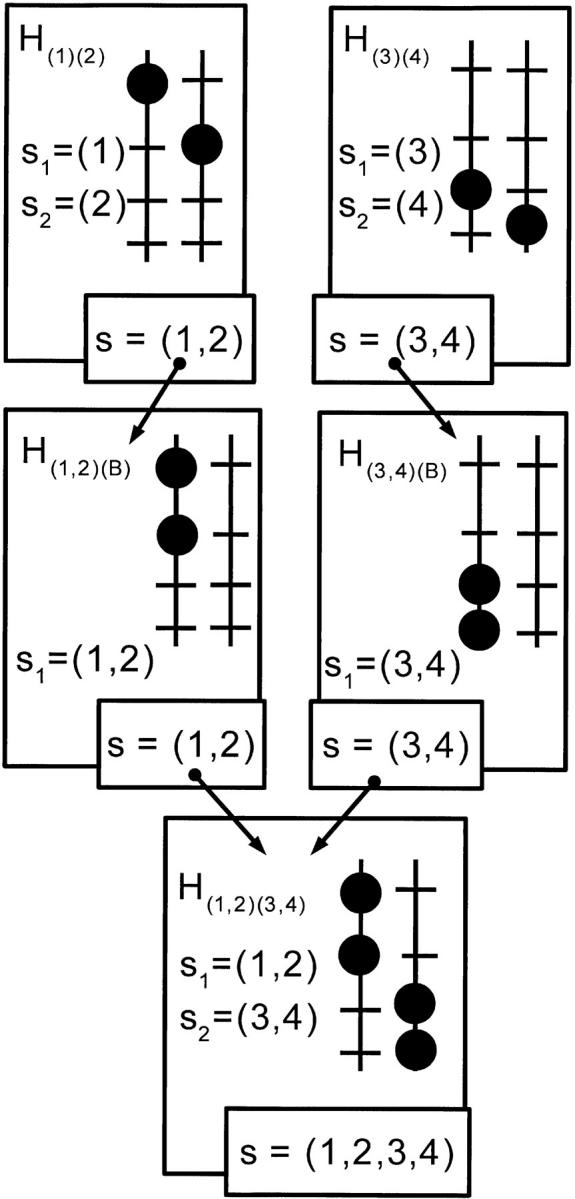
Details of a node of a pedigree. The gametes (subsets of genes) passed on from the parents H(1)(2) and H(3)(4) to the intermediate genotype H(1,2)(3,4) are denoted s, as well as the gamete the intermediate genotype should pass on as a parent of the next node.
Intermediate genotype:
An intermediate genotype is noted Hs1s2, where s1 is the subset of target genes inherited from one parent and s2 is that from the other. Note that, within a subset, the favorable alleles are in coupling phase (they were carried by the same gamete), while favorable alleles from different subsets are in repulsion phase (carried by different gametes). Each intermediate genotype must produce and pass on to its offspring a gamete s carrying all the favorable alleles in s1 and s2 (so that s = s1 ∪ s2).
Fixation steps:
We consider the fixation steps separately because it is not a matter of optimization in our framework. Rather, it is a matter of breeding techniques, depending on particular conditions that will be the same for all pedigrees. Hence, in our work we consider all choices for the pedigree part of the gene-pyramiding scheme, while the fixation steps follow a fixed protocol and will have the same duration regardless of the root genotype. Nevertheless, let us briefly consider the way these steps can be implemented in practice as well as their impact on the efficiency of the gene-pyramiding scheme.
One possible procedure for the fixation steps is to generate a population of doubled haploids from the root genotype. In this case, a population of gametes is obtained from this genotype and their genetic material is doubled. This leads to a population of fully homozygous individuals, among which the ideotype can be found. Using this method, the ideotype can be reached in just one additional generation after the root genotype is obtained. However, producing large populations of doubled haploids is possible in only a few plant species. Thus the fixation steps we implement for our study are as follows.
First, obtain a genotype carrying all favorable alleles in coupling (namely, H(1,…,n)(B)) by crossing the root genotype with a blank parent (denoted H(B)(B)) containing none of the favorable alleles. This guarantees that the linkage phase of the offspring is known and that the H(1,…,n)(B) genotype can be identified without ambiguity.
Second, self H(1,…,n)(B) to give the ideotype in one generation.
With this procedure, the ideotype is reached in two generations after the root genotype. This means that the fixation steps correspond to two nodes and therefore that the gene-pyramiding scheme has a total of n − 1 + 2 = n + 1 nodes.
A possible alternative to crossing with a blank parent is a cross with one of the founding parents. In this case the linkage phase is still known, and selection is for genotypes that are homozygous for the target gene brought by the founding parent but heterozygous for the other targets. Hence, that target gene need not be fixed subsequently, increasing the probability of getting the ideotype. The choice of the parent to use may be subject to particular considerations depending on the value of the founding parents, the position of the loci, etc., and was therefore not considered in this study.
Another alternative to these methods would be to self the root genotype directly to obtain the ideotype. However, selfing the root genotype breaks the linkage between favorable alleles, and in general one cannot identify these breaks because linkage phase is rarely known in selfed populations. Selfing the root genotype and the following offspring would therefore be counterproductive and span too many generations when compared to the methods previously cited.
Pedigree height:
The number of generations a pedigree spans is called the height of the pedigree, denoted h. This height varies with the pedigree considered. Recalling that the fixation steps considered in this work span two generations, the complete gene-pyramiding scheme spans h + 2 generations.
A pedigree is of maximum height when just one cross is performed at each generation (involving an intermediate genotype H and a founding parent). We call this type of pedigree a cascading pedigree in the rest of the article. As only one new gene is cumulated at each generation, the height of a cascading pedigree is n − 1.
Conversely, a pedigree is of minimum height when the maximum number of crosses is performed at each generation. For any number of loci n, we can always find two unique integers a and b so that n = 2a + b, with 0 < b ≤ 2a. It is then easy to show that the minimum height of a pedigree is a + 1. Finally, we get that the height h of a pedigree cumulating n genes satisfies
 |
1 |
where ⌈x⌉ denotes the smallest integer larger or equal to x.
Number of pedigrees:
The number of pedigrees cumulating n genes is the number of binary trees with n labeled leaves, a problem studied many years ago (Rohlf 1983). Here we show another way to calculate this number. The root genotype of a pedigree cumulating n target genes comes from the cross of two parents carrying, respectively, p and n − p target genes, where (1 ≤ p ≤ n − 1). Let 𝒜(p) be the number of subpedigrees cumulating p specified genes. Summing up over all possible values of p, we can compute the number 𝒜(n) of pedigrees cumulating n genes via
 |
2 |
The factor 1/2 is there to ensure that the crossing of two given parents is counted only once. This recursion can be solved (see appendix A) and leads to
 |
3 |
for the total number of pedigrees cumulating the n genes. Table 1 gives some numerical values of 𝒜(n); clearly the total number of pedigrees increases very fast with the number of loci considered. This shows that for more than five genes, a hand enumeration of all pedigrees is hopeless and so a computerized approach is mandatory.
TABLE 1.
The number 𝒜(n) of distinct pedigrees for the cumulation ofn genes
| n | 3 | 4 | 5 | 6 | 7 | 8 | 10 | 20 |
|---|---|---|---|---|---|---|---|---|
| 𝒜(n) | 3 | 15 | 105 | 945 | 10,395 | 135,135 | 3.4 × 10⁷ | 8.2 × 10²¹ |
We now describe an algorithm to build up all these pedigrees. Because of the fast increase of 𝒜(n) with n, the number of loci that can be treated will necessarily be quite limited, even when running such an algorithm on a very powerful computer.
A simple algorithm to build all possible pedigrees:
To obtain a pedigree of height h, we can merge two subpedigrees, one of height h − 1 and one of height ≤h − 1. Note that, as we demand that founding parents are involved in only one cross in a pedigree, we merge only subpedigrees whose root genotypes have no target genes in common. From this, we infer an iterative process to build all possible pedigrees for cumulating n genes.
We consider the founding parents as pedigrees of null height (h = 0). Assuming we have constructed all pedigrees of height ≤h, we generate all pedigrees of height h′ = h + 1 as follows:
Examine all distinct pairs of subpedigrees {𝒫1, 𝒫2} of respective heights h1 and h2, with h1 = h and h2 ≤ h.
If the root genotypes of 𝒫1 and 𝒫2 do not have any target genes in common, merge 𝒫1and 𝒫2 to form a subpedigree 𝒫.
If 𝒫 cumulates all n genes, store it; otherwise add it to the list of subpedigrees of height h′ = h + 1.
This construction can be iterated until the maximum height is reached, namely h′ = n − 1 (see Equation 1). In Figure 3 we sketch the progress of this algorithm in the case of four genes.
Figure 3.—

Example of progress of the algorithm when building all pedigrees cumulating four loci. (For subpedigree heights greater than one, only a few cases are shown.) Shaded squares represent intermediate genotypes cumulating less than four favorable genes. Intermediate genotypes that cumulate all four genes are labeled Hs1s2 (see meaning in text); they are the root genotypes. Dashed boxes indicate the two subpedigrees merged at the current step.
Gene transmission probabilities through a pedigree:
Let us focus on a particular pedigree node, corresponding to an intermediate genotype Hs1s2. On the basis of the recombination fractions between loci, we can compute the probability that Hs1s2 passes on to its offspring the set of genes s that is the union of s1 and s2. If we denote by ν(s) the total number of genes in the set s, we have ν(s) = ν(s1) + ν(s2). Let {ai} be the genes in set s ranked according to their position on the genetic map, so that  Let rx,y be the recombination fraction between x and y. The probability that a gamete generated by Hs1s2 contains the set s of genes is
 |
4 |
where  if genes ai and ai+1 are in different subsets and
  otherwise. Note that other target genes might be on the map, located between the ai's, but not belonging to the set s; recombinations between those genes do not matter here. As an example illustrating Equation 4 consider the genotype H(1,3)(2,5,6). The probability that it passes the set (1, 2, 3, 5, 6) is
 |
5 |
Knowing these probabilities, the overall probability of obtaining the root genotype of a given pedigree is the product, over all the pedigree's nodes (other than the root node), of the probabilities calculated as in Equation 4.
Minimum population sizes necessary to obtain the ideotype:
Let's call pf and pm the probabilities computed as in (4) that each parent of a given node passes on its particular subset of genes. From these probabilities we can compute the population size N needed to get the intermediate genotype at this node with a probability of success γ. The probability that none of the N offspring has the right genotype is (1 − pfpm)N; identifying this with 1 − γ gives
 |
6 |
where ln denotes the natural logarithm. From (6), we can compute the population sizes required at each node. Now the overall probability of success of the pedigree is the product of the probabilities of success at each of its nodes. Similarly, we can compute the population sizes required for the fixation steps. The nodes associated with combining two founding parents always pass on their target genes. Let p be the number of other nodes in the breeding scheme; if they all have the same probability of success γ as considered here, then the overall probability of success of the gene-pyramiding scheme is γp. The sum of all population sizes needed in the gene-pyramiding scheme (pedigree and fixation steps) is denoted by Ntot. The largest of the population sizes to be handled at any node or step during the whole gene-pyramiding scheme is denoted by Nmax.
RESULTS
We have developed a computer program implementing the algorithm described in the methods section that builds all pedigrees leading to the ideotype for a given number n of genes. Then, given the ri,j values, the program determines the gene transmission probabilities and the cumulated population size Ntot for each pedigree followed by the fixation steps. We now apply this algorithm to a set of particular cases to illustrate the results obtained with our method.
Cumulating four genes: a case study:
Using our program, we have generated the 15 possible pedigrees for cumulating four genes located on a single chromosome. We assume that the recombination fractions between adjacent loci are the same and correspond to 20 cM, using Haldane's mapping function. As the recombination fraction is the same for all pairs of adjacent loci, some gene-pyramiding schemes have the same transmission probability or population sizes. In that case, we show only one example per cumulated population size. Figure 4 shows the three schemes that necessitate the smallest Ntot and gives the allelic transmission probabilities for each one. The population sizes were computed so that the probability of success of each scheme was 0.99. In the scheme based on a cascading pedigree (Figure 4a), there are four nodes for which the probability of obtaining the intermediate genotype is not 1. The probability of success used at each of those nodes was thus 0.991/4 = 0.9975. In the two other gene-pyramiding schemes, the number of such nodes is three, so that the probability of success used at each of these nodes was 0.991/3 = 0.9967. The hybrids between founding parents are obtained with a probability of 1, so that the population required at the corresponding nodes was assumed to be one individual. The population size needed at each node is indicated. The cumulated population size Ntot is also given.
Figure 4.—


Representation of three different gene-pyramiding schemes cumulating four loci. Scheme a is based on a cascading pedigree. Schemes b and c differ by the order of crosses of the founding parents. The target genes are represented by solid circles. Other genes are represented by shaded boxes. At each node we give the transmission probabilities of the targeted genes from parent to offspring. When the probability equals one, it is not indicated. The population sizes needed at each node (N) and the cumulated population size (Ntot) are given.
Figure 4a shows a gene-pyramiding scheme involving a cascading pedigree. It spans five generations (h = n − 1 = 3 for the pedigree height, plus two generations for the fixation steps) and requires the smallest cumulated population size of all the schemes. The two other best schemes last four generations [h = Log2(n) = 2 for the pedigree height plus two generations for the fixation steps]. The scheme that necessitates the next smallest Ntot is the one represented in Figure 4b. It cumulates loci 1 and 4 on one subpedigree and 2 and 3 on the other, before generating the H(1,2,3,4)(B) genotype. The population sizes needed for this gene-pyramiding scheme are large at all nodes when compared to the cascading type. The gene-pyramiding scheme represented in Figure 4c necessitates an even larger Ntot because a huge population size is needed to produce the root genotype H(1,2)(3,4); conversely, the population size needed to produce the H(1,2,3,4)(B) genotype is much smaller.
We see here that cascading pedigrees are less expensive in terms of population sizes when compared to other pedigrees. This can be understood from the fact that the node at the second generation of the noncascading pedigrees involves a genotype composed of two gametes that are both obtained by rare recombination events. Since the recombination probabilities are quite low, the probability of obtaining the target genotype is very low. Hence, population sizes needed at this step are typically enormous. On the contrary, for cascading pedigrees, only one of the parental gametes requires a recombination event; hence the population sizes needed at each step of a cascading pedigree are much smaller than those for other pedigrees. In our case with four loci, the scheme with a cascading pedigree spans one generation more than other schemes but requires a much smaller Ntot; hence, cascading pedigrees are a good choice. However, when more loci are to be cumulated, the difference in heights (i.e., in duration), between cascading pedigrees and other types of pedigrees becomes more important as is illustrated below. Also, we see that the advantage of cascading pedigrees relative to other types of pedigrees depends on the method used to cross individuals at each node.
Cumulating many genes:
We now examine a case with eight loci to get a feeling for the qualitative behavior in the case of a larger number of target genes. We work again with a constant recombination fraction between adjacent loci corresponding to a Haldane mapping distance of 20 cM. Of interest are the cumulated population size (Ntot), the greatest population size among all nodes (Nmax), and the total number of generations needed to derive the ideotype. We examine these numbers for three breeding strategies.
Reference method for comparison (MBRS):
We take as a reference method the MBRS strategy proposed by Hospital et al. (2000). An individual's molecular score is computed as the number of target genes it carries. To avoid fixation of unfavorable alleles because of linkage disequilibrium and drift, individuals are selected on the basis of a “QTL complementation” strategy that has been shown to be more efficient than simple “mass selection” on the molecular score. In their study, Hospital et al. (2000) started from a population in linkage equilibrium; here, we use a starting population composed of founding parents, which is thus in linkage disequilibrium. To use MBRS as a reference method, we simulated that breeding scheme and considered that it was complete when the ideotype was obtained in 99% of the simulations performed. We also assumed a constant population size throughout generations; if Ng is the population size at each generation, then the cumulated population size (Ntot) is Ng times the number of generations. Naturally, increasing Ng leads to completing the breeding scheme in fewer generations. But, when using realistic population sizes, we found that with MBRS the breeding scheme did not complete in <7 generations. Conversely, we did not consider >12 generations of MBRS because Ng was already small enough (70) for 12 generations.
Pairwise crossing 1 method:
Our second breeding strategy is to produce the ideotype by gene pyramiding (generating pedigrees), minimizing the cost (Ntot) over all choices of crosses as described in methods. We refer to this strategy as pairwise crossing of the first type (PWC1). Taking the gene-pyramiding scheme with the lowest Ntot for each height, we show in Table 2 our results for schemes spanning from five to nine generations. (As before, we impose that the ideotype is obtained with probability 0.99.) The gene-pyramiding scheme spanning five generations is based on a pedigree that is a perfectly balanced pyramid of height Log2(8) = 3, where the maximum number of crosses is performed at each generation. It starts with the eight founding parents; at the first generation four crosses are performed leading to four intermediate genotypes. At the second generation two crosses are performed and at the third generation a single one is. After these three generations are the fixation steps that span two generations. The scheme spanning a total of nine generations is based on a cascading pedigree; it is the one that necessitates the smallest cumulated population size Ntot and has the smallest Nmax. For the gene-pyramiding schemes spanning less than nine generations, Ntot and Nmax are larger. This can be explained in the same way as in the four-loci case: when following a noncascading pedigree, at least one intermediate genotype must be obtained that carries two gametes, both of which are produced by rare recombination events. The probability of obtaining such an intermediate genotype is typically very low so the associated population size is quite large. On the contrary, cascading pedigrees never have high Nmax values.
TABLE 2.
Minimum population sizes needed to cumulate eight genes following different strategies: by optimization of gene pyramiding (PWC1 and PWC2) or by marker-based recurrent selection (MBRS)
| PWC1
|
PWC2
|
MBRS
|
||||
|---|---|---|---|---|---|---|
| G | Ntot | Nmax | Ntot | Nmax | Ntot | Ng |
| 5 | 4415 | 1248 | — | — | — | — |
| 6 | 2741 | 1248 | — | — | — | — |
| 7 | 2421 | 870 | 1147 | 341 | 7560 | 1080 |
| 8 | 2183 | 606 | 1166 | 341 | 3440 | 430 |
| 9 | 1394 | 341 | 1273 | 341 | 1710 | 190 |
| 10 | — | — | — | — | 1100 | 110 |
| 11 | — | — | — | — | 880 | 80 |
| 12 | — | — | — | — | 840 | 70 |
The results obtained with each strategy are presented for different durations G of the breeding scheme, that is, for different numbers of generations. The cumulated population size (Ntot) and the greatest population size (Nmax) of each breeding scheme are given while Ng is the (constant) population size at each generation for MBRS. The eight loci are placed on a single chromosome, and the distance between adjacent loci is 20 cM. The different strategies are described in the text; for each breeding scheme, the probability of obtaining the ideotype was 0.99.
One sees from Table 2 that the optimal crossing with PWC1 always requires a smaller cumulated population size (Ntot) than MBRS does for a given number of generations. However, cumulated population sizes with PWC1 are still not small and do not decrease very rapidly with increased duration. Moreover, PWC1 requires larger Nmax than MBRS does except when one uses seven generations. Clearly, for schemes spanning seven generations, PWC1 is a better choice than MBRS from any point of view and is thus preferred. Yet, it is harder to draw a general conclusion from the results in Table 2 for other durations. Strictly speaking, the choice of a breeding strategy should incorporate economical and practical considerations that are beyond the scope of this article. In particular, one has to consider: (i) the cost of genotyping (depending mostly on Ntot, though not only), (ii) the cost of pairwise crossings that might be more demanding than random mating depending on the species, and (iii) whether the limiting step at Nmax is feasible given the genotyping facilities. As is often the case in breeding theory, a trade-off between duration and cost is observed here (lower cost for longer duration). However, using durations greater than nine generations would take us out of this article's framework. More explicitly, considering pedigrees lasting more generations than the maximum given in Equation 1 requires allowing for other kinds of pedigrees, involving, for instance, founding parents multiple times or the use of extra crosses when a given one fails. Such extensions of our framework were not considered.
Nevertheless, because of the large values of Ntot found in PWC1, we now investigate whether a modified crossing method can lower the population size needed (i.e., the cost) further in the hope of exhibiting a gene-pyramiding scheme that would more clearly outcompete MBRS.
Pairwise crossing 2 method:
Clearly the main bottlenecks of noncascading pedigrees are their use of rare recombinations at some nodes, arising generally at advanced generations. To alleviate this problem, we now adopt a modified crossing procedure at each node, which we call pairwise crossing of the second type (PWC2).
In this modified gene-pyramiding strategy, we extend PWC1 by introducing a two-step hybridization procedure to derive intermediate genotypes. This is illustrated in Figure 5. Suppose an intermediate genotype H is to be obtained from the cross of two (nonfounding) parents Hm and Hf. Rather than cross Hm and Hf directly, we first cross each separately to a blank parent. From the resulting offspring, we select those individuals carrying all of their parent's favorable alleles (necessarily in coupling). Then two such individuals are crossed to give H. The key point with this two-step hybridization procedure is that the two gametes coming from a recombination can be selected independently. The efficiency of this strategy comes from the fact that the sum of the population sizes needed to obtain independently two gametes in separate crosses is generally much lower than the population size needed to obtain them jointly in a single cross. A specific example of the reduction in population size with PWC2 can be found in appendix B. Hence, the cost of obtaining genotypes from the crosses with the blank parent can be much lower than that with the hybridization performed in the PWC1 strategy.
Figure 5.—
The two-step hybridization procedure for obtaining an intermediate genotype carrying favorable alleles at four loci (1, 2, 3, 4) from two parents carrying favorable alleles at loci (1, 2) and (3, 4). The first step is performed by crossing each parent with a blank genotype (not represented here). The resulting offspring, carrying the corresponding target genes in coupling phase on one of their chromosomes, are then mated to obtain the desired genotype, H(1,2)(3,4).
Conversely, this two-step hybridization procedure has the drawback of adding an extra generation at each of the corresponding PWC1 nodes where it is used. (Note that if a founding parent is involved in a cross, we do not perform the two-step hybridization as it is never useful.) This effect increases the total pedigree duration by at most h − 1, where h is the pedigree height in the PWC1 framework. Hence, the total duration of a PWC2 scheme is less than double that of the corresponding PWC1 scheme. The net effect is to favor pedigrees involving many nodes per generation (e.g., perfectly balanced pedigrees) compared to pedigrees involving few nodes per generations (e.g., cascading pedigrees). Because of this, the value of noncascading pedigrees compared to cascading ones is enhanced as is seen below.
When cumulating eight loci using PWC2, we obtained results for schemes spanning from seven to nine generations (Table 2). Compared to PWC1, the durations of the optimal breeding schemes are increased at most by two generations, but with the PWC2 strategy, the Ntot needed are significantly reduced as can be seen in Table 2.
With PWC1, the schemes lasting nine generations corresponded only to cascading pedigrees. With PWC2, schemes lasting nine generations include both cascading and noncascading pedigrees. (Note that cascading pedigrees are not affected by PWC2 since a founding parent is involved at each cross.) The best scheme lasting nine generations with PWC2 in Table 2 does not correspond to a cascading pedigree and has a lower Ntot than the best PWC1 of the same duration.
Because PWC2 favors pedigrees having many nodes per generation, it is interesting to note that in Table 2 the scheme that requires the smallest cumulated population size is also the one that spans the fewest generations. Thus PWC2 fulfills both objectives of gene pyramiding: minimization of pedigree duration and of pedigree cost! Unless an even faster strategy is mandatory, e.g., for economic reasons, this pedigree using the two-step hybridization procedure is optimal.
DISCUSSION
This study describes a general framework for the pyramiding of multiple genes into a single genotype. By combining these results with those available for various other aspects of marker-assisted selection (Dekkers and Hospital 2002) it is now possible to optimize complex breeding schemes incorporating molecular information. The possibility of developing specific genotypes rapidly at low cost is of general interest not only for plant or animal breeding but also for fundamental studies on the genetic architecture of complex traits: examples are validation of candidate genes or QTL effects, studies of genes by genetic background interactions, gene-gene epistatic interactions, etc.
In our study, we made some simplifying assumptions on the genotype of the founding parents for the sake of demonstration. In particular, we supposed that founding parents were homozygous for the favorable allele at each target locus. However, in our framework, it is also possible to study gene-pyramiding schemes starting from an arbitrary population of different founding parents. Then, founding parents other than the simple ones we used can be input at the top of the tree. For example, one such case is when one wants to cumulate QTL. In this case the targets in the founding parents are not the genes of interest (QTL) themselves, but markers linked to those genes. Then, one can simply run our algorithm with founding parents, each carrying several markers, instead of one target.
The only limitation for the genotype of the founding parents is that the linkage phase of favorable alleles must be given. If this linkage phase is not known, it is still possible to compute the gene transmission probabilities conditionally on all possible linkage phases of target genes in the founding parents. These probabilities can then be used for the computation of optimization criteria. As an example, one may use a conservative strategy to minimize cumulated population sizes: first, compute all gene transmission probabilities for the different possible linkage phases; then consider the linkage phase associated with the smallest probability and compute cumulated population sizes accordingly. Alternatively, one may average the cumulated population sizes over all possible linkage phases.
Our algorithm builds pedigrees assuming that each step is successful. However, even with high success rates at each node, it is possible that in a particular case one of the pedigree steps will be unsuccessful. In this case, in the offspring of the corresponding cross, we obtain genotypes that carry less target genes than the intermediate genotype wanted. However, as crosses are performed between genotypes carrying complementary sets of genes, the linkage phases of the offspring genotypes are always known; hence, these genotypes can be considered as founding parents. Thus, if a step has been unsuccessful, the best strategy is to restart the algorithm using as founding parents all the available genotypes (usually the founding parents plus the genotypes obtained so far).
In some situations, we have used crosses between intermediate genotypes and what we called a blank parent. A possible alternative to such crosses is to perform a generation of haplo-diploidization. Unfortunately, this technique is not available for all organisms.
An interesting case occurs when the blank parent is a recurrent parent with an elite genetic background in which one wants to introgress all favorable genes. In this case, the last fixation step can be performed after the marker-assisted introgression of the favorable genes in a homogeneous genetic background. It is then possible to combine the present results with those on the optimization of marker-assisted introgression strategies, which has been studied extensively by various authors (e.g., Melchinger 1990; Hospital et al. 1992; Visscher et al. 1996; Hospital and Charcosset 1997; Hospital 2001; Servin and Hospital 2002).
Another interesting case is to replace the blank parent by one of the founding parents or by an intermediate genotype. Also, one should consider the case where a founding parent, or any intermediate genotype, can participate in more than one cross in the pedigree. Such extensions of the framework, which surely needs more theoretical development, should be a valuable step toward a complete theory of selection, including convergence with the general case of random mating.
In our calculations, we kept a constant overall success rate for different schemes and used it to compute a success rate per node, which was the same for all nodes within a scheme (except for nodes with probability of success equal to one). This was done for the sake of demonstration to compare different schemes. However, this probably leaves space for some additional optimization that was not considered here. For example, one could investigate the changes in the population sizes when reducing either the overall success rate of the scheme or the success rates at some particular nodes and balancing this with the risk of having to redo some failed nodes (see above). The ranking of the pedigrees may be slightly modified by this variation but it will not affect the overall pros and cons of cascading and crossing with blank parents.
Finally, the main limitation of the method proposed here is that the number of possible pedigrees becomes very large as one increases the number of loci, so the computer program implementing the exhaustive enumeration cannot handle more than a dozen loci. For larger numbers of loci, one possibility is to apply our method for each chromosome separately (a dozen targets per chromosome being now a bearable bound in real situations) and assume that subsets of loci located on different chromosomes can be cumulated in parallel and then combined in a few generations to obtain the ideotype across chromosomes. This would probably give a reasonably good approximation of what the optimal pedigree across chromosomes might be. However, it may not give the exact solution, which is an unsatisfactory situation from a theoretical viewpoint. To really tackle more loci, some intermediate optimization should select the best subpedigree producing a given intermediate genotype that must be used. This kind of “pruning” approach can be converted into a dynamic programming algorithm that no longer needs to enumerate all pedigrees. We are currently exploring this strategy.
Acknowledgments
The authors thank Piet Stam and an anonymous referee for their helpful comments on the manuscript. Bertrand Servin was supported by Institut National de la Recherche Agronomique and Euralis Genetics grant BTH00956.
APPENDIX A
Here we show how to compute the total number of different pedigrees. We start from the recursion relation (2) in the text:
 |
A1 |
The initial condition is 𝒜(1) = 1. We introduce the generating function
 |
A2 |
Using (A1), one finds that the function g(u) satisfies the equation
 |
A3 |
which gives
 |
A4 |
Now recall the series expansion
 |
A5 |
where Γ is Euler's Gamma function [which satisfies Γ(x + 1) = xΓ(x) and  ]. If we plug (A5) into (A4), the identification of the resulting coefficients with those in (A2) leads to
 |
A6 |
APPENDIX B
We show through an example that the PWC2 strategy allows one to reduce drastically the minimum population size required to obtain an intermediate genotype. We consider the pedigree node shown in Figure 5 and calculate the minimum population size required by each strategy to obtain the intermediate genotype H(1,2)(3,4). We consider that the distance between adjacent loci is 20 cM. This corresponds, using Haldane's mapping function, to a probability of recombination between adjacent loci of 0.16484. We set the overall probability of success for each strategy to be 0.99.
The PWC1 strategy generates H(1,2)(3,4) from H(1)(2) and H(3)(4) in a single step. The relevant probability is 0.164842/4. Using Equation 6, the necessary population size is found to be 676.
PWC2 uses two steps to obtain H(1,2)(3,4) from H(1)(2) and H(3)(4). As the PWC2 strategy involves three nodes, we set the probability of success of each of these nodes to be 0.991/3 = 0.9967. The first step of PWC2 is aimed at obtaining separately the genotypes H(1,2)(B) and H(3,4)(B). The probability of each of these events is 0.16484/2, and the corresponding population size required is 67 for each. Finally, H(1,2) and H(3,4) are mated to obtain the desired genotype. The corresponding probability is (1 − 0.16484)2/4 and the population size is 30. In total, the PWC2 strategy requires 164 individuals, which is about four times less than what PWC1 requires.
References
- Charmet, G., N. Robert, M. Perretant, G. Gay, P. Sourdille et al., 1999. Marker-assisted recurrent selection for cumulating additive and interactive QTLs in recombinant inbred lines. Theor. Appl. Genet. 99: 1143–1148. [Google Scholar]
- Dekkers, J., and F. Hospital, 2002. The use of molecular genetics in the improvement of agricultural populations. Nat. Rev. Genet. 3(1): 22–32. [DOI] [PubMed] [Google Scholar]
- Hospital, F., 2001. Size of donor chromosome segments around introgressed loci and reduction of linkage drag in marker-assisted backcross programs. Genetics 158: 1363–1379. [DOI] [PMC free article] [PubMed] [Google Scholar]
- Hospital, F., and A. Charcosset, 1997. Marker-assisted introgression of quantitative trait loci. Genetics 147: 1469–1485. [DOI] [PMC free article] [PubMed] [Google Scholar]
- Hospital, F., C. Chevalet and P. Mulsant, 1992. Using markers in gene introgression breeding programs. Genetics 132: 1199–1210. [DOI] [PMC free article] [PubMed] [Google Scholar]
- Hospital, F., L. Moreau, F. Lacoudre, A. Charcosset and A. Gallais, 1997. More on the efficiency of marker assisted selection. Theor. Appl. Genet. 95: 1181–1189. [Google Scholar]
- Hospital, F., I. Goldringer and S. Openshaw, 2000. Efficient marker-based recurrent selection for multiple quantitative trait loci. Genet. Res. 75: 357–368. [DOI] [PubMed] [Google Scholar]
- Lande, R., and R. Thompson, 1990. Efficiency of marker-assisted selection in the improvement of quantitative traits. Genetics 124: 743–756. [DOI] [PMC free article] [PubMed] [Google Scholar]
- Lange, C., and J. Whittaker, 2001. On prediction of genetic values in marker-assisted selection. Genetics 159: 1375–1381. [DOI] [PMC free article] [PubMed] [Google Scholar]
- Melchinger, A., 1990. Use of molecular markers in breeding for oligogenic disease resistance. Plant Breed. 104: 1–19. [Google Scholar]
- Meuwissen, T., B. Hayes and M. Goddard, 2001. Prediction of total genetic value using genome-wide dense marker maps. Genetics 157: 1819–1829. [DOI] [PMC free article] [PubMed] [Google Scholar]
- Moreau, L., A. Charcosset, F. Hospital and A. Gallais, 1998. Marker-assisted selection efficiency in populations of finite size. Genetics 148: 1353–1365. [DOI] [PMC free article] [PubMed] [Google Scholar]
- Rohlf, F., 1983. Numbering binary trees with labeled terminal vertices. Bull. Math. Biol. 45(1): 33–40. [DOI] [PubMed] [Google Scholar]
- Servin, B., and F. Hospital, 2002. Optimal positioning of markers to control genetic background in marker-assisted backcrossing. J. Hered. 93(3): 214–217. [DOI] [PubMed] [Google Scholar]
- van Berloo, R., and P. Stam, 1998. Marker-assisted selection in autogamous RIL populations: a simulation study. Theor. Appl. Genet. 96: 147–154. [Google Scholar]
- Visscher, P., C. Haley and R. Thompson, 1996. Marker-assisted introgression in backcross breeding programs. Genetics 144: 1923–1932. [DOI] [PMC free article] [PubMed] [Google Scholar]