Abstract
Objectives. We analyzed urban–rural differences in intentional firearm death.
Methods. We analyzed 584629 deaths from 1989 to 1999 assigned to 3141 US counties, using negative binomial regressions and an 11-category urban–rural variable.
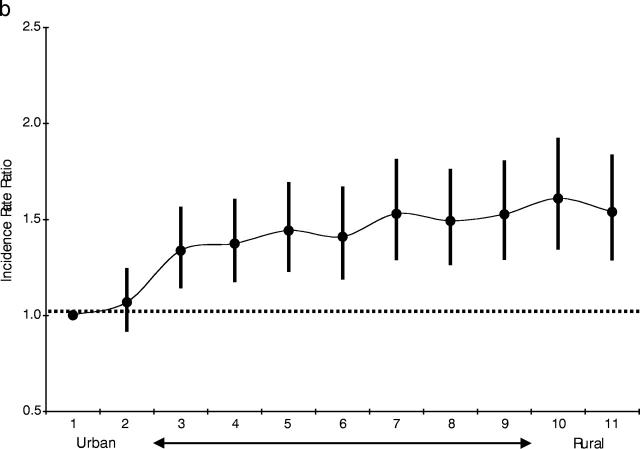
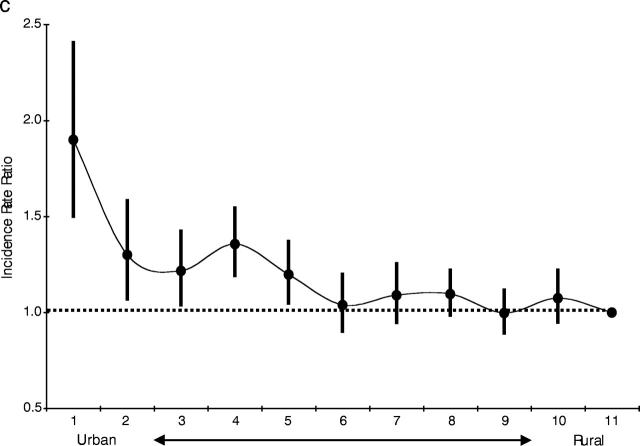
Results. The most urban counties had 1.03 (95% confidence interval [CI]=0.87, 1.20) times the adjusted firearm death rate of the most rural counties. The most rural counties experienced 1.54 (95% CI=1.29, 1.83) times the adjusted firearm suicide rate of the most urban. The most urban counties experienced 1.90 (95% CI=1.50, 2.40) times the adjusted firearm homicide rate of the most rural. Similar opposing trends were not found for nonfirearm suicide or homicide.
Conclusions. Firearm suicide in rural counties is as important a public health problem as firearm homicide in urban counties. Policymakers should become aware that intentional firearm deaths affect all types of communities in the United States.
In the 1990s, the United States experienced over 330000 deaths intentionally committed with firearms.1–3 A considerable number of these firearm deaths were homicides occurring in large US cities.4 Although these numbers argue for serious consideration of urban crime prevention programs, they may also contribute to the perception of intentional firearm death in the United States as a principally urban, principally criminal phenomenon.5
Over the same decade, firearm suicides occurred in greater numbers than firearm homicides, accounting for over half of all intentional firearm deaths in the United States.3 A disproportionate number of these firearm suicides most likely occurred in rural areas.6 Nevertheless, because rural health issues are often not on equal footing with those in urban areas,7 and because suicide is not a crime,8,9 attention to firearm suicide as a preventable public health problem was limited in the 1990s.10
Previous peer-reviewed studies have found basic differences between urban and rural counties in terms of firearm homicide victimization rates among teenagers and young adults11,12 but have not placed these differences within the context of all intentional injury deaths, including firearm suicide. In this report we more fully assess the differences between urban and rural counties for all intentional injury deaths occurring during an 11-year period in the United States. By doing so, we intend to better discern the relative risk of intentional firearm death, compared with other mechanisms of intentional injury death, in urban versus rural communities.
METHODS
Participants and Data Sources
We accessed multiple-cause-of-death data files from the National Center for Health Statistic’s National Vital Statistics System from 1989 to 1999, inclusively. These data files are created through the uniform registration of death certificates at the state level. From among all US deaths, we analyzed suicides and homicides based on the ICD-9 and ICD-10 external cause codes E950-E958.8, E960-E968.8, X60-X83, Y87.0, X85-Y08, Y87.1. For our analysis, these suicides and homicides were further separated into those involving and those not involving firearms. Although we focused on firearm deaths, the comparative analysis of nonfirearm deaths was included as a useful point of reference with which to ground our findings for firearm deaths. This comparative approach between firearm and nonfirearm deaths has been of value in previous research, which we followed in our analysis.11
Finally, we excluded deaths due to police action, military action, or judiciary execution. These so-called legal intervention deaths, while intentional, were committed under motives believed to be distinct from those of the intentional injury deaths we analyzed.
Each decedent was assigned to the US county in which his or her suicide or homicide occurred. County assignments were based on Federal Information Processing Standards geographic codes and included suicides and homicides that occurred in counties with fewer than 100000 persons, per a special data request approved by the Division of Vital Statistics at the National Center for Health Statistics. We chose county of occurrence as opposed to county of residence because injuries do occur outside of the home and therefore potentially outside of counties of residence. Only a relatively small percentage of suicides (13.3%) and homicides (15.1%) in our study cohort occurred outside of their county of residence. We thus sought to better understand the immediate context within which suicides or homicides occurred, and not necessarily their residential context, which may or may not have been influential at the time of injury.
Aside from states, counties (equivalently known as parishes, boroughs, and independent cities in some states) are the major legally defined political and administrative units of the United States.13 All 3141 US counties were included in our analysis. As primary governmental divisions, county boundaries and names rarely change.13 Our county list included the District of Columbia as a county equivalent. We also tracked and accounted for any county names or Federal Information Processing Standards codes that had changed over the study period.
Nine outcome variables were calculated per county for each year of the 11-year study period: total intentional injury deaths, suicides, homicides, total intentional firearm deaths, firearm suicides, firearm homicides, total intentional nonfirearm deaths, nonfirearm suicides, and nonfirearm homicides. These 9 variables were analyzed relative to an 11-category ordinal variable that was assigned to each county per year of the study. This ordinal variable distinguished counties by considering both population size and proximity to metropolitan areas (Table 1 ▶). As such, it provided information different from the simple categorizing of counties on the basis of population size, land area, proximity to metropolitan areas, or population density, each as singular variables.
TABLE 1—
Descriptions of Urban–Rural County Classification Codes
| County Code | Description | Percentage of U.S. Counties | Percentage of U.S. Population |
| Code 1 | Central counties of 1 million population or more. | 1.0 | 23.8 |
| Code 2 | Central counties of metropolitan areas of 1 million population or more. | 4.4 | 20.6 |
| Code 3 | Fringe counties of metropolitan areas of 1 million population or more. | 3.9 | 4.9 |
| Code 4 | Counties in metropolitan areas of 250 000 to 1 million population. | 10.2 | 22.1 |
| Code 5 | Counties in metropolitan areas of fewer than 250 000 population. | 6.8 | 8.1 |
| Code 6 | Urban population of 20 000 or more, adjacent to a metropolitan area. | 4.8 | 4.0 |
| Code 7 | Urban population of 20 000 or more, not adjacent to a metropolitan area. | 4.1 | 2.8 |
| Code 8 | Urban population of 2500 to 19 999, adjacent to a metropolitan area. | 18.8 | 6.2 |
| Code 9 | Urban population of 2500 to 19 999, not adjacent to a metropolitan area. | 21.0 | 5.1 |
| Code 10 | Completely rural or less than 2500 urban population, adjacent to a metro area. | 8.1 | 1.1 |
| Code 11 | Completely rural or less than 2500 urban population, not adjacent to a metro area. | 17.0 | 1.5 |
The 11-category county classification variable that we used is equivalent to the widely recognized 10-category rural–urban continuum codes from the US Department of Agriculture,14 with the exception of the additional “central counties of one million population or more” category. Metropolitan areas with a population of greater than 1 million are often made up of multiple counties,13 but they may contain a select 1 or maybe 2 counties that are unusually distinct “nuclear”15 counties, surpassing the other counties in their metropolitan area in terms of population and, possibly, the risk of firearm mortality.16 Our 11-category county classification code has been used successfully as the independent variable of primary interest in previous analyses of intentional injury deaths.17
We also accounted for changes in several other county-level, independent variables that were hypothesized to have affected the occurrence of homicide and suicide over the study period. These independent variables included county measures of total population, average age, percentage of African Americans, percentage of Native Americans, percentage of Hispanics, percentage of males, per capita income, percentage of persons below the poverty level, percentage of the civilian labor force unemployed, percentage of female-headed households, percentage of persons living alone, percentage of persons over 14 years old who were married, percentage of persons over 18 years old who were college educated, beds per hospital among short-term general hospitals, and percentage of arrests that were drug-related. All independent variables were obtained from the US Census Bureau and the Area Resource File,18 with the exception of the drug-related arrest data, which were obtained from the Federal Bureau of Investigation’s county-level Uniform Crime Reports.19
Each independent variable was measured annually except for the urban–rural county classification codes, persons below the poverty level, female-headed households, persons living alone, persons married, and persons college educated. Information for these variables was available decennially, for certain intercensal years, or both. Intercensal years without data were linearly interpolated or forecast based on known values.
Statistical Analyses
Basic descriptive analyses of the 9 outcome variables as both total counts per county and rates per 100000 persons per county were completed. Following this, simple comparative analyses of the 9 outcome variables (both counts and rates) relative to the urban–rural county classification codes were completed. Intercooled Stata 8.0 for Windows statistical software was used for all our analyses (Stata Corporation, College Station, Texas).
We then tested the urban–rural county codes (as separate indicator variables for each code) along with the other independent variables as part of more detailed multivariate regression analyses. To account for overdispersion in our outcome variables, a negative binomial model was used.20 Excessively collinear independent variables were determined by pairwise Spearman rank correlation coefficients to be greater than 0.80. Only 1 variable from a group of excessively collinear variables was included in our final regression models.21 The log of population was treated as an offset term with a coefficient of 1, so that rate ratios could be calculated.
All regression coefficient standard errors were adjusted for clustering on counties using Huber/ White/sandwich estimators.22 In addition, we calculated a measure based on the deaths (depending on which of the 9 outcome variables was being analyzed) occurring in each county’s 10 nearest neighbor counties, weighted by the inverse distance between that index county’s centroid and each of its nearest neighbors’ centroids. This spatial weights variable was then included in our final models as an additional independent variable to adjust for the effects of spatial autocorrelation.23,24
We also included a linear year variable in our regression models and separately tested the interaction terms between this year variable and the 11-category county classification variable (which changed from year to year in some counties). This additionally reduced time-series autocorrelation and allowed us to measure annual trends, including those specific to each urban–rural county type, for all of our 9 outcome variables.
Seven of the independent variables included in our regression models had missing values, each with less than 1% of all county-level observations missing. One other independent variable, drug-related arrests, had 9.8% of its county-level observations missing.25–27 Missing values in all independent variables were imputed through a best-subset regression procedure.28
A series of figures were created to succinctly demonstrate rural–urban changes in both firearm and nonfirearm deaths. Only select numbers from within these figures are reported here. Complete copies of all the numbers used to create these figures are available on request from the lead author.
RESULTS
From 1989 to 1999, 584629 individuals died from intentional injuries; 57.8% were categorized as suicides and 42.2% as homicides. Firearms were involved in 62.9% of these deaths, and mechanisms other than firearms were involved in 34.5%. Mechanism of death was unknown for the remaining 2.6%.
Firearm Deaths
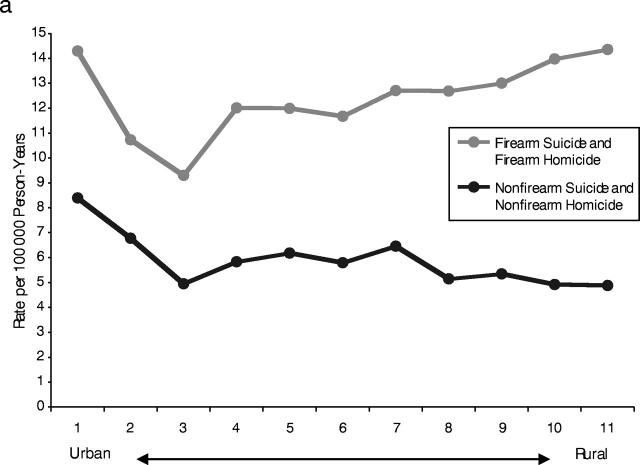
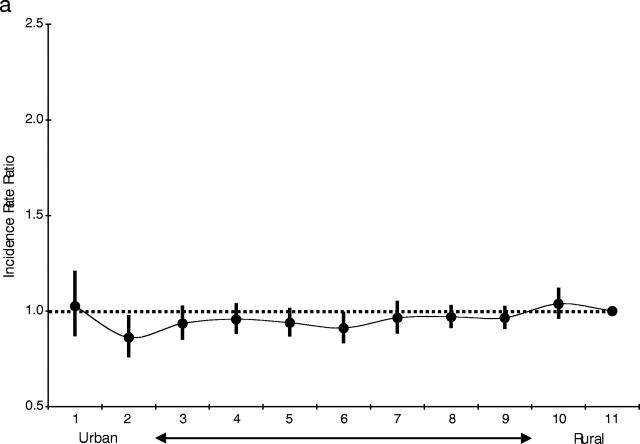
Over the 11-year study period, 367695 individuals died from an intentional firearm injury; 54.4% of these people were categorized as firearm suicides and 45.6% as firearm homicides. The unadjusted rate of all intentional firearm-related deaths was 12.77 per 100000 person-years from 1989 to 1999. This rate demonstrated limited variation across urban–rural county categories, with the most urban counties having essentially the same rate as the most rural (14.30 vs. 14.34 deaths per 100000 person-years, respectively; Figure 1 ▶). This relatively uniform trend also persisted after regression modeling was used to adjust for all other independent variables: the most urban counties had 1.03 (95% confidence interval [CI]=0.87, 1.20) times the average adjusted rate of the most rural (P=.705; Figure 2 ▶).
FIGURE 1—
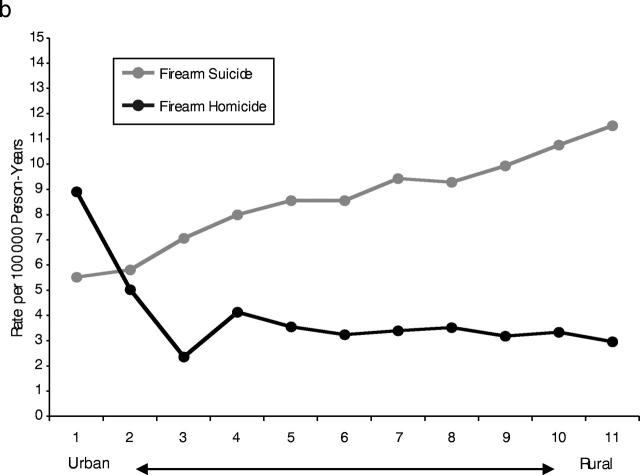
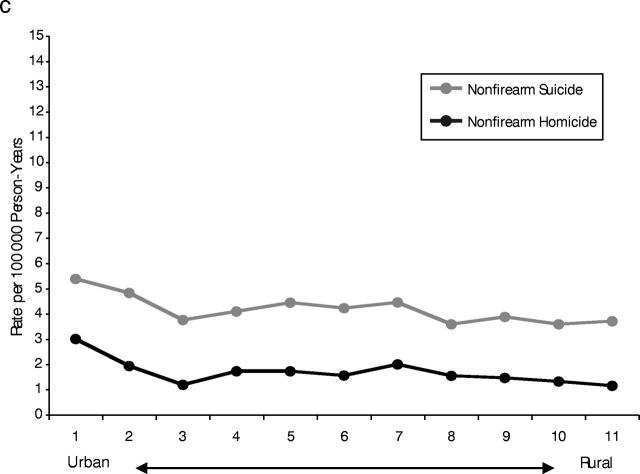
Unadjusted mortality rates by urban–rural county type: (a) intentional firearm and intentional nonfirearm, (b) firearm suicide and homicide, (c) nonfirearm suicide and homicide.
FIGURE 2—
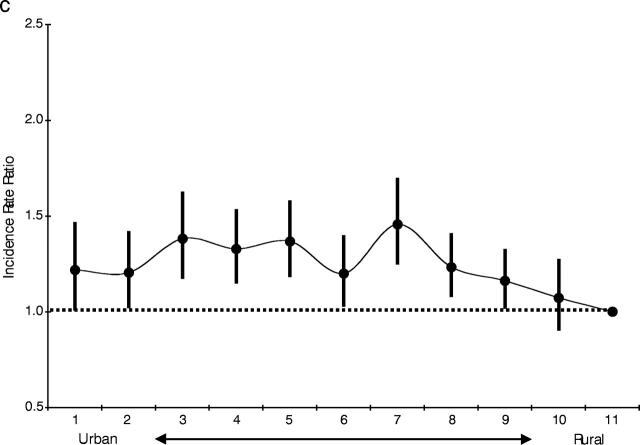
Regression-adjusted firearm relative risks and 95% confidence intervals by county type: (a) firearm suicide and homicide, (b) firearm suicide, (c) firearm homicide.
Firearm suicide rates showed an increasing trend from urban to rural counties. The most rural counties experienced 2.09 times the firearm suicide rate of the most urban counties before adjustment. After adjustment, the most rural counties experienced 1.54 (95% CI=1.29, 1.83) times the firearm suicide rate of the most urban (P<.001). Conversely, firearm homicide rates showed a decreasing trend from urban to rural counties. The most urban counties experienced 3.04 times the firearm homicide rate of the most rural counties before adjustment. After adjustment, the most urban counties experienced 1.90 (95% CI=1.50, 2.40) times the firearm homicide rate of the most rural counties (P<.001; Figures 1 ▶ and 2 ▶).
An adjusted trend analysis over time found that annual firearm homicide rates had decreased, on average, in all urban–rural county categories. Firearm homicide rates in the most urban counties demonstrated the greatest decrease of any urban–rural county category, with a 5.1% decrease per year (P<.001). Comparatively, annual firearm suicide rates increased, on average, in all urban–rural county categories, with firearm suicide rates in the most rural counties experiencing an increase of 1.1% per year (P=.109).
Nonfirearm Deaths
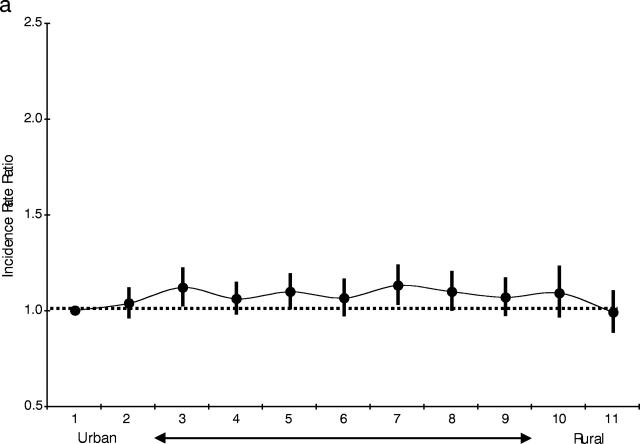
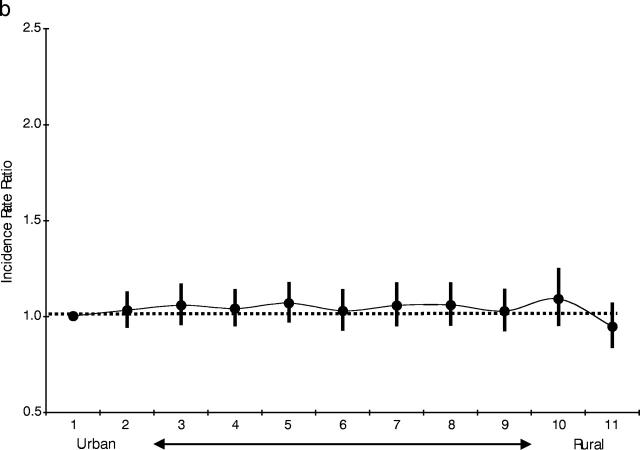
Of the 201561 individuals who died of intentional injuries not involving firearms over the 11-year study period, 67.9% were categorized as suicides and 32.1% as homicides. The unadjusted rate of all intentional nonfirearm-related deaths was 5.44 per 100000 person-years from 1989 to 1999. Unadjusted rates for all intentional nonfirearm deaths demonstrated some variation across urban–rural county categories, with the most urban counties having 1.71 times the rate of the most rural counties (Figure 1 ▶). This variation was dampened after regression modeling, with the most urban counties demonstrating 1.01 (95% CI=0.91, 1.12) times the average adjusted rate of the most rural (P=.819). The most urban counties experienced 1.46 times the non-firearm suicide rate of the most rural counties before adjustment. After adjustment, the most rural counties experienced 0.95 (95% CI=0.84, 1.06) times the nonfirearm suicide rate of the most urban counties (P=.370). The most urban counties experienced 2.50 times the nonfirearm homicide rate of the most rural counties before adjustment. After adjustment, the most urban counties experienced 1.22 (95% CI=1.01, 1.46) times the nonfirearm homicide rate of the most rural counties (P=.035; Figure 3 ▶).
FIGURE 3—
Regression-adjusted nonfirearm relative risks and 95% confidence intervals by county type: (a) nonfirearm suicide and homicide, (b) nonfirearm suicide, (c) nonfirearm homicide.
An adjusted trend analysis over time found that annual nonfirearm homicide rates had decreased, on average, in all urban–rural county categories except the most rural. Nonfirearm homicide rates in the most urban counties demonstrated the greatest decrease of any urban–rural county category: 5.2% per year (P=.002). Comparatively, annual nonfirearm suicide rates increased, on average, in all urban–rural county categories, with firearm suicide rates in the most rural counties experiencing an increase of 1.3% per year (P=.201).
DISCUSSION
After controlling for various social, demographic, and economic factors, we found that firearm death is as pervasive a public health problem in rural counties as it is in urban counties in the United States. This uniformity was the product of opposing trends between firearm suicide and firearm homicide in rural and urban counties. That is, although firearm mortality rates were similar in urban and rural areas, the rate of firearm suicide in America’s most rural communities closely resembled that of firearm homicide in her largest cities.
These same, opposing trends were not present for nonfirearm suicide and nonfirearm homicide. Mechanisms other than firearms that were used to kill oneself or others may not have been as attractive as firearms to subpopulations at high risk of intentional death in urban and rural areas. For instance, younger males at high risk for homicide in urban counties may have greatly preferred firearms over knives, the next most prevalent means of homicide.3 Similarly, older males at high risk for suicide in rural counties may have greatly preferred firearms over poisoning, the next most prevalent means of suicide.3 These preferences likely corresponded with the known lethality of firearms over other mechanisms29 and with the interest among certain subpopulations, most notably males, to “get the job done.”30,31 Trends in homicide and suicide were thus driven by firearm-related deaths, indicating that firearms are a unique mechanism of intentional injury that operate differently from other mechanisms in urban–rural comparisons.
Previous Research
The academic study of firearm mortality in the United States has been dominated by urban-only investigations.32–38 Rural-only studies of firearm mortality, however, have been extremely rare.39 This inequity likely contributes to the popular belief that firearm-related death is a criminal phenomenon primarily affecting large US cities.5,40,41 Although the problem of firearm mortality in large US cities should not be minimized, the perception that firearm mortality is a significantly greater problem in urban as opposed to nonurban communities is mistaken.
Studies that focus only on urban or only on rural areas lack the ability to generalize their findings and draw comparisons between varying levels of urbanization or ruralization. Several national peer-reviewed studies have investigated how urbanization relates to both suicide6,40,42,43 and homicide,43–45 but these studies have not explicitly tested how different mechanisms of suicide and homicide, such as firearms, relate to urbanization. Only 2 national peer-reviewed studies have identified basic urbanization differentials in firearm deaths. Both of these studies, however, were limited to very specific subgroups; namely, homicides among teenagers and young adults.11,12 Although these 2 studies offer a significant contribution, they only investigate 1 subset of the relationship between urbanization and firearm death.
We know of no peer-reviewed study that has analyzed urban–rural shifts in firearm suicide. Although 1 recent study hypothesized that urban–rural gradients in suicide were related to firearms, this hypothesis was never statistically explored.6 More important, we know of no peer-reviewed study that has compared urban–rural shifts in firearm suicide to those in firearm homicide. Our study accomplishes this comparison by analyzing US homicides and suicides of all mechanisms, including firearms, with a more detailed categorization scheme of county urbanization and by accounting for other, independent factors that may have influenced the occurrence of intentional firearm deaths over time.
Study Limitations
Although our findings significantly build on previous work, 2 important limitations deserve discussion. The first limitation is that we drew conclusions using only deaths as our outcome of interest. Had all assaults and self-inflicted injuries been analyzed, regardless of survival or death, it is possible that our results might have been different. Then again, no matter how 1-dimensional they are, mortality data continue to be readily available on a national level, and policymakers continue to think of death as an endpoint worthy of prevention. The second important limitation is that we drew conclusions using individual-level data that were aggregated into counties. Conclusions drawn about the county-level risk of firearm death may fail to reflect circumstances at the individual level (an ecological bias) and are best interpreted with caution.46 We have endeavored to limit such conclusions. In addition, our analyses of death rates at the county level probably suffer from fewer ecological biases than if we had proceeded at the state or regional levels.
Recent trends in migration, educational standards, communications advances, and new transportation systems are making urban and rural populations less and less distinguishable.40,41 Despite these trends, the US gun debate continues to be argued between 2 identifiable groups: urban “cosmopolitans” and rural “traditionalists.”5 This social division has left the debate at an impasse; largely symbolic and unapproachable in any meaningful sense by poli-cymakers.5 Even with its limitations, our study takes a significant step forward in demonstrating to both sides of this debate that firearm death is a serious public health problem affecting both urban and rural America.
Implications for the Future
By 2010, the Department of Health and Human Services proposes to reduce firearm-related deaths to 4.1 per 100000 persons,47 about one-third of the rate we report here. This is a daunting task, requiring firearm injury prevention programs that are globally effective but, at the same time, tailored to the needs of specific rural and urban communities.48,49 In all types of counties over our study period, but especially the most urban, firearm homicide rates saw far greater reductions than firearm suicide rates. This trend corresponded with the introduction of numerous congressional bills over the same period, 5 to 6 times as many of which dealt in some way with firearm homicide as opposed to firearm suicide.50 This legislative imbalance between firearm homicide and firearm suicide may indicate a much larger, institutionalized indifference to addressing the leading means of suicide: firearms.
Although the stark reduction in firearm homicide rates (particularly in the largest US cities) over the past decade is a laudable accomplishment,4,51 greater investment should be devoted to the prevention of firearm suicide (especially in remote rural communities) to bring about reductions in firearm death rates in general. Such investment might include strategies such as improved prevention and detection of mental health problems; enhanced access to everyday activities, goods, and services that are often not available in isolated areas; and reduced access to the means of suicide, especially firearms, among high-risk populations.52–54
If a two-thirds reduction in firearm-related deaths is to be accomplished by the close of the decade,47 public health officials should attend to the problem of firearm death as it affects entire states, and not simply urban centers. Moreover, regardless of how insulated they may consider themselves, county health departments should become more aware of the general risks of firearm death as well as the specific types of intentional firearm death, including firearm suicide, that may be prevalent in their communities. Finally, the public’s awareness should be appropriately broadened10 to think about firearm death as a problem that can affect all types of communities in the United States.
Acknowledgments
This research was supported in part through grants from the Joyce Foundation and the National Institutes of Health, National Institute on Aging.
Contributors C.C. Branas originated the study, completed the analyses, led the writing of the article, and supervised all aspects of study implementation. M.L. Nance helped originate the study, conceptualized ideas, interpreted findings, and reviewed drafts. M.R. Elliott completed the analyses, conceptualized ideas, interpreted findings, and reviewed drafts. T. S. Richmond conceptualized ideas, interpreted findings, and reviewed drafts. C.W. Schwab conceptualized ideas, interpreted findings, and reviewed drafts.
Human Participant Protection This study was approved by the University of Pennsylvania institutional review board.
Peer Reviewed
References
- 1.Ikeda RM, Gorwitz R, James SP, Powell KE, Mercy JA. Fatal Firearm Injuries in the United States, 1962–1994. Violence Surveillance Summary Series, No. 3. Atlanta, Ga: Centers for Disease Control and Prevention, National Center for Injury Prevention and Control; 1997.
- 2.Nonfatal and fatal firearm-related injuries—United States, 1993–1997. Morb Mortal Wkly Rep. 1999;48:1029–1034. [PubMed] [Google Scholar]
- 3.Web-Based Injury Statistics Query and Reporting System. Atlanta, Ga: Centers for Disease Control and Prevention, Office of Statistics and Programming, National Center for Injury Prevention and Control; 2002. Also available at: http://www.cdc.gov/ncipc/wisqars. Accessed September 2, 2004.
- 4.Blumstein A, Rivara FP, Rosenfeld R. The rise and decline of homicide—and why. Ann Rev Public Health. 2000;21:505–541. [DOI] [PubMed] [Google Scholar]
- 5.Vizzard WJ. Shots in the Dark. The Policy, Politics, and Symbolism of Gun Control. New York: Rowman and Little-field; 2000.
- 6.Singh GK, Siahpush M. Increasing rural-urban gradients in US suicide mortality, 1970–1997. Am J Public Health. 2002;92:1161–1167. [DOI] [PMC free article] [PubMed] [Google Scholar]
- 7.Ricketts TC. Rural health research and rural health in the 21st century: the future of rural health and the future of rural health services research. J Rural Health. 2002; 18(S):140–146. [DOI] [PubMed] [Google Scholar]
- 8.Humphry D. Beware of the law. In: Final Exit. The Practicalities of Self-Deliverance and Assisted Suicide for the Dying. Secaucus, NJ: Carol Publishing; 1991:29–33.
- 9.LaFave WR. Crimes against the person. In: Criminal Law. 3rd ed. St. Paul, Minn: West Group Press; 2000:699–700.
- 10.The Surgeon General’s Call to Action to Prevent Suicide. Washington, DC: Public Health Service; 1999.
- 11.Fingerhut LA, Ingram DD, Feldman JJ. Firearm and nonfirearm homicide among persons 15 through 19 years of age. Differences by level of urbanization, United States, 1979 through 1989. JAMA. 1992;267:3048–3053. [PubMed] [Google Scholar]
- 12.Fingerhut LA, Ingram DD, Feldman JJ. Homicide rates among US teenagers and young adults: differences by mechanism, level of urbanization, race, and sex, 1987 through 1995. JAMA. 1998;280(5):423–427. [DOI] [PubMed] [Google Scholar]
- 13.Geographic Areas Reference Manual. Washington (DC): Census Bureau (US); 2001. Available at: http://www.census.gov/geo/www/garm.html. Accessed September 2, 2004.
- 14.Butler MA, Beale CL. Rural-urban continuum codes for metro and nonmetro counties, 1993. AGES 9425. Washington, DC: Department of Agriculture, Economic Research Service; 1994.
- 15.Current population survey – Definitions and explanations. Washington, DC: Census Bureau; 2001. Available at: http://www.census.gov/population/www/cps/cpsdef.html. Accessed September 2, 2004.
- 16.Sing RF, Branas CC, MacKenzie EJ, Schwab CW. Geographic variation in serious nonfatal firearm injuries in Pennsylvania. J Trauma. 1997;43:825–830. [DOI] [PubMed] [Google Scholar]
- 17.Nance ML, Denysenko L, Durbin DR, Branas CC, Stafford PW, Schwab CW. The rural-urban continuum: variability in statewide serious pediatric and adolescent firearm injuries. Arch Pediat Adolesc Med. 2002;156:781–785. [DOI] [PubMed] [Google Scholar]
- 18.Area Resource File. Rockville, MD: Health Resources and Services Administration, National Center for Health Workforce Information and Analysis; 2001. Available at: http://www.arfsys.com. Accessed September 2, 2004.
- 19.Uniform crime reporting program data [United States]: county level arrest and offenses data. Washington, DC: Department of Justice, Federal Bureau of Investigation; 2000. Available at: http://www.icpsr.umich.edu. Accessed September 2, 2004.
- 20.Cameron AC, Trivedi PK. Regression analysis of count data. Econometric Society Monographs, No. 30. New York: Cambridge University Press, 1998.
- 21.Gujarati DN. Multicollinearity. Chapter 10. In: Gujarati DN, editor. Basic Econometrics, 2nd ed. New York: McGraw-Hill; 1988:283–315.
- 22.White H. A heteroscedasticity-consistent covariance matrix estimator and a direct test for heteroscedasticity. Econometrica 1980;48:817–830. [Google Scholar]
- 23.Getis A. Spatial statistics. In: Longley PA, Goodchild MF, Maguire DJ, Rhind DW, editors. Geographical Information Systems, 2nd ed., Vol. 1. New York: Wiley; 2000:239–251.
- 24.Baller RD, Messner SF, Anselin L, Deane G. The interchangeability of homicide data sources. A spatial analytical perspective. Homicide Studies. 2002;6(3):211–227. [Google Scholar]
- 25.Doyle R. Measuring bad behavior. FBI crime statistics: use with caution. Sci Am. 2001;9:28. [Google Scholar]
- 26.Wiersema B, Loftin C, McDowall D. A comparison of supplementary homicide reports and national vital statistics system homicide estimates for U.S. counties. Homicide Studies. 2000;4(4):317–340. [Google Scholar]
- 27.Maltz MD, Targonski J. A note on the use of county-level UCR data. J Quant Criminol. 2002;18(3):297–318. [Google Scholar]
- 28.Stata Reference Manual, Vol. 2. College Station, TX: Stata Corporation Press; 2003.
- 29.Beaman V, Annest JL, Mercy JA, Kresnow M, Pollock DA. Lethality of firearm-related injuries in the United States population. Ann Emerg Med. 2000; 35(3):258–266. [DOI] [PubMed] [Google Scholar]
- 30.Murphy GE. Why women are less likely than men to commit suicide. Compr Psychiatry. 1998; 39(4):165–175. [DOI] [PubMed] [Google Scholar]
- 31.Gessert CE. Rurality and suicide. Am J Public Health. 2003;93(5):698. [DOI] [PMC free article] [PubMed] [Google Scholar]
- 32.Rushforth NB, Ford AB, Hirsch CS, Rushforth NM, Adelson L. Violent death in a metropolitan county. Changing patterns in homicide (1958–74). New Engl J Med. 1977;297(10):531–538. [DOI] [PubMed] [Google Scholar]
- 33.Ford AB, Rushforth NB, Rushforth N, Hirsch CS, Adelson L. Violent death in a metropolitan county: II. Changing patterns in suicides (1959–1974). Am J Public Health. 1979;69(5):459–464. [DOI] [PMC free article] [PubMed] [Google Scholar]
- 34.Sloan JH, Kellermann AL, Reay DT, et al. Handgun regulations, crime, assaults, and homicide. A tale of two cities. New Engl J Med. 1988;319:1256–1262. [DOI] [PubMed] [Google Scholar]
- 35.Sloan JH, Rivara FP, Reay DT, Ferris JA, Kellermann AL. Firearm regulations and rates of suicide. A comparison of two metropolitan areas. New Engl J Med. 1990; 322(6):369–373. [DOI] [PubMed] [Google Scholar]
- 36.McGonigal MD, Cole J, Schwab CW, Kauder DR, Rotondo MF, Angood PB. Urban firearm deaths: a five-year perspective. J Trauma. 1993;35(4):532–537. [PubMed] [Google Scholar]
- 37.Kellermann AL, Rivara FP, Lee RK, et al. Injuries due to firearms in three cities. New Engl J Med. 1996; 335(19):1438–1444. [DOI] [PubMed] [Google Scholar]
- 38.Cheng TL, Wright JL, Fields CB, et al. Violent injuries among adolescents: declining morbidity and mortality in an urban population. Ann Emerg Med. 2001;37(3): 292–300. [DOI] [PubMed] [Google Scholar]
- 39.Sadowski LS, Munoz SR. Nonfatal and fatal firearm injuries in a rural county. JAMA. 1996;275:1762–1764. [DOI] [PubMed] [Google Scholar]
- 40.Kowalski GS, Faupel CE, Starr PD. Urbanism and suicide: a study of American counties. Social Forces. 1987; 66(1):85–101. [Google Scholar]
- 41.Ellin N. Thresholds of fear: embracing the urban shadow. Urban Studies. 2001;38(5–6):869–883. [DOI] [PubMed] [Google Scholar]
- 42.Lester D. The monthly distribution of suicides and urbanization. Perceptual Motor Skills. 1998;86:1458. [DOI] [PubMed] [Google Scholar]
- 43.Cubbin C, LeClere FB, Smith GS. Socioeconomic status and injury mortality: individual and neighbourhood determinants. J Epidemiol Community Health. 2000;54(7): 517–524. [DOI] [PMC free article] [PubMed] [Google Scholar]
- 44.Cubbin C, Pickle LW, Fingerhut L. Social context and geographic patterns of homicide among US black and white males. Am J Public Health. 2000;90(4):579–587. [DOI] [PMC free article] [PubMed] [Google Scholar]
- 45.Glaeser EL, Sacerdote B. Why is there more crime in cities? J Polit Econ. 1999;107(6):225–258. [Google Scholar]
- 46.Kirby RS. Toward congruence between theory and practice in small area analysis and local public health data. Stat Med. 1996;15:1859–1866. [DOI] [PubMed] [Google Scholar]
- 47.Injury and violence prevention. Chapter 15. In: Healthy People 2010: Understanding and Improving Health, Vol. II, 2nd ed. Washington, DC: Department of Health and Human Services, Government Printing Office; 2000.
- 48.Teret SP, DeFrancesco S, Bailey LA. Gun deaths and home rule: a case for local regulation of a local public health problem. Am J Prevent Med. 1993;9:44–46. [Google Scholar]
- 49.Kopcsik JM. Home rule and firearms regulation: Philadelphia’s failed assault weapons ban—Ortiz v. Commonwealth, 681 A.2d 152 (pa. 1996). Temple Law Rev. 1997; 70(3):1055–1080. [Google Scholar]
- 50.Thomas legislative information on the internet. Washington, DC: Library of Congress; 2003. Available at: http://thomas.loc.gov. Accessed September 2, 2004.
- 51.Harris AR, Thomas SH, Fisher GA, Hirsch DJ. Murder and medicine: the lethality of criminal assault 1960–1999. Homicide Stud. 2002;6(2):128–166. [Google Scholar]
- 52.Jenkins R. Addressing suicide as a public-health problem. Lancet. 2002;359:813–814. [DOI] [PubMed] [Google Scholar]
- 53.National strategy for suicide prevention: goals and objectives for action. Rockville, Md: Public Health Service; 2001. [PubMed]
- 54.Branas CC, Richmond TS, Schwab CW. Firearm homicide and firearm suicide: opposite but equal. Public Health Reports 2004;119(2):114–124. [DOI] [PMC free article] [PubMed] [Google Scholar]


