

Abstract
Genetic architecture of flowering time in maize was addressed by synthesizing a total of 313 quantitative trait loci (QTL) available for this trait. These were analyzed first with an overview statistic that highlighted regions of key importance and then with a meta-analysis method that yielded a synthetic genetic model with 62 consensus QTL. Six of these displayed a major effect. Meta-analysis led in this case to a twofold increase in the precision in QTL position estimation, when compared to the most precise initial QTL position within the corresponding region. The 62 consensus QTL were compared first to the positions of the few flowering-time candidate genes that have been mapped in maize. We then projected rice candidate genes onto the maize genome using a synteny conservation approach based on comparative mapping between the maize genetic map and japonica rice physical map. This yielded 19 associations between maize QTL and genes involved in flowering time in rice and in Arabidopsis. Results suggest that the combination of meta-analysis within a species of interest and synteny-based projections from a related model plant can be an efficient strategy for identifying new candidate genes for trait variation.
MAIZE (Zea mays L.) was domesticated from the Central America native Teosinte. It was then gradually adapted to temperate climates, up to the cool regions of America and then northern Europe. This acclimatization was made possible mainly by an adaptation of maize flowering time to the local climatic features. Flowering time and related traits such as plant height and total leaf number are determined mainly by the timing of the transition from vegetative to reproductive development made by the shoot apical meristem of maize (Irish and Nelson 1991). Use of molecular markers allowed the detection, since the late 1980s, of an increasing number of quantitative trait loci (QTL) controlling these traits. Besides studies addressing flowering time for its direct interest for maize adaptation to temperate climates (Ragot et al. 1995), this trait is also frequently scored as a component of yield (Mechin et al. 2001), drought stress (Veldboom and Lee 1996), or pest resistance (Bohn et al. 2000). A large body of QTL information is therefore presently available for flowering time in maize.
As opposed to other traits such as kernel characteristics, only few mutations affecting flowering time have been identified in maize, so that knowledge of the genetic control of this trait in maize remains relatively poor. The best known gene, INDETERMINATE1 (ID1), was cloned from a mutation where the apical vegetative meristem failed to be converted into a reproductive meristem (Colasanti et al. 1998). The ID1 gene encodes a zinc finger transcription factor. The locus id1 was mapped to chromosome 1L. Two other mutants, delayed flowering1 (dlf1) and leafy1 (lfy1), have shown specific albeit weak effect on the floral transition. Last, a recessive mutation of the EARLY PHASE CHANGE (EPC) gene reduced the duration of the juvenile vegetative phase, thus causing an early flowering (Vega et al. 2002). Still, no dramatic effect on the number of leaves was observed. The epc mutation was mapped on chromosome 8.
On the other hand, the genetics and molecular biology of the floral transition have been most extensively studied in Arabidopsis thaliana. Almost 80 genes involved in the timing of flowering are cloned and described for this species. Genetic, molecular, and physiological analyses led to the elaboration of a model of the genetic interactions between these genes (Koornneef et al. 1998; Blazquez 2000). Four genetic signaling pathways that promote flowering have been identified: the photoperiodic, autonomous, vernalization (transient exposure to low temperatures soon after germination), and gibberellins (GA) pathways. Briefly, photoreceptors, such as phytochromes (PHYA–E) and cryptochromes (CRY1–2), are involved in the perception of day length and interact with an endogenous circadian clock to initiate flowering signals under long days (Millar 2004). Then these signals are transducted and integrated by the CONSTANS (CO) gene (Suarez-Lopez et al. 2001). The autonomous and vernalization pathways accelerate flowering due to the reduction of the expression of FLOWERING LOCUS C (FLC), which encodes a floral repressor (Michaels and Amasino 2001). Mutations affecting GA synthesis delay flowering under both long and short days, but they have their strongest effect under short days (Ogas 1998). Signaling pathways are integrated by meristem identity genes, such as LEAFY (LFY; Simon et al. 1996).
Rapid progress in the knowledge of the signaling pathways in Arabidopsis has provided relevant insights into the genetic control of maize flowering time with reverse genetic approaches. Different phytochromes (PHYA, PHYB, and PHYC), the light receptors of the photoperiod pathway in Arabidopsis, have been isolated in maize (Christensen and Quail 1989; Dehesh et al. 1991; Basu et al. 2000). The maize gene orthologous to the Arabidopsis LUMINIDEPENDENS gene from the autonomous pathway (ZmLD) was also isolated (Nocker et al. 2000). The ZmLD locus was mapped on maize chromosome 3 but no information on its function is available to our knowledge, from either mutation or transgene experiments in maize. It can be noted that the ID1 gene has been assigned to this autonomous pathway by analogy to the Arabidopsis model (McSteen et al. 2000). Two maize genes involved in the gibberellin pathway have been cloned in maize. The ANTHER EARS1 (AN1) gene is involved in the synthesis of ent-kaurene (Bensen et al. 1995), the first tetracyclic intermediate in the gibberellin biosynthetic pathway. The dwarf8 mutation is an ortholog of the wheat Reduced height mutations (Rht-B1 and Rht-D1), which were used to develop the new semidwarf varieties of the “green revolution” (Peng et al. 1999). The AN1 and DWARF8 genes are orthologous to the Arabidopsis GIBBERELLIN REQUIRING1 (GA1) gene and Arabidopsis GIBBERELLIN INSENSITIVE (GAI) gene, respectively. Both have been mapped on maize chromosome 1L. The mutations causing the loss of AN1 or DWARF8 function lead to a reduction of the plant height and delay flowering. Finally, using reverse genetics, Bomblies et al. (2003) showed that two duplicate LFY homologs in maize, ZFL1 and ZFL2, play roles in floral organ identity, floral transition, and inflorescence phyllotaxy. These genes have been mapped, respectively, on chromosomes 2 and 10.
The presence of several maize genes orthologous of Arabidopsis flowering-time genes suggested that pathways promoting flowering time in Arabidopsis are conserved in maize. However, Arabidopsis and maize do not have the same floral biology. Arabidopsis is classified as a facultative long-day plant, whereas maize is originally a short-day one. Arabidopsis shows a vernalization response whereas low temperatures block the development of maize and can have deleterious effects. Better-preserved flowering time mechanisms are therefore expected with species closer than Arabidopsis. Comparative genetics suggested that the regulation of flowering should be conserved in the grass family Poaceae (Lin et al. 1995; Laurie 1997). Moreover, comparative mapping of cereals using restriction fragment length polymorphism (RFLP) has shown considerable marker-order conservation. Chromosomes of barley, wheat, and maize can be described in terms of rice “linkage segments” (Bennetzen and Laurie 1993; Devos and Gale 1997; Wilson et al. 1999). As a model for other grasses, rice (Oryza sativa L.) has the advantage of having a well-documented flowering process. First, ∼50 orthologous sequences of Arabidopsis flowering-time genes into the rice genome were identified by comparison of complete genome sequences between rice and Arabidopsis (Izawa et al. 2003). Second, since 1991, four major QTL or mutations involved in the photoperiod response have been cloned in rice: Heading date1 (Hd1), Hd3a, Hd6, and se5. Two major cloned QTL, Hd1 and Hd3a, are orthologous, respectively, with CO and FT, both involved in the photoperiod response in Arabidopsis (Yano et al. 2000; Kojima et al. 2002). Hd6 encodes the α-subunit of protein kinase CK2 (CK2α; Takahashi et al. 2001). In Arabidopsis, CK2α seems to interact with proteins involved in the circadian clock. Se5 encodes a putative heme oxygenase that is involved in phytochrome chromophore biosynthesis, suggesting that phytochromes are also involved in the flowering control as in Arabidopsis (Izawa et al. 2000). The floral functions of these last two genes were initially unknown in Arabidopsis and were discovered with fine-mapping QTL studies in rice. Despite a large interest in these rice genes, no published study has yet been performed to our knowledge to take advantage of them to find new candidate genes for QTL in maize.
For this study, we collected numerous QTL results in maize, from publications mentioned above and internal programs, and projected these on the same reference map. A new “overview” statistic has been developed to highlight “hot spots” of flowering-time QTL. We then used the meta-analysis approach of Goffinet and Gerber (2000) to estimate, for each linkage group, the number of QTL underlying the results that we synthesized and estimate their consensus positions. These were compared to the few positions of candidate genes for flowering time presently available in maize. Finally, we analyzed the conservation of synteny between rice and maize to predict the position of additional candidate genes in maize.
MATERIALS AND METHODS
Bibliographic synthesis of QTL results:
By making a bibliographical review and using internal results, we collected data from 22 QTL studies relative to flowering-time traits: days to pollen shed (DPS), silking date (SD), and related traits: plant height (HT) and leaf number (LN). For each QTL study, we reported in Table 1 the names of the parental lines used and the size and type of plant populations (F2, backcross, or near-isogenic lines populations …). We define here as an “experiment” the QTL analysis of one population evaluated for a given trait in a given environment (a single location or the mean of several locations, depending on information available in the publications). Each QTL is characterized by its map position [most likely position and confidence interval (C.I.) around this position] and the proportion of phenotypic variance explained, R2. QTL allelic effects were not used for this analysis. When the confidence interval for QTL position was not available in the publication, a 5% confidence interval was estimated with the approach proposed by Darvasi and Soller (1997) as
 |
1 |
where R2 is the proportion of variance explained and N is the size of the population. According to the authors, expression (1) is appropriate for both backcross and F2 populations.
TABLE 1.
QTL studies considered
| QTL studies | Parents | No. of population |
No. of environments |
Type of population(s) |
Population size |
Traits | Methods used | Reference |
|---|---|---|---|---|---|---|---|---|
| Abler | B73, Mo17, Oh43, Tx303 and T232 |
6 | 1 | F2 | 504 (per population) |
SD | ANOVA | Abler et al. (1991) |
| Austin | Mo17 × H99 | 1 | 1 | F6:7 | 147 | SD, DPS, and HT |
ANOVA | Austin and Lee (1996) |
| Beavis | B73 × Mo17 | 1 | 1 | F2:3 | 112 | SD | unknown | Beavis et al. (1994) |
| Blanc | DE, F283, F810, F9005 |
6 | 1 | F2 | 150 (per population) |
SD and DPS | Interval mapping | Blanc et al. (2003) |
| Bohn1 | D06 × D408 | 1 | 1 | F2 | 226 | DPS | Interval mapping | Bohn et al. (2000) |
| Bohn2 | CML131 × CML67 | 1 | 1 | F2 | 215 | HT | Interval mapping | Bohn et al. (1996) |
| Bouchez | F2 × MBS847 | 1 | 1 | BC3S1 | 217 | SD | Interval mapping | Bouchez et al. (2002) |
| Cardinal | B73 × B52 | 1 | 2 | RIL | 200 | DPS, HT | Interval mapping | Cardinal et al. (2001) |
| Charcosset | F2 × F252 | 1 | 1 | F5 | 129 | SD | ANOVA | L. Moreau and A. Charcosset (unpublished data) |
| Groh | CML131 × CML67 | 1 | 1 | RIL | 166 | HT | Interval mapping | Groh et al. (1998) |
| Koester | NC264 × SC76 | 2 | 1 | F2 | 350 | DPS, HT, and NF |
ANOVA | Koester et al. (1993) |
| B73G × B73 | 260 | |||||||
| Lubberstedt | KW1265 × D146 | 1 | 2 | F2:3 | 380 | HT | Interval mapping | Lübberstedt et al. (1997) |
| Mechin | F2 × MBS847 | 1 | 1 | F5 | 100 | SD and HT | Interval mapping | Mechin et al. (2001) |
| Moreau | F2 × F252 | 1 | 1 | F3 | 300 | SD | Interval mapping | Moreau (1998) |
| Pioneer | Unknown | 1 | 1 | F4:5 | 976 | HT | Interval mapping | (http://www.maizegbd.org) |
| Poupard | F2 × MBS847 | 1 | 1 | F6 | 86 | SD | Interval mapping | B. Poupard, L. Moreau and A. Charcosset (unpublished data) |
| Ragot | Mo17 × tropical | 1 | 1 | F2 | 387 | DPS, HT, and NF |
ANOVA | Ragot et al. (1995) |
| Rebaï | 2 European Flints, 2 American (Unknown) |
1a | 4 + mean | F2:3 | 1200 | SD | Interval mapping | Rebaï et al. (1997) |
| Ribaut | Tropical maize | 1 | 3 | F2 | 272 | SD and DPS | ANOVA | Ribaut et al. (1996) |
| Stuber | Mo17 × B73 | 2 | 1 | BC | 264 | DPS and HT | Interval mapping | Stuber et al. (1992) |
| Veldboom | Mo17 × H99 | 1 | 1 | F2 | 150 | DPS and HT | ANOVA | Veldboom and Lee (1996) |
| Vladutu | E20 × N28 | 1 | 1 | F2 | 88 | DPS, HT, and NF |
Interval mapping | Vladutu et al. (1999) |
RIL, recombinant inbred line.
Global analysis of a multiparental design.
QTL projections:
Results collected from QTL mapping experiments involve different genetic maps that share only a few common markers. QTL were projected on a reference map, using markers shared by QTL maps and this reference map, by means of a homothetic function. We used as a reference map the Génoplante intermated B73 × Mo17 (IBM) population map (Lee et al. 2002), developed by Falque et al. (2003). In brief, this reference map first involves a framework map of 237 RFLP and SSR markers chosen for unambiguous locus order. Most markers used for the QTL studies were genotyped on this population and mapped individually along with framework markers. All these markers were then located on the reference map on the basis of their relative distance to flanking framework markers, keeping distances between framework markers stable. We finally projected the most likely position of each QTL and left and right flanking ends of the confidence interval, with a homothetic function using common markers between the reference map and QTL maps (see Figure 1). In a few cases, these common markers displayed a discrepancy in order between the initial QTL map and the reference map. When possible, we discarded inverted markers from the projection process and used the next flanking markers. Otherwise, the QTL was not projected.
Figure 1.—

Principle of QTL projection on the reference map. A QTL observed in an initial experiment is represented by its most likely position and the limits of its 5% confidence interval (QTL map, left). Corresponding positions are projected onto the reference map by homothetic function, using Marker1, Marker2, and Marker3 as commons markers.
QTL overview:
To quantify the contribution of a given region to trait variation, we calculated a statistic, called overview farther on, which estimates the probability that a given genome segment comprises a QTL in one of the considered experiments. Once the estimated position of QTLi was projected on the reference map, we considered that the true position of QTLi was normally distributed around the most likely location pi of the QTL, with a variance S2i: Npi, S2i (Visscher et al. 1996). In most of the experiments that we considered, the limits of the confidence interval (C.I.i) of QTL position were estimated as the positions where the LOD value decreased by 1 unit relative to that of the most likely position. This interval corresponds roughly to a 5% confidence interval (Lynch and Walsh 1998), so that S2i was estimated as
 |
For each QTL of a given linkage group, we then calculated step by step (every 0.5 cM) the probability that the true position lies between positions x and x + 0.5. We then estimated the average probability that segment x, x + 0.5 comprises a QTL in an experiment as
 |
where nbqtl is the number of QTL and nbE is the total number of experiments. This parameter was plotted along the reference map. To highlight regions where the density shows a notable peak, we plotted on the same graphs the average value of the parameter. This average value is equivalent to the uniform probability that segment x, x + 0.5 comprises a QTL in an experiment, knowing the average number of QTL per experiment (nbQTL/nbE), without information on QTL positions,
 |
Meta-analysis:
We then used the meta-analysis approach of Goffinet and Gerber (2000) to estimate, for each linkage group, the number of QTL underlying the results that we synthesized. This approach provides decision rules based on a modified Akaike criterion to determine the number of “real” QTL that best fits the results on a given linkage group. It also groups the QTL detected in independent experiments in classes that correspond to the same QTL and finally provides a consensus estimation of QTL positions. Computations were performed using the BioMercator software (Arcade et al. 2004). For the moment, the method used in the software does not allow us to distinguish between models with more than four real QTL on the same linkage group. If the estimated number of real QTL is more than four, BioMercator declares that the most probable model is one with a number of real QTL equal to the number of analyzed QTL. We therefore used the Delete function of the software to select segments of a linkage group separated by regions with no QTL and applied the meta-analysis to these segments. Compared to the method initially proposed by Goffinet and Gerber (2000), the software includes an additional method to estimate the confidence interval of consensus QTL positions,
 |
where S2i is the variance of the most likely location of QTLi and K is the total number of QTL attributed to the consensus QTL.
Synteny conservation-based approach:
Genetic mapping and sequence data were obtained from TIGR (http://www.tigr.org/tdb/tgi/plant.shtml), MaizeGDB (http://www.maizegdb.org/), RiceGD (http://btn.genomics.org.cn:8080/rice/), and RGP (http://rgp.dna.affrc.go.jp/index.html) databases. Rice sequences likely corresponding to genes involved in flowering time were identified with the comparison of flowering pathways in rice and Arabidopsis, as done by Izawa et al. (2003). This study was made with the indica rice genome draft released by the Beijing Genomics Institute (Yu et al. 2002) whereas most of the genetic data were available only for the japonica rice genome draft released by the Rice Genome Project (Goff et al. 2002). We therefore subjected each selected indica rice sequence to a BLASTN (Altschul et al. 1997) analysis with the japonica rice BACs, to find putative orthologous sequences. Genetic localization of these sequences on the high-density rice genetic map constructed in the Rice Genome Project was obtained from http://rgp.dna.affrc.go.jp/publicdata/geneticmap2000/index.html.
To construct a comparative map between the maize and rice genomes, we compared maize and rice tentative consensus [TC; created by assembling expressed sequence tags (ESTs) into virtual transcripts] sequences from the TIGR database available in January 2003 (release 11.0). Multiple sequence comparisons of maize against rice and rice against maize were carried out using TBLASTX and sequences were considered as homologous if the E-value was <1e-20 and the sequence identity was >75% over a 150-bp minimum-length high-scoring segment pair (hsp). To avoid spurious associations between sequences that are identical only on a small common domain, a significant overlap between two sequences is defined by an overlap of at least 60% of their length. It can be noted that, in some cases, a sequence of a given species presented a high identity with two or more sequences of the other species. The maize TC sequences were then subjected to BLASTN analysis with mapped maize sequences whereas the rice TC sequences were subjected to TBLASTX analysis with the japonica rice BACs. Homologous TC sequences that fulfilled these two criteria were used as anchor points to connect the maize map and rice genome. The maize reference map used for this approach was initially the IBM2 neighbors (IBM2n) map (http://www.maizegdb.org), where several new marker locations were projected from other maps using a homothetic function. Relationships between maize and rice genomes were first investigated using a graphical representation of anchor points and corresponding links, which underlined blocks with conserved synteny (several links and conserved anchor marker order). We then quantified the magnitude of the conservation between the two genomes using the synteny probability statistic developed by Gaut (2002). In this approach, each anchor point marker in maize receives a score of 1, 1/2, or 0, depending on whether two, one, or zero among its two flanking anchor points are associated to the same chromosome in rice. The synteny probability was initially defined as the average of the marker scores over an entire maize chromosome. On the basis of the same idea, we calculated the local synteny probability of one maize chromosomal segment by computing the average score of the two anchor points that delimit the segment.
In cases where a strong synteny is observed, a maize segment likely contains homologs for most of the genes encompassed in the corresponding rice segment. We therefore predicted maize regions that likely contain the homologs of a given rice flowering-time gene as the interval between the two maize anchor points linked to those that flank this gene in rice. The synteny probability was estimated for all these segments to quantify the quality of the projection and only values ≥25% were considered. Finally, we projected rice flowering-time loci from the IBM2n map to the reference map used in the meta-analysis to search for associations between QTL and these new candidate genes. In this article, loci detected in maize by the synteny approach are referred as “os” with the gene name, whereas loci directly mapped in the maize population are referred as “zm” with the gene name. When possible, these synteny-based projections were compared with the positions of orthologous genes mapped by RFLP in maize.
Simulations were performed to check that the congruency between QTL and projected regions was higher than expected by chance (global null hypothesis that the choice of candidate genes and/or their projection was not relevant). To take into account the fact that several loci were projected, we computed the average of the overview statistic over the projected segments and compared it to its corresponding distribution obtained over 10,000 random assignments of segment positions over the maize genome. This distribution was used to estimate the probability that an average overview equal or superior to that observed could have been obtained by chance. We also investigated the possibility of evaluating the proportion of associations between projected segments and QTL that could be due to chance only. To do so, we applied to our data recent approaches devoted to the analysis of the statistical significance of genome-wide studies (Delvin et al. 2003; Storey and Tibshirani 2003). Briefly summarized, these articles consider that, rather than individual P-values of a series of tests, the matter of concern is the proportion of tests considered as significant that are expected to be “false positives” (i.e., truly corresponding to the null hypothesis). This was addressed originally by taking into account the number of tests that are expected to reach a given P-value by chance if all tests performed correspond to the null hypothesis [false discovery rate (FDR) approach proposed by Benjamini and Hochberg 1995; described in Delvin et al. 2003]. It was shown later that this provides an overestimation of the proportion of false positives and that a more appropriate estimation should take into account the fact that only part of the tests that are performed correspond to the null hypothesis (Storey and Tibshirani 2003). To apply these approaches, we computed for each of the 30 projected segments (i) the average of the overview statistic along the segment and (ii) the same value for 10,000 random assignments of a segment with the same size over the maize genome. We used this distribution to estimate the proportion (P) of random segments of a given size that have an average overview statistic equal to or higher than that observed for the segment of interest. P-values of the projected segments were used to estimate the corresponding FDR and the Q-values as proposed by Storey and Tibshirani (2003). Q-values were computed using the QVALUE software (Dabney and Storey 2003). One important aspect of the use of this program is to evaluate the global proportion of the total tests that are conducted that correspond to the true null hypothesis (π0). This parameter is related to a tuning parameter (λ). The default setting of the program adjusts a curve (smoother) to the relationship between π0 and λ, to estimate π0 for λ = 1. As recommended by the authors, we looked at the relationship between π0 and λ to evaluate the stability of the results.
RESULTS
A total of 313 QTL from 22 studies (67 experiments) have been projected onto the reference map (see supplemental data at http://www.genetics.org/supplemental/Supplemental1 and Supplemental2 for reference genetic map and QTL positions). It can be noted that the average number of QTL per experiment (4.6) is close to that of 4 estimated by Kearsey and Farquhar (1998) over a very wide range of plant species and traits. All regions of the map, except 4S and 7S, contain QTL involved in the variation of flowering time, although the distribution of QTL varies considerably among genomic regions. For example, the number of QTL confidence intervals that encompass a given position varies between 0 and 10 on chromosome 1.
Overview of QTL in maize flowering time:
Figure 2 shows the results of the overview statistic of QTL repartition along the maize genome. The density curve exceeds 69 times the average value, suggesting that several tens of regions are involved in the variation of the maize flowering time. It can be noted that the curve shows close peaks on chromosomes 1, 2, 3, and 6. Six regions displayed particularly high values (determined empirically as 5 times the average value of the curve): one for chromosomes 1 and 9 and two for chromosomes 8 and 10. For all these regions, a QTL was detected with a major effect (i.e., high R2 value) in at least one experiment, and several other QTL were detected in other experiments.
Figure 2.—
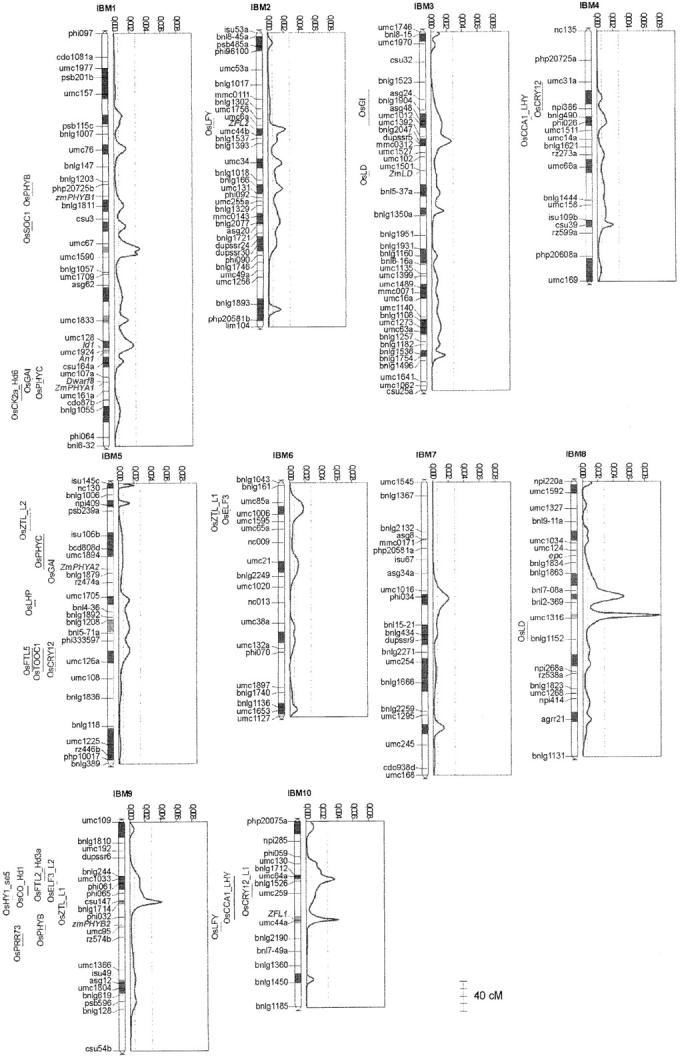
Overview and meta-analysis of QTL affecting flowering time in maize. The overview statistic was calculated every 0.5 cM and plotted along each chromosome. The two vertical dotted lines are the average value of the statistic and the threshold for “high values,” defined empirically as five times the average value. Consensus loci estimated by meta-analysis are drawn on each chromosome as darkly shaded rectangles by default and lightly shaded rectangles if they clustered QTL affecting all traits. Flowering-time genes mapped in maize are represented in italics. Positions of flowering time genes predicted on the basis of local rice-maize synteny conservation have been placed to the left of the map.
Meta-analysis results:
By using meta-analysis, the 313 initially detected QTL were reduced into 62 consensus loci (see shaded rectangles in Figure 2). Consistent with the overview method, these loci appear widely distributed along the maize genome. Meta-analysis is a powerful tool to estimate if one, two, or possibly more real QTL are in regions that displayed complex patterns of the overview curve. For instance, Figure 3A presents a meta-analysis of the hot-spot region on chromosome 1. The overview curve of the region showed three peaks higher than the average value, out of which two were close (∼7 cM) and mostly corresponded to two distinct experiments (Koester et al. 1993; Rebaï et al. 1997). Finally, meta-analysis concluded to a model with two QTL.
Figure 3.—

Illustration of meta-analysis for regions of chromosomes 1 (A) and 7 (B). Initial QTL and their confidence interval are represented along chromosomes as horizontal lines. Vertical rectangles represent confidence intervals of consensus QTL estimated by meta-analysis. On chromosome 1 (A), the overview statistic presented three peaks over the average value, out of which two exceeded the fivefold factor for high values. Meta-analysis of this region defined two consensus QTL, with confidence intervals two times smaller than the smallest corresponding initial confidence interval. On chromosome 7 (B), 10 QTL affected principally plant height. The overview statistic presented one peak over the average value. Meta-analysis of this region defined a single consensus QTL.
As discussed by Goffinet and Gerber (2000), QTL meta-analysis makes it possible to estimate the number of real QTL underlying results obtained in independent experiments and estimate the consensus positions of these QTL. Figure 3, A and B, also shows that the confidence interval for consensus positions is smaller than those of corresponding initial QTL positions. We compared, at each major consensus position, the new confidence interval with that of the initial QTL that was located with the highest precision. We observed a decrease from 13.1 to 7.1 cM on chromosome 1, from 20 to 6.9 cM and from 5 to 3.6 cM on chromosome 8, from 7.6 to 5.8 cM on chromosome 9, and from 11.7 to 5.7 cM and from 15.9 to 9.9 cM on chromosome 10. On average for these loci, use of meta-analysis decreases the size of confidence intervals by a factor of 1.8 and therefore increases the precision of QTL mapping, which facilitates the identification of relevant candidate genes.
Meta-analysis also makes it possible to identify consensus QTL that are associated with the variation of several traits (here silking date, date of pollen shed, leaf number, and plant height). Floral transition affects male and female flowering time, leaf number, and correlatively plant height (Irish and Nelson 1991). QTL affecting the four traits are therefore likely involved in the timing of floral transition. Five such QTL were detected using meta-analysis: on chromosome 1 (loci near umc67 and umc1833), on chromosome 5 (locus near bnl5-71a), on chromosome 8 (vgt1, major QTL near umc1316), and on chromosome 9 (locus near csu147). Loci on chromosomes 1 (umc67), 8 (vgt1), and 9 (csu147) correspond to three of the six hot-spot loci revealed by the overview statistic. Several experiments suggest that the vgt1 QTL of chromosome 8 is involved in floral transition (Vladutu et al. 1999; Salvi et al. 2002). On the other hand, two clusters put together QTL that affect principally vegetative traits (plant height and leaf number; see details in Figure 3B). On chromosome 6, a locus close to bnlg1136 is associated with two QTL for plant height and one QTL for leaf number. On chromosome 7, a locus close to phi034 is mainly associated with plant height (seven QTL for plant height and three QTL for flowering time). These effects suggest the presence of genes involved in the control of vegetative growth, a mechanism independent of the floral transition in maize.
Synteny approach:
From the review of Izawa et al. (2003), we determined 37 indica rice genes involved in flowering time and mapped these sequences in silico on the japonica rice genome (see Figure 4). We added to these positions the locations of the 3 rice TFL1-like genes (RCN1/FRD2, RCN2, and RCN3/FRD1), that of the rice orthologous genes of Arabidopsis GAI and GA1, that of the loci of se5 mutation, and that of the Hd6 major QTL. Only 1 indica rice gene, a FIE-like (RiceDB accession no. contig88495), did not present a high identity with the japonica BAC sequences available in September 2003. This can be explained either by the absence of this gene in the japonica rice subspecies or by a gap in present sequence data. This yielded a total of 44 loci, out of which 3 corresponded to QTL cloned in rice (Yano et al. 2000; Takahashi et al. 2001; Kojima et al. 2002). Map positions for the circadian clock genes (osTOC1, osPRR37, osPRR73, osPRR59, and osPRR95) are consistent with those found by Murakami et al. (2003). Several flowering genes were mapped in duplicated genomic segments: FT-like9 and FT-like10 genes of chromosomes 1 and 5; the FT-like5, FT-like6, CRY12-L1, and CRY12-L2 genes of chromosomes 2 and 4; the ZTL/LHP2-like1 and ZTL/LHP2-like2 genes of chromosomes 2 and 6; and the TFL1-like genes (RCN1 and RCN3) of chromosomes 11 and 12. This is consistent with recent results showing that rice was an ancient aneuploid (Paterson et al. 2003; Vandepoele et al. 2003).
Figure 4.—

Location of candidate genes for flowering time on the Oryza sativa ssp. japonica genome. Shaded bands localize the centromeric region on the 12 chromosomes. Genetic positions are inferred from that of the corresponding BAC clones.
From the 36,022 maize TC sequences and the 51,569 rice TC sequences available, the reciprocal BLAST analysis allowed us to identify associations involving 11,469 maize TC sequences and 15,104 rice TC sequences. Finally, 2232 associations corresponded to genes mapped in both rice and maize. Every locus of one species that was connected to more than two loci in the other species was discarded, to limit the risk of connecting homologous members of complex gene families that do not correspond to strict orthology relationships. Finally, comparative mapping between rice and maize yielded 642 links between the two genomes. An overview of all relationships between the two genomes is accessible through the supplemental data (http://www.genetics.org/supplemental/, Supplemental3). Note that the 558 maize positions correspond to 339 public data for which the corresponding TIGR sequence name is indicated and 219 Genoplante data (<40%) for which the corresponding TIGR sequence name is coded. These last data were not specific to flowering time and are used here to better document genome relationships. A conservation of gene content and gene order between rice and maize chromosomes appears in several regions. For example, Figure 5 shows the relationships that were found between maize chromosome 9 and rice chromosomes 3 and 6. Maize chromosome 9 shares two conserved regions with rice chromosome 6 and one with rice chromosome 3. Such relationships could be found for many other regions, with the exception of a few regions of maize chromosome 2 and rice chromosomes 9, 11, and 12, for which limited sequence information was available. With Gaut's synteny probability (Gaut 2002), we estimated that 45.8% of the maize genome is related to at least one rice segment. For these regions, the conservation of the synteny makes it possible to predict the position of genes yet unknown in maize from the position of homologous genes in rice.
Figure 5.—
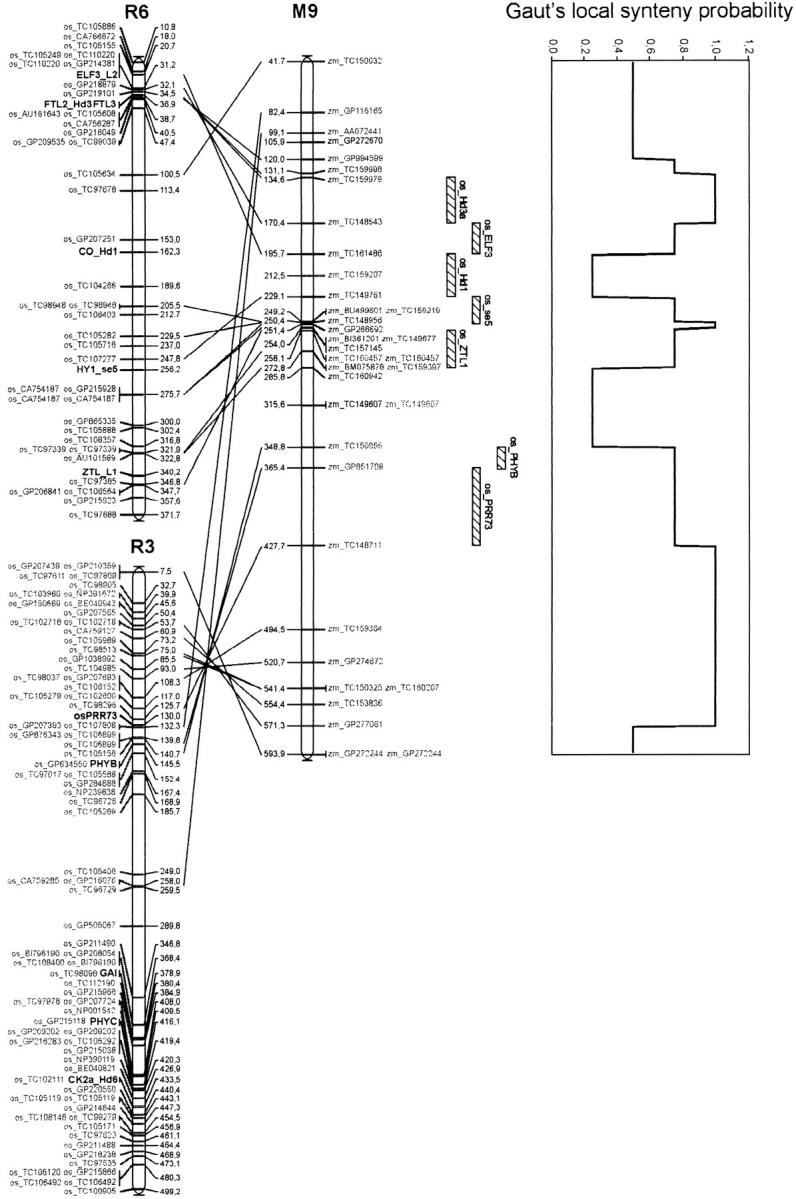
Details of the relationships between maize chromosome 9 and rice chromosomes 6 and 3. Positions are indicated on the chromosome's right side and left side, respectively, for rice and maize. Since the maize genome is more than six times bigger than the rice genome, we multiplied arbitrarily by three every rice genetic distance to facilitate the graphic comparison between the two genomes with MapChart (Voorrips 2002). Hatched rectangles drawn on the right of the maize map represent the projection of rice segments where flowering-time genes have been mapped. Gaut's local synteny probability was plotted along the right side of maize chromosome 9.
Only rice loci with two flanking anchor points connected to a clear syntenic region of maize were projected on the maize genetic map. Twenty-one sequences could therefore be projected on the maize genome, which yielded 30 loci. Locations of these projected loci are shown in Table 2 and Figure 2. Note that, consistent with former results by Paterson et al. (1995) and Basu et al. (2000), who used also a synteny approach, our results predict that two copies of osPHYC might be found in maize on chromosomes 1 and 5, respectively, near the zmPHYA1 and zmPHYA2 loci. For a few genes, it was possible to compare the projection of rice loci with the position of corresponding loci already mapped by means of RFLP in maize. These positions were highly consistent for the osLD gene on chromosome 3, osLFY on chromosomes 2 and 10, and osPHYB loci on chromosomes 1 and 9. The rice orthologous gene of dwarf8, osGAI, was projected onto two maize regions. One has been mapped on chromosome 1 near the dwarf8 and zmPHYA1 loci while the other one has been mapped on chromosome 5 just near the zmPHYA2 locus. This limited comparison between predicted and observed positions illustrates that the projection approach used is globally highly relevant. A further step would be to have indicators to evaluate, a priori, the relevance of a projection. In Table 2, we presented three parameters that aim at this objective: the size of the projected segment in maize, the average Gaut's local synteny probability of the maize segment, and the number of maize markers in the segment that are connected to other rice chromosomes. For instance, the three parameters converge toward a low conservation of synteny for the osLHP loci mapped on chromosome 5. Oppositely, results indicate a very high confidence for the projections of osGI and osFTL2/FTL3 loci, mapped on chromosomes 3 and 9, respectively, and for which the three parameters were satisfactory.
TABLE 2.
Projection results of rice genes onto maize genome
| Projected segments
|
|||||||
|---|---|---|---|---|---|---|---|
| Rice gene | Rice BAC accession no. |
Rice chromosome |
Maize chromosome |
Length in maize (cM) |
Gaut's local synteny probability (%) |
No. NS markersa |
Association with QTLb |
| GI | AC133450 | 1 | 3 | 54 | 100 | 1 | + |
| LD | AP003246 | 1 | 3 | 17 | 72 | 0 | − |
| 1 | 8 | 38 | 26 | 2 | − | ||
| CR12_L3/CR12_L4 | AP005070 | 2 | 5 | 84 | 69 | 1 | + |
| FTL5 | AP004124 | 2 | 5 | 84 | 69 | 1 | + |
| TOC1 | AP004083 | 2 | 5 | 84 | 69 | 1 | + |
| ZTL/LKP2_L2 | AP005412 | 2 | 5 | 1 | 50 | 2 | − |
| CK2a | AC133450 | 3 | 1 | 84 | 25 | 1 | − |
| GAI | AC087797 | 3 | 1 | 1 | 38 | 2 | − |
| 3 | 5 | 3 | 50 | 1 | − | ||
| osPRR73 | AC084405 | 3 | 9 | 62 | 75 | 0 | − |
| PHYB | AC137071 | 3 | 1 | 34 | 29 | 2 | − |
| 3 | 9 | 18 | 74 | 0 | − | ||
| PHYC | AC135225 | 3 | 1 | 57 | 43 | 5 | − |
| 3 | 5 | 53 | 38 | 3 | + | ||
| CR12_L1 | AL606615 | 4 | 4 | 79 | 74 | 3 | + |
| 4 | 10 | 109 | 75 | 1 | − | ||
| LFY | AL607004 | 4 | 2 | 21 | 100 | 0 | + |
| 4 | 10 | 24 | 32 | 2 | + | ||
| ZTL/LKP2_L1 | AP003770 | 6 | 6 | 14 | 53 | 0 | + |
| 6 | 9 | 16 | 75 | 1 | + | ||
| CO_Hd1 | AP003044 | 6 | 9 | 34 | 26 | 2 | + |
| ELF3_L2 | AP000399 | 6 | 6 | 8 | 36 | 1 | + |
| 6 | 9 | 25 | 76 | 0 | + | ||
| FTL2/FTL3 | AP005828 | 6 | 9 | 36 | 100 | 0 | + |
| HY1 | AP003615 | 6 | 9 | 22 | 75 | 0 | + |
| CCA1/LHY | AP004460 | 8 | 4 | 23 | 49 | 1 | + |
| 8 | 10 | 127 | 70 | 5 | + | ||
| LHP | AC074354 | 10 | 5 | 35 | 44 | 4 | + |
| SOC1 | AC092697 | 10 | 1 | 38 | 44 | 0 | + |
| FTL1 | AP002745 | 1 | — | — | — | — | — |
| FTL9 | AP003076 | 1 | — | — | — | — | — |
| ELF3_L1 | AP003296 | 1 | — | — | — | — | — |
| FTL8 | AP003105 | 1 | — | — | — | — | — |
| CR12_L2 | AP005070 | 2 | — | — | — | — | — |
| GA1 | AP005536 | 2 | — | — | — | — | — |
| RCN2 | AP005110 | 2 | — | — | — | — | — |
| PHYA | AP005630 | 2 | — | — | — | — | — |
| FTL6 | AL662946 | 4 | — | — | — | — | — |
| EMF2_L2 | AL606654 | 4 | — | — | — | — | — |
| FTL10 | AC130603 | 5 | — | — | — | — | — |
| osPRR37 | AP005199 | 7 | — | — | — | — | — |
| FIE | AP003896 | 8 | — | — | — | — | — |
| FCA | AP006062 | 9 | — | — | — | — | — |
| EMF2_L1 | AP005890 | 9 | — | — | — | — | — |
| FTL4 | AC137594 | 9 | — | — | — | — | — |
| osPRR95 | AP005314 | 9 | — | — | — | — | — |
| osPRR59 | AC133217 | 11 | — | — | — | — | — |
| FKF1 | AC134053 | 11 | — | — | — | — | — |
| RCN1 | AC116949 | 11 | — | — | — | — | — |
| RCN3 | AL929350 | 12 | — | — | — | — | — |
| FTL7 | AL831806 | 12 | — | — | — | — | — |
Note that 12 sequences homologous to Arabidopsis flowering-time genes have been identified in maize to date: PHYA1 (accession no. AY234826), PHYA2 (accession no. AY260865), PHYB1 (accession no. AY234827), PHYB2 (accession no. AY234828), PHYC1 (accession no. AY234829), PHYC2 (accession no. AY234830), LD (accession no. AF166527), ZFL1 (accession no. AY179882), ZFL2 (accession no. AY179881), DWARF8 (accession no. AF413203), AN1 (accession no. L37750), and ID1 (accession no. AF058757). —, rice genes that could not be projected on the maize genome.
Number of markers mapped in the maize segment that are connected to rice regions other than the projected segment.
The symbols in the top part of the association with QTL column indicate whether the candidate gene colocalized with a consensus QTL (+) or did not (−).
Association of QTL with candidate genes:
Loci involved in flowering time defined by the meta-analysis method are associated with only two maize genes already known (see Figure 2). These genes correspond to both the maize LEAFY-like genes, ZFL1 and ZFL2. The association between the ZFL1 locus and the second hot-spot locus of chromosome 10 and the association of these loci with QTL affecting the four traits supports the assumption that ZFL1 is involved in the control of floral transition, as in Arabidopsis. No association appears between epc, id1, dwarf8, and An1 loci and QTL whereas several publications show that mutations in these three genes affect maize flowering time (Bensen et al. 1995; Colasanti et al. 1998; Peng et al. 1999). Likewise, the zmPHYA1, zmPHYA2, zmPHYB1, zmPHYB2, and zmLD loci are not associated with QTL. It must be noted that their role in the control of the flowering time in maize is still uncertain.
Simulations showed that the average of the overview statistic over the 30 projected segments had only a 1.85% probability to be exceeded by chance (under the global null hypothesis that the choice of candidate genes and/or their projection was not relevant). This indicates that at least part of the associations that are underlined do correspond to a true correspondence between projected candidate genes and consensus QTL. Nineteen projected segments correspond to maize QTL in the sense that projected segments and QTL overlap (see Figure 2). We estimated, for each of the 30 projected segments, the proportion (P) of random segments of the same size that have an average overview statistic equal to or higher than that observed. This proportion varied between 1.6 and 87.0%. It was on average 19.6% for the 19 segments that overlapped with QTL and 60.0% for the 11 that do not overlap. P-values were used to estimate corresponding FDR and Q-values. We observed that the QVALUE software provided stable results over a large range of the tuning parameter λ (between 0.25 and 0.7) and that these results (for λ = 0.7) were intermediate between those estimated with the default option of the program (lowest Q-values) and those estimated with the original false discovery rate approach (highest values, consistent with the known bias of this approach, see material and methods). The 19 segments that overlap with consensus QTL had an average FDR of 48% and average Q-values of 6.6% (default option of the program) and 24% (at λ = 0.7). This last result indicates that only approximately one-fourth of these associations are expected to be due to chance.
On chromosome 1, the osSOC1 locus is associated with QTL affecting the silking date. OsGI is mapped to chromosome 3 close to QTL influencing silking date, leaf number, and plant height traits. On chromosome 4, osCRY12_L1 and osCCA1 are associated with QTL affecting flowering time. On chromosome 5, osFT-like5, osTOC1, and osCRY12_L3 are together associated with the same QTL affecting flowering time. On chromosome 5, a QTL affecting silking date is associated with osLHP, and QTL affecting height and leaf number are associated with osPHYC. OsZTL/LKP2_L2 and osELF3_L2 correspond to the same QTL affecting flowering time on chromosome 6. Another osZTL/LKP2_L2 locus is associated with the hot-spot locus of chromosome 9 (near the csu147 marker). On the same chromosome, QTL affecting flowering time were associated with a region where are mapped osELF3_L2 and three major QTL cloned in rice, osCO (Hd1), osFT-like2 (Hd3a), and osHY1 (se5). QTL affecting plant height and flowering time were associated with the CCA1/LHY gene on chromosome 10. Although most of the maize phytochrome genes seemed not to be associated with QTL for flowering time, associations appeared between QTL and genes of circadian clock complex (ZTL, TOC1, CCA1, ELF3, …) or genes of integrative mechanisms (SOC1, FT-Like, LHP, …).
DISCUSSION
Synthesis of initial QTL results by means of overview and meta-analysis:
Flowering time plays a key role in the adaptation of maize to various environmental conditions. It is also relatively easy to score when compared to other physiological traits that require heavy experimentation (e.g., Reymond et al. 2003 for drought tolerance), so that several studies have addressed QTL mapping for this and related traits, in several tens of mapping populations. A very large body of QTL information is therefore presently available (313 documented here). Synthesizing this information provides a unique opportunity to understand the genetic variation of flowering time within a large range of diversity. It also raises several methodological questions that are addressed below.
First, only very few markers, if any, are common to all the genetic maps that were used for QTL mapping. Any global analysis therefore first necessitates the projection of QTL (most likely positions and confidence intervals) on the same genetic map. Projection was performed here on a map derived from the international maize reference map (IBM), completed for markers that were used in QTL mapping experiments (Falque et al. 2003). A similar objective was followed in the Maize Mapping Project (http://www.maizemap.org), where the IBM2 neighbors map was constructed by integrating loci from several maps. This approach allowed a first global visualization of regions of the genome that appear repetitively involved in flowering-time variation. Some positions were covered by up to 16 QTL confidence intervals, whereas 74% of the maize genome was not covered by any QTL confidence intervals.
We developed and calculated the overview statistic to highlight regions of the genome that have a key contribution to the variation of the trait of interest in the experiments that were synthesized. In a given region of the genome, this parameter increases with (i) the number of experiments for which the region displayed significant QTL effects, (ii) the proximity of QTL positions estimated in the different experiments, and (iii) the precision of QTL position estimation in individual experiments. As illustrated by Equation 1, this last precision increases with the contribution of a QTL to trait variation and the size of the mapping population that was used. This statistic was compared over the genome to that expected from the number of initial QTL per experiment, with no information on their positions. It exceeded this threshold for a total of 69 regions. These included six hot spots for which QTL were strongly involved in flowering time in several experiments. These regions should therefore have a particular importance in the control of this trait in maize.
We then used the meta-analysis statistical approach of Goffinet and Gerber (2000) to estimate the number of consensus QTL in each region. A cluster of QTL found in different experiments can indeed correspond to either (i) a single QTL with estimated positions of which vary due to experimental error or (ii) several linked QTL, the effects of which depend on the population. Meta-analysis makes it possible to test these alternative hypotheses. Tests concluded here to a total of 62 consensus QTL. Only 6 of 62 consensus QTL (<10%) had a significant effect in a single experiment (afterward referred to as singletons), whereas a given consensus QTL could display significant effects in up to 16 experiments. We can first anticipate from this distribution that new independent QTL mapping experiments for flowering time in maize are more likely to confirm regions of the genome already known to affect the trait than to lead to the discovery of new regions. Knowledge about regions that often affect flowering time in breeding material will be helpful for breeders to monitor the development of material adapted to specific environmental conditions, using marker-assisted selection.
The high variation in the number of experiments in which a QTL shows a significant effect can be due to both statistical and biological factors. In almost the totality of QTL experiments, the authors used stringent statistical criteria, making it unlikely that a significant proportion of singletons are false positives. Conversely, it is well established that this conservative approach associated with generally limited population sizes decreases the power of QTL detection. A large fraction of QTL that appear here as singletons may therefore have contributed to trait variation in other experiments but did not appear as significant. From a biological standpoint, differences may first be due to a difference in allelic variation at the QTL. A population with a parent that carries a rare allele with strong effect at a QTL will likely yield a singleton for this QTL. Other factors such as epistasis between a QTL and other QTL are also likely, despite the limited amount of information available on such effects. Analysis of these phenomena calls for further developments that would take into account not only positions in initial experiments but also parental effects and possibly reconsider individual genotyping and phenotyping data obtained in these experiments.
Finally, in addition to estimating a consensus number of QTL, meta-analysis makes it possible to take advantage of all existing information to refine the positions of QTL. For the six major positions discussed above, these new positions appeared on average 1.8 times more precise than the most precise position estimated in individual experiments. This gain in precision can be beneficial to the identification of candidate genes for QTL. The meta-analysis approach proposed by Goffinet and Gerber (2000) therefore appears as a highly promising strategy to propose a synthetic interpretation of results obtained in numerous experiments. It calls, however, for further statistical developments. It first can be noted that some QTL have a very high weight in meta-analysis results and that permutation tests may be useful to estimate the stability of the results. It also must be noted that the meta-analysis approach that was used relies on the assumption that all initial QTL positions were estimated independently (i.e., different populations or independent samples of individuals). Former analysis includes some cases where initial QTL for a region include several traits that were estimated for the same population. Such situations are in limited number and meta-analyses of QTL conducted for individual traits (data not shown) gave consistent results with those presented here. Indeed, we observed that the confidence interval of consensus QTL obtained with the global analysis had generally the same length as that of the most precise corresponding single-trait consensus QTL. However, nonindependence between QTL position estimations may be more important in other studies and specific approaches (not yet available to our knowledge) should be developed to take into account the effect of individual sampling and other factors on the covariance between QTL position estimations.
Associations between QTL and maize genes:
The 69 regions highlighted by the overview statistic were resolved into 62 consensus QTL by using meta-analysis. It can be noted that the order of magnitude of these numbers is comparable to that of the 80 genes known to be involved in flowering time in Arabidopsis (Blazquez 2000) and to present knowledge about 20 genes in rice (Yano and Sasaki 1997; Yano et al. 2001). To further understand the genetic basis of flowering-time variation, we first investigated the association between QTL and genes known to control this trait in maize. Our results showed only two associations, concerning the two LEAFY orthologous genes, ZFL1 and ZFL2. As reported by Bomblies et al. (2003), these associations also suggested that the two copies of LEAFY are both implicated in the control of floral transition in maize.
On the other hand, we observed no association between the dwarf8 locus and QTL. This was surprising because Thornsberry et al. (2001) showed that dwarf8 polymorphisms were associated with the quantitative variation of flowering time and plant height in a population of maize inbred lines. This observation can have several causes. First, the parental lines used in the QTL experiments may have the same or equivalent allelic forms of the dwarf8 gene, which does not allow the detection of any QTL. Second, despite polymorphism between parental lines, strong epistatic interactions within mapping populations may have diminished the effect of dwarf8. For this reason, this gene may have contributed to flowering-time variation in QTL mapping experiments but its effect was too mild to be significant. As for dwarf8, the id1 locus was not associated with QTL although the mutation strongly affects the floral transition. However, the id1 locus is very close to a region identified by meta-analysis.
It can be noted that the number of flowering-time mutants described in maize is low when compared to the total number of QTL determined in our review. However, ongoing work in several groups, by using a combination of reverse genetics, transgenic approaches, and association genetics, should lead to an increased number of cloned flowering-time genes during the next decade. Such efforts should lead to the discovery of candidate genes for QTL hot spots and regions of milder effects. Salvi et al. (2002) forecasts cloning soon, using a positional approach, the vgt1 locus, which corresponds to a major consensus QTL on chromosome 8. Danilevskaya et al. (2003) have suggested that an orthologous gene of FT was a candidate gene for locus vgt2, which corresponds to the second major consensus locus of chromosome 8.
Evaluation of synteny approach:
The relationships between maize and rice genomes reveal a high conservation of gene content and order. The results that we obtained by comparing maize and rice TC sequences document in more detail the relationships highlighted first with RFLP (Devos and Gale 1997; Wilson et al. 1999). The average synteny probability for the whole maize genome is 45.8%, which is comparable to Gaut's estimation of 52.5% made with RFLP (Gaut 2002). Numerous small rearrangements are visible in specific regions, consistent with results of the genomic approach of Dunford et al. (2002), where they decrease strongly the local probability of finding conserved genes between the two species. The estimate of synteny therefore presents a high variation between the chromosomes and variation along them, too (see Table 3 and Figure 5, respectively).
TABLE 3.
Average value of local synteny probability between maize and rice along maize chromosomes
| Maize chromosome |
Local synteny probability (%) |
|---|---|
| 1 | 37.7 |
| 2 | 45.1 |
| 3 | 59.8 |
| 4 | 36.2 |
| 5 | 41.1 |
| 6 | 51.5 |
| 7 | 32.7 |
| 8 | 47.5 |
| 9 | 74.0 |
| 10 | 34.9 |
Using our comparative map, the projection of rice candidate genes has been carried out to research new candidate genes for maize flowering-time QTL, to compensate for the lack of flowering-time genes presently cloned in maize. Combination of meta-analysis results and the synteny approach provided 19 associations between QTL and candidate genes out of which 2 were already known from maize genetic mapping (ZFL1 and ZFL2 genes) and 17 are new. Simulations first showed that the congruency between QTL and projected regions was higher than that expected by chance (global null hypothesis that the choice of candidate genes and/or their projection was not relevant). Application of the Q-value approach to our data showed that ∼5 associations that were found may be due to chance, whereas the others are expected to be observed because of a true effect of the projected gene on flowering-time variation. This underlines that genes, the projection of which is associated with QTL in this study, can be considered as highly relevant for further studies such as cloning and mapping homologs in maize, verification of colocalization with finely mapped QTL, followed by validation experiments. Conversely, some maize QTL are not associated with any rice candidate gene, despite that synteny probability is high in the region. Such situations could be due (i) to the presence of local gaps in the rice genome sequence presently available, which does not allow us to find a candidate gene by homology with Arabidopsis gene sequences, (ii) to the existence of maize genes involved in flowering time that share no or very limited homology with any rice gene, or (iii) to the fact that the corresponding gene is specific to grasses and has not been identified in rice yet. This last hypothesis is supported by the fact that two rice flowering-time cloned genes (Hd6 and se5) do not seem to be essential for flowering in Arabidopsis (Izawa et al. 2000; Takahashi et al. 2001). These results illustrate the importance of studying flowering time in grasses, to identify specific genes involved in development. Finally, several regions of the maize genome present no synteny with the rice genome. It is then impossible to find a candidate gene from rice for these regions. In this case, it is necessary to develop maize-specific strategies, like searching maize EST sequences, which present high identity with rice and/or Arabidopsis candidate genes, and mapping the corresponding loci.
Toward a genetic model of flowering time in maize:
Projected rice gene locations and the implication of corresponding candidate genes in the control of maize flowering time deserve validation experiments to identify whether or not a given individual candidate gene truly affects flowering time in maize. Colocalization, and also absence of colocalization, which was found for different gene families, leads to different hypotheses for future studies. Associations were observed with genes of photoreceptors (PHYC and CRY1/2), genes of circadian clock (TOC1, ZTL, ELF3, and CCA1/LHY), and genes of the repressive and integrative systems (GI, CO, SOC1, FT-like, LHP, and LFY). These results support the idea that the photoperiod pathway is important in maize, consistent with its well-established role in rice and Arabidopsis. On the other hand, most of the phytochrome loci in maize are not associated with QTL for flowering time, suggesting that phytochromes have no contribution in the photoperiodic control of flowering. This is supported by results of Takano et al. (2001), which showed no significant difference for plant height and heading date between wild-type and phyA mutant rice plants. Analyses of Arabidopsis photoreceptor mutants also have revealed relatively small contributions of phytochromes in the photoperiodic control of flowering. PhyA mutants of Arabidopsis flower later than the wild type under long-day conditions with a far-red-enriched light source, while in addition to PHYB, light-stable phytochromes regulate flowering in response to light quality in Arabidopsis. In contrast, a recent study of CRY2, a blue-light receptor of Arabidopsis, shows that CRY2 plays an important role in the photoperiodic control of flowering (El-Assal et al. 2003). The analysis of CRY2 alleles in different genetic backgrounds suggests that CRY2 does not require functional CRY1 or PHYA but it needs the product of CO and GI genes to promote flowering. Comparing these analyses with our results provides an insight into the function of cryptochrome in the regulation of flowering induction in maize. Associations between QTL and the genes of circadian clock without association with the photoreceptor system suggest that the circadian clock in maize should affect flowering time independently of the photoperiod perception. Our hypothesis is that some of the QTL that are not associated with candidate genes could be explained by different members of the circadian clock genetic complex.
Finally, it can be noted that the conservation of a gene between species is not synonymous with a conservation of its function or its effect. For example, the control of the photoperiod response involves the same genes in Arabidopsis and in rice: the GI, CO, and FT genes. The activity of CO is reversed in rice compared with Arabidopsis (Hayama et al. 2003). It reveals that an important developmental process can use the same set of genes, but different regulation interactions. Comparison of such interactions in maize and rice should deserve consideration.
Conclusion:
Overview and meta-analysis of QTL detected in a wide series of experiments are two complementary tools to identify regions of the maize genome and estimate the number of QTL involved in the control of flowering time in maize. Starting with 313 QTL, we could underline 69 regions by using the overview statistic and resolve these into 62 consensus QTL by using meta-analysis. This last approach also yielded an increased precision in the estimation of QTL positions. Future improvements of meta-analysis should take into account parental effects estimated in the initial QTL analysis. Parental lines common to different QTL experiments indeed make it possible to estimate the relative effects of several parental alleles, which is of key importance for applied breeding and also biological knowledge.
Thanks to the Maize Genome Sequencing Project (Chandler and Brendel 2002), an increasing amount of genomic sequences will be available for regions involved in the variation of traits of interest. This will facilitate to a large extent the identification of candidate genes for QTL. While we wait for this promising information, our results indicate that synteny conservation between rice and maize permits an efficient use of rice sequence information to identify candidate genes for maize QTL. The same approach should also lead to a good insight into the genetic control of flowering time in other grass species, such as wheat, sorghum, ryegrass, etc. Validation of gene projection is then possible by mapping within the species of interest, using EST or genomic sequences. Function validation in the species of interest can be achieved through the identification of mutants in mutated populations, the development of transgenic plants with rice or Arabidopsis genes, and with association studies between sequence polymorphism and phenotypic variation. Finally, comparative analysis of QTL between species suggests the existence of homologous QTL for plant height and maturity within the grass family (Lin et al. 1995). Increasing precision in synteny relationships between genomes may make it possible to achieve an interspecific meta-analysis of QTL after projection onto the same reference genome, to better document the genetic architecture of flowering time.
Acknowledgments
We are grateful to Bruno Goffinet and Jean-Baptiste Veyrieras for helpful statistical comments on the manuscript, to Guylaine Blanc for the analysis of QTL integrated into this study, to Jean-Pierre Martinant for helpful reading of the manuscript, and to anonymous reviewers for very helpful comments. This work was supported by the Génoplante program.
References
- Abler, B. S. B., M. D. Edwards and C. W. Stuber, 1991. Isoenzymatic identification of quantitative trait loci in crosses of elite maize inbreds. Crop Sci. 31: 267–274. [Google Scholar]
- Altschul, S. F., T. L. Madden, A. A. Schaeffer, J. Zhang, Z. Zhang et al., 1997. Gapped BLAST and PSI-BLAST: a new generation of protein database search programs. Nucleic Acids Res. 25: 3389–3402. [DOI] [PMC free article] [PubMed] [Google Scholar]
- Arcade, A., A. Labourdette, M. Falque, B. Mangin, F. Chardon et al., 2004. BioMercator: integrating genetic maps and QTL towards discovery of candidate genes. Bioinformatics 20: 2324–2326. [DOI] [PubMed] [Google Scholar]
- Austin, D. F., and M. Lee, 1996. Genetic resolution and verification of quantitative trait loci for flowering and plant height with recombinant inbred lines of maize. Genome 39: 957–968. [DOI] [PubMed] [Google Scholar]
- Basu, D., K. Dehesh, H. J. Schneider-Poetsch, S. E. Harrington, S. R. McCouch et al., 2000. Rice PHYC gene: structure, expression, map position and evolution. Plant Mol. Biol. 41: 27–42. [DOI] [PubMed] [Google Scholar]
- Beavis, W. D., O. S. Smith, D. Grant and R. Fincher, 1994. Identification of quantitative trait loci using a small sample of topcrossed and F4 progeny from maize. Crop Sci. 34: 882–896. [Google Scholar]
- Benjamini, Y., and Y. Hochberg, 1995. Controlling the false discovery rate: a practical and powerful approach to multiple testing. J. R. Stat. Soc. B 57: 289–300. [Google Scholar]
- Bennetzen, J. L., and D. A. Laurie, 1993. Grasses as a single genetic system: genome analysis, colinearity and compatibility. Trends Genet. 9: 259–261. [DOI] [PubMed] [Google Scholar]
- Bensen, R. J., G. S. Johal, V. C. Crane, J. T. Tossberg, P. S. Schnable et al., 1995. Cloning and characterization of the maize An1 gene. Plant Cell 7: 75–84. [DOI] [PMC free article] [PubMed] [Google Scholar]
- Blanc, G., L. Moreau, B. Mangin and A. Charcosset, 2003 QTL detection in connected populations of maize. 12th Meeting of the EUCARPIA Section of Biometrics in Plant Breeding, Spain, p. 55.
- Blazquez, M. A., 2000. Flower development pathways. J. Cell Sci. 113: 3547–3548. [DOI] [PubMed] [Google Scholar]
- Bohn, M., M. M. Khairallah, D. Gonzalez-de-Leon, D. A. Hoisington, H. F. Utz et al., 1996. QTL mapping in tropical maize: I. Genomic regions affecting leaf feeding resistance to sugarcane borer and other traits. Crop Sci. 36: 1352–1361. [Google Scholar]
- Bohn, M., B. Schulz, R. Kreps, D. Klein and A. Melchinger, 2000. QTL mapping for resistance against the European corn borer (Ostrinia nubilalis H.) in early maturing European dent germplasm. Theor. Appl. Genet. 1001: 907–917. [DOI] [PubMed] [Google Scholar]
- Bomblies, K., R. L. Wang, B. A. Ambrose, R. J. Schmidt, R. B. Meeley et al., 2003. Duplicate FLORICAULA/LEAFY homologs zfl1 and zfl2 control inflorescence architecture and flower patterning in maize. Development 130: 2385–2395. [DOI] [PubMed] [Google Scholar]
- Bouchez, A., F. Hospital, M. Causse, A. Gallais and A. Charcosset, 2002. Marker-assisted introgression of favorable alleles at quantitative trait loci between maize elite lines. Genetics 162: 1945–1959. [DOI] [PMC free article] [PubMed] [Google Scholar]
- Cardinal, A. J., M. Lee, N. Sharopova, W. L. Woodman-Clikeman and M. J. Long, 2001. Genetics mapping and analysis of quantitative trait loci for resistance to stalk tunneling by the European corn borer in maize. Crop Sci. 41: 835–845. [Google Scholar]
- Chandler, V. L., and V. Brendel, 2002. The Maize Genome Sequencing Project. Plant Physiol. 130: 1594–1597. [DOI] [PMC free article] [PubMed] [Google Scholar]
- Christensen, A. H., and P. H. Quail, 1989. Structure and expression of a maize phytochrome-encoding gene. Gene 85: 381–390. [DOI] [PubMed] [Google Scholar]
- Colasanti, J., Z. Yuan and V. Sundaresan, 1998. The indeterminate gene encodes a zinc finger protein and regulates a leaf-generated signal required for the transition to flowering in maize. Cell 93: 593–603. [DOI] [PubMed] [Google Scholar]
- Dabney, A., and J. D. Storey, 2003 QVALUE. University of Washington, Seattle.
- Danilevskaya, O., P. Hermon, D. Shirbroun, E. Bruggemann, M. Muszynski et al., 2003 Functional analysis of the maize FT/TFL homologs reveals potential players in the floral transition, Abstract 490 in Plant Biology 2003, edited by S. Rosenberry. ASPB, Rockville, MD.
- Darvasi, A., and M. Soller, 1997. A simple method to calculate resolving power and confidence interval of QTL map location. Behav. Genet. 27: 125–132. [DOI] [PubMed] [Google Scholar]
- Dehesh, K., J. M. Tepperman, A. H. Christensen and P. Quail, 1991. phyB is evolutionarily conserved and constitutively expressed in rice seedling shoots. Mol. Gen. Genet. 225: 305–313. [DOI] [PubMed] [Google Scholar]
- Delvin, B., K. Roeder and L. Wasserman, 2003. False discovery or missed discovery? Heredity 91: 537–538. [DOI] [PubMed] [Google Scholar]
- Devos, K. M., and M. D. Gale, 1997. Comparative genetics in the grasses. Plant Mol. Biol. 35: 3–15. [PubMed] [Google Scholar]
- Dunford, R. P., M. Yano, N. Kurata, T. Sasaki, G. Huestis et al., 2002. Comparative mapping of the barley Ppd-H1 photoperiod response gene region, which lies close to a junction between two rice linkage segments. Science 161: 825–834. [DOI] [PMC free article] [PubMed] [Google Scholar]
- El-Assal, S. E., C. Alonso-Blanco, A. J. Peeters, C. Wagemaker, J. L. Weller et al., 2003. The role of cryptochrome 2 in flowering in Arabidopsis. Plant Physiol. 133: 1–13. [DOI] [PMC free article] [PubMed] [Google Scholar]
- Falque, M., L. Décousset, A. Murigneux, N. Dautrevaux, D. Dervins et al., 2003 Large-scale cDNA mapping for candidate gene approach. Abstract 116 of the 45th Annual Maize Genetics Conference, University of Missouri, Columbia, MO.
- Gaut, B. S., 2002. Evolutionary dynamics of grass genomes. New Phytol. 154: 15–28. [Google Scholar]
- Goff, S. A., D. Ricke, T. H. Lan, G. Presting, R. Wang et al., 2002. A draft sequence of the rice genome (Oryza sativa L. ssp. japonica). Science 296: 92–100. [DOI] [PubMed] [Google Scholar]
- Goffinet, B., and S. Gerber, 2000. Quantitative trait loci: a meta-analysis. Genetics 155: 463–473. [DOI] [PMC free article] [PubMed] [Google Scholar]
- Groh, S., M. M. Khairallah, D. Gonzalez-de-Leon, M. Willcox, C. Jiang et al., 1998. Comparison of QTLs mapped in RILs and their test-cross progenies of tropical maize for insect resistance and agronomic traits. Plant Breed. 117: 193–202. [Google Scholar]
- Hayama, R., S. Yokoi, S. Tamaki, M. Yano and K. Shimamoto, 2003. Adaptation of photoperiodic control pathways produces short-day flowering in rice. Nature 422: 719–722. [DOI] [PubMed] [Google Scholar]
- Irish, E. E., and T. M. Nelson, 1991. Identification of multiple stages in the conversion of maize meristems from vegetative to floral development. Development 112: 891–898. [Google Scholar]
- Izawa, T., T. Oikawa, S. Tokutomi, K. Okuno and K. Shimamoto, 2000. Phytochromes confer the photoperiodic control of flowering in rice (a short-day plant). Plant J. 22: 391–399. [DOI] [PubMed] [Google Scholar]
- Izawa, T., Y. Takahashi and M. Yano, 2003. Comparative biology comes into bloom: genomic and genetic comparison of flowering pathways in rice and Arabidopsis. Curr. Opin. Plant Biol. 6: 113–120. [DOI] [PubMed] [Google Scholar]
- Kearsey, M. J., and A. G. Farquhar, 1998. QTL analysis in plants: Where are we now? Heredity 80: 137–142. [DOI] [PubMed] [Google Scholar]
- Koester, R. P., P. H. Sisco and C. W. Stuber, 1993. Identification of quantitative trait loci controlling days to flowering and plant height in two near isogenic lines of maize. Crop Sci. 33: 1209–1216. [Google Scholar]
- Kojima, S., Y. Takahashi, Y. Kobayashi, L. Monna, T. Sasaki et al., 2002. Hd3a, a rice ortholog of the Arabidopsis FT gene, promotes transition to flowering downstream of Hd1 under short-day conditions. Plant Cell Physiol. 43: 1096–1105. [DOI] [PubMed] [Google Scholar]
- Koornneef, M., C. Alonso-Blanco, A. J. Peeters and W. Soppe, 1998. Genetic control of flowering time in Arabidopsis. Annu. Rev. Plant Physiol. Plant Mol. Biol. 49: 345–370. [DOI] [PubMed] [Google Scholar]
- Laurie, D. A., 1997. Comparative genetics of flowering time. Plant Mol. Biol. 35: 167–177. [PubMed] [Google Scholar]
- Lee, M., N. Sharopova, W. D. Beavis, D. Grant, M. Katt et al., 2002. Expanding the genetic map of maize with the intermated B73 x Mo17 (IBM) population. Plant Mol. Biol. 48: 453–461. [DOI] [PubMed] [Google Scholar]
- Lin, Y. R., K. F. Schertz and A. H. Paterson, 1995. Comparative analysis of QTLs affecting plant height and maturity across the poacea, in reference to an interspecific sorghum population. Genetics 141: 391–411. [DOI] [PMC free article] [PubMed] [Google Scholar]
- Lübberstedt, T., A. Melchinger, C. C. Schön, H. F. Utz and D. Klein, 1997. Qtl mapping in testcrosses of European flint lines of maize: I. Comparison of different testers for forage yield traits. Crop Sci. 37: 921–931. [Google Scholar]
- Lynch, M., and B. Walsh, 1998 Genetics and Analysis of Quantitative Traits. Sinauer Associates, Sunderland, MA.
- McSteen, P., D. Laudencia-Chingcuanco and J. Colasanti, 2000. A floret by any other name: control of meristem identity in maize. Trends Plant Sci. 5: 61–66. [DOI] [PubMed] [Google Scholar]
- Mechin, V., O. Argillier, Y. Hébert, E. Guingo, L. Moreau et al., 2001. Genetic analysis and QTL mapping of cell wall digestibility and lignification in silage maize. Crop Sci. 41: 690–697. [Google Scholar]
- Michaels, S. D., and R. M. Amasino, 2001. Loss of FLOWERING LOCUS C activity eliminates the late-flowering phenotype of FRIGIDA and autonomous pathway mutations but not responsiveness to vernalization. Plant Cell 13: 935–941. [DOI] [PMC free article] [PubMed] [Google Scholar]
- Millar, A. J., 2004. Input signals to the plant circadian clock. J. Exp. Bot. 55: 277–283. [DOI] [PubMed] [Google Scholar]
- Moreau, L., 1998 Contribution méthodologique et expérimentale à l'étude de la sélection assistée par marqueurs: application au maïs. Ph.D. Thesis, Institut National Agronomique, Paris-Grignon.
- Murakami, M., M. Ashikari, K. Miura, T. Yamashino and T. Mizuno, 2003. The evolutionarily conserved OsPRR quintet: rice pseudo-response regulators implicated in circadian rhythm. Plant Cell Physiol. 44: 1229–1236. [DOI] [PubMed] [Google Scholar]
- Ogas, J., 1998. Dissecting the gibberellin response pathway. Curr. Biol. 8: R165–R167. [DOI] [PubMed] [Google Scholar]
- Paterson, A. H., Y. R. Lin, Z. Li, K. F. Schertz, J. F. Doebley et al., 1995. Convergent domestication of cereal crops by independent mutations at corresponding genetic loci. Science 269: 1714–1718. [DOI] [PubMed] [Google Scholar]
- Paterson, A. H., J. E. Bowers, D. G. Peterson, J. C. Estill and B. A. Chapman, 2003. Structure and evolution of cereal genomes. Curr. Opin. Genet. Dev. 13: 644–650. [DOI] [PubMed] [Google Scholar]
- Peng, J., D. E. Richards, N. M. Hartley, G. P. Murphy, K. M. Devos et al., 1999. ‘Green revolution’ genes encode mutant gibberellin response modulators. Nature 400: 256–261. [DOI] [PubMed] [Google Scholar]
- Ragot, M., P. H. Sisco, D. Hoisington and C. W. Stuber, 1995. Molecular-marker-mediated characterization of favourable exotic alleles at quantitative trait loci in maize. Crop Sci. 35: 1306–1315. [Google Scholar]
- Rebaï, A., P. Blanchard, D. Perret and P. Vincourt, 1997. Mapping quantitative trait loci controlling silking date in a diallel cross among four lines in maize. Theor. Appl. Genet. 95: 451–459. [Google Scholar]
- Reymond, M., B. Muller, A. Leonardi, A. Charcosset and F. Tardieu, 2003. Combining quantitative trait loci analysis and an ecophysiological model to analyze the genetic variability of the responses of maize leaf growth to temperature and water deficit. Plant Physiol. 131: 664–675. [DOI] [PMC free article] [PubMed] [Google Scholar]
- Ribaut, J.-M., D. Hoisington, J. A. Deutsch, C. Jiang and D. Gonzalez-de-Leon, 1996. Identification of quantitative trait loci under drought conditions in tropical maize. 1. Flowering parameters and the anthesis-silking interval. Theor. Appl. Genet. 92: 905–914. [DOI] [PubMed] [Google Scholar]
- Salvi, S., R. Tuberosa, E. Chiapparino, M. Maccaferri, S. Veillet et al., 2002. Toward positional cloning of Vgt1, a QTL controlling the transition from the vegetative to the reproductive phase in maize. Plant Mol. Biol. 48: 601–613. [DOI] [PubMed] [Google Scholar]
- Simon, R., M. I. Igeno and G. Coupland, 1996. Activation of floral meristem identity genes in Arabidopsis. Nature 384: 59–62. [DOI] [PubMed] [Google Scholar]
- Storey, J. D., and R. Tibshirani, 2003. Statistical significance for genomewide studies. Proc. Natl. Acad. Sci. USA 100: 9440–9445. [DOI] [PMC free article] [PubMed] [Google Scholar]
- Stuber, C. W., S. E. Lincoln, D. W. Wolff, T. Helentjaris and E. S. Lander, 1992. Identification of genetic factor contributing to heterosis in a hybrid from two elite maize indred lines using molecular markers. Genetics 132: 823–839. [DOI] [PMC free article] [PubMed] [Google Scholar]
- Suarez-Lopez, P., K. Wheatley, F. Robson, H. Onouchi, F. Valverde et al., 2001. CONSTANS mediates between the circadian clock and the control of flowering in Arabidopsis. Nature 410: 1116–1120. [DOI] [PubMed] [Google Scholar]
- Takahashi, Y., A. Shomura, T. Sasaki and M. Yano, 2001. Hd6, a rice quantitative trait locus involved in photoperiod sensitivity, encodes the alpha subunit of protein kinase CK2. Proc. Natl. Acad. Sci. USA 98: 7922–7927. [DOI] [PMC free article] [PubMed] [Google Scholar]
- Takano, M., H. Kanegae, T. Shinomura, A. Miyao, H. Hirochika et al., 2001. Isolation and characterization of rice phytochrome A mutants. Plant Cell 13: 521–534. [DOI] [PMC free article] [PubMed] [Google Scholar]
- Thornsberry, J. M., M. M. Goodman, J. F. Doebley, S. Kresovich, D. Nielsen et al., 2001. Dwarf8 polymorphisms associate with variation in flowering time. Nat. Genet. 28: 286–289. [DOI] [PubMed] [Google Scholar]
- Vandepoele, K., C. Simillion and Y. Van de Peer, 2003. Evidence that rice and other cereals are ancient aneuploids. Plant Cell 15: 2192–2202. [DOI] [PMC free article] [PubMed] [Google Scholar]
- van Nocke, S., M. Muszynski, K. Briggs and R. M. Amasino, 2000. Characterization of a gene from Zea mays related to Arabidopsis flowering-time gene LUMINIDEPENDENS. Plant Mol. Biol. 44: 107–122. [DOI] [PubMed] [Google Scholar]
- Vega, S. H., M. Sauer, J. A. J. Orkwiszewski and R. S. Poethig, 2002. The early phase change gene in maize. Plant Cell 14: 133–147. [DOI] [PMC free article] [PubMed] [Google Scholar]
- Veldboom, L. R., and M. Lee, 1996. Genetic mapping of quantitative trait loci in maize in stress and nonstress environments: II. Plant height and flowering. Crop Sci. 36: 1320–1327. [Google Scholar]
- Visscher, P. M., C. S. Haley and R. D. Thompson, 1996. Marker-assisted introgression in backcross breeding programs. Genetics 144: 1923–1932. [DOI] [PMC free article] [PubMed] [Google Scholar]
- Vladutu, C., J. McLaughlin and R. L. Phillips, 1999. Fine mapping and characterization of linked quantitative trait loci involved in the transition of the maize apical meristem from vegetative to generative structures. Genetics 153: 993–1007. [DOI] [PMC free article] [PubMed] [Google Scholar]
- Voorrips, R. E., 2002. MapChart: software for the graphical presentation of linkage maps and QTLs. J. Hered. 93: 77–78. [DOI] [PubMed] [Google Scholar]
- Wilson, W. A., S. E. Harrington, W. L. Woodman, M. Lee, M. E. Sorrells et al., 1999. Inferences on the genome structure of progenitor maize through comparative analysis of rice, maize and the domesticated panicoids. Genetics 153: 453–473. [DOI] [PMC free article] [PubMed] [Google Scholar]
- Yano, M., and T. Sasaki, 1997. Genetic and molecular dissection of quantitative traits in rice. Plant Mol. Biol. 35: 145–153. [PubMed] [Google Scholar]
- Yano, M., Y. Katayose, M. Ashikari, U. Yamanouchi, L. Monna et al., 2000. Hd1, a major photoperiod sensitivity QTL in rice, is closely related to the Arabidopsis flowering time gene CONSTANS. Plant Cell 12: 2473–2483. [DOI] [PMC free article] [PubMed] [Google Scholar]
- Yano, M., S. Kojima, Y. Takahashi, H. Lin and T. Sasaki, 2001. Genetic control of flowering time in rice, a short-day plant. Plant Physiol. 127: 1425–1429. [PMC free article] [PubMed] [Google Scholar]
- Yu, J., S. Hu, J. Wang, G. K. Wong, S. Li et al., 2002. A draft sequence of the rice genome (Oryza sativa L. ssp. indica). Science 296: 79–92. [DOI] [PubMed] [Google Scholar]